vue中添加echarts
方法一:全局引入echarts
步骤:
1、全局安装 echarts依赖。 cnpm install echarts -- save
2、引入echarts模块,在Vue项目的main.js中引入echarts模块,即是写入如下代码:
import echarts from 'echarts'

Vue.prototype.$echarts = echarts
3、在需要的组件,如index.vue中
<template>
<div class="echart-box" id="E_zkcl" style="width: 380px;
height:330px"></div>
</template>
<script>
export default {
data(){
return(){
}
},
methods: {
drawLine(){
let myChart1 = this.$echarts.init(document.getElementById('E_zkcl')) }
myChart1.setOption({
color:['#4ED8DA'],
title : {
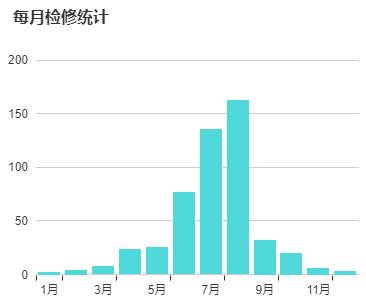
text: '每月检修统计',
x:,
y:,
textStyle:{
fontSize: ,
fontWeight: 'bolder',
color: '#333'
}
},
tooltip : {
trigger: 'axis'
},
grid:{
borderWidth:,
x:'10%',
y:'20%',
x2:'5%',
y2:'15%',
},
calculable : true,
xAxis : [
{
type : 'category',
axisLine:{
show:false,
},
splitLine:{
show:false, //不显示分割线
},
data: ['1月', '2月', '3月', '4月', '5月', '6月', '7月', '8月', '9月', '10月', '11月', '12月']
}
],
yAxis : [
{
type : 'value',
axisLine:{
show:false,
}
}
],
series : [
{
name:'数量',
type:'bar',
data:[, , , , , , , , , , , ],
}
]
});
//根据窗口的大小变动图表 --- 重点
window.onresize = function(){
myChart.resize();
//myChart1.resize(); //若有多个图表变动,可多写
}
},
         mounted(){

           this.drawLine();

            }

}

</script>
方法二:按需引入
vue中添加echarts的更多相关文章
- vue中添加Echarts图表的使用,Echarts的学习笔记
项目中需要使用一些折线图.柱状图.饼状图等等,之前使用过heightCharts(关于heightCharts请看我的另一篇 http://www.cnblogs.com/jasonwang2y60/ ...
- 在vue中使用echarts图表
在vue中使用echarts图表 转载请注明出处:https://www.cnblogs.com/wenjunwei/p/9815290.html 安装vue依赖 使用npm npm instal ...
- vue中使用echarts的两种方法
在vue中使用echarts有两种方法一.第一种方法1.通过npm获取echarts npm install echarts --save 2.在vue项目中引入echarts 在 main.js 中 ...
- 在vue中调用echarts中的地图散点图~
首先!当然是在vue中引入echarts! 命令行 npm install echarts --save 在main.js文件中里引入 import echarts from 'ech ...
- Vue中使用ECharts画散点图加均值线与阴影区域
[本文出自天外归云的博客园] 需求 1. Vue中使用ECharts画散点图 2. 在图中加入加均值线 3. 在图中标注出阴影区域 实现 实现这个需求,要明确两点: 1. 知道如何在vue中使用ech ...
- vue中添加util公共方法&&ES6之import、export
vue中添加util公共方法&&ES6之import.export https://developer.mozilla.org/zh-CN/docs/Web/JavaScript/Re ...
- 记录下vue 中引用echarts 出现 "TypeError: Cannot read property 'getAttribute' of undefined"问题
今天做项目,用echarts展示数据 ,自己测试 先测试 了下.写的代码html: <div ref="myChart" style="height:300px;w ...
- vue中使用echarts(vue+vue-cli+axios+jsonp+echarts)
一.安装echarts: cnpm i echarts -D 二.在vue-cli的main.js文件中引用echarts: import charts from 'echarts' Vue.prot ...
- VUE中集成echarts时 getAttribute of null错误
错误 错误场景一: 错误提示: 在运行Vue项目时出现了上述错误,出现该错误的原因是Echarts的图形容器还未生成就对其进行了初始化所造成的,代码如下: // 基于准备好的dom,初始化echart ...
随机推荐
- ueditor UEditor的setContent的时候报错
今天在使用UEditor的setContent的时候报错,报错代码如下 TypeError: me.body is undefined 或 Uncaught TypeError: Cannot set ...
- 通过pip3安装virtualenvwrapper
pip3 install virtualenvwrapper 配置virtualenvwrapper创建虚拟环境的目录和指定python3版本 环境编辑当前用户配置变量 mkdir ~/.virtua ...
- Vue2.0学习--Vue数据通信详解
一.前言 组件是 vue.js最强大的功能之一,而组件实例的作用域是相互独立的,这就意味着不同组件之间的数据无法相互引用.组件间如何传递数据就显得至关重要.本文尽可能罗列出一些常见的数据传递方式,如p ...
- [SinGuLaRiTy] KM算法
[SinGuLaRiTy-1018] Copyright (c) SinGuLaRiTy 2017. All Rights Reserved. Some Method Are Reproduced F ...
- [TJOI2015]线性代数(网络流)
[TJOI2015]线性代数(最大权闭合子图,网络流) 为了提高智商,ZJY开始学习线性代数.她的小伙伴菠萝给她出了这样一个问题:给定一个n*n的矩阵B和一个1×n的矩阵C.求出一个1×n的01矩阵A ...
- python web开发之flask框架学习(2) 加载模版
上次学习了flask的helloword项目的创建,这次来学习flask项目的模版加载: 第一步:创建一个flask项目 第二步:在项目目录的templates文件夹下创建一个html文件 第三步: ...
- nagios安装使用指南
话不多说,下面开始,nagios具体的介绍,可以搜一下,这篇文章为作者在实际操作中整理出来,写出来的都是负责人的内容~ 环境准备 此文档共用2台服务器的配置,操作系统均为centOS6.7,安装用户都 ...
- SP263 PERIOD - Period KMP技巧
\(\color{#0066ff}{题目描述}\) 如果一个字符串S是由一个字符串T重复K次形成的,则称T是S的循环元.使K最大的字符串T称为S的最小循环元,此时的K称为最大循环次数. 现给一个给定长 ...
- P1969 积木大赛
题意:给你一段序列,一次操作:[l,r]内所有数+1 初始序列全为0 现在给你最后序列,问最少操作几次能达到这样的序列 蒟蒻表示秒想到------差分啊 每次差分必有一个+1,一个-1 把差分数组求出 ...
- Runtime常用的几个应用场景
Runtime常见的几个应用场景. Runtime常见应用场景 具体应用拦截系统自带的方法调用(Method Swizzling黑魔法) 实现给分类增加属性 实现字典的模型和自动转换 JSPatch替 ...