《DSP using MATLAB》示例Example 9.9
代码:
%% ------------------------------------------------------------------------

%%            Output Info about this m-file

fprintf('\n***********************************************************\n');

fprintf('        <DSP using MATLAB> Exameple 9.9 \n\n');

time_stamp = datestr(now, 31);

[wkd1, wkd2] = weekday(today, 'long');

fprintf('      Now is %20s, and it is %7s  \n\n', time_stamp, wkd2);

%% ------------------------------------------------------------------------

% Given parameters:

I = 5; Rp = 0.1; As = 30; wp = pi/I; ws = pi*0.32;

[delta1, delta2] = db2delta(Rp, As); weights = [delta2/delta1, 1];

n = [0:50]; x = cos(0.5*pi*n);

n1 = n(1:17); x1 = x(17:33);     % for plotting purposes

%% -----------------------------------------------------------------

%%                             Plot

%% -----------------------------------------------------------------

% Input signal

Hf1 = figure('units', 'inches', 'position', [1, 1, 8, 6], ...

	'paperunits', 'inches', 'paperposition', [0, 0, 6, 4], ...

	'NumberTitle', 'off', 'Name', 'Exameple 9.9');

set(gcf,'Color','white');

TF = 10;

subplot(2, 2, 1);

Hs1 = stem(n1, x1, 'filled'); set(Hs1, 'markersize', 2, 'color', 'g');

axis([-1, 17, -1.2, 1.2]); grid on;

xlabel('n', 'vertical', 'middle'); ylabel('Amplitude');

title('Input Signal x(n)', 'fontsize', TF);

set(gca, 'xtick', [0:4:16]);

set(gca, 'ytick', [-1, 0, 1]);

% Interpolation with Filter Design: Length M=31

M = 31; F = [0, wp, ws, pi]/pi; A = [I, I, 0, 0];

h = firpm(M-1, F, A, weights); y = upfirdn(x, h, I);

delay = (M-1)/2;           % Delay imparted by the filter

m = delay+1:1:50*I+delay+1; y = y(m); m = 1:81; y = y(81:161);   % for plotting

subplot(2, 2, 2);

Hs2 = stem(m, y, 'filled'); axis([-5, 85, -1.2, 1.2]); grid on;

xlabel('n', 'vertical', 'middle'); ylabel('Amplitude');

title(' Output y(n): I = 5, Filter length=31', 'fontsize', TF);

set(gca, 'xtick', [0:4:16]*I);

set(gca, 'ytick', [-1, 0, 1]);

% Interpolation with Filter Design: Length M = 51

M = 51; F = [0, wp, ws, pi]/pi; A = [I, I, 0, 0];

h = firpm(M-1, F, A, weights); y = upfirdn(x, h, I);

delay = (M-1)/2;           % Delay imparted by the filter

m = delay+1:1:50*I+delay+1; y = y(m); m = 1:81; y = y(81:161);   % for plotting

subplot(2, 2, 3);

Hs3 = stem(m, y, 'filled'); axis([-5, 85, -1.2, 1.2]); grid on;

set(Hs3, 'markersize', 2, 'color', 'm');

xlabel('n', 'vertical', 'middle'); ylabel('Amplitude');

title('Output y(n): I = 5, Filter length=51 ', 'fontsize', TF);

set(gca, 'xtick', [0:4:16]*I);

set(gca, 'ytick', [-1, 0, 1]);

% Interpolation with Filter Design : Length M = 81

M = 81; F = [0, wp, ws, pi]/pi; A = [I, I, 0, 0];

h = firpm(M-1, F, A, weights); y = upfirdn(x, h, I);

delay = (M-1)/2;           % Delay imparted by the filter

m = delay+1:1:50*I+delay+1; y = y(m); m = 1:81; y = y(81:161);   % for plotting

subplot(2, 2, 4);

Hs4 = stem(m, y, 'filled'); axis([-5, 85, -1.2, 1.2]); grid on;

set(Hs4, 'markersize', 2, 'color', 'm');

xlabel('n', 'vertical', 'middle'); ylabel('Amplitude');

title('Output y(n): I = 5, Filter length=81 ', 'fontsize', TF);

set(gca, 'xtick', [0:4:16]*I);

set(gca, 'ytick', [-1, 0, 1]);
运行结果:
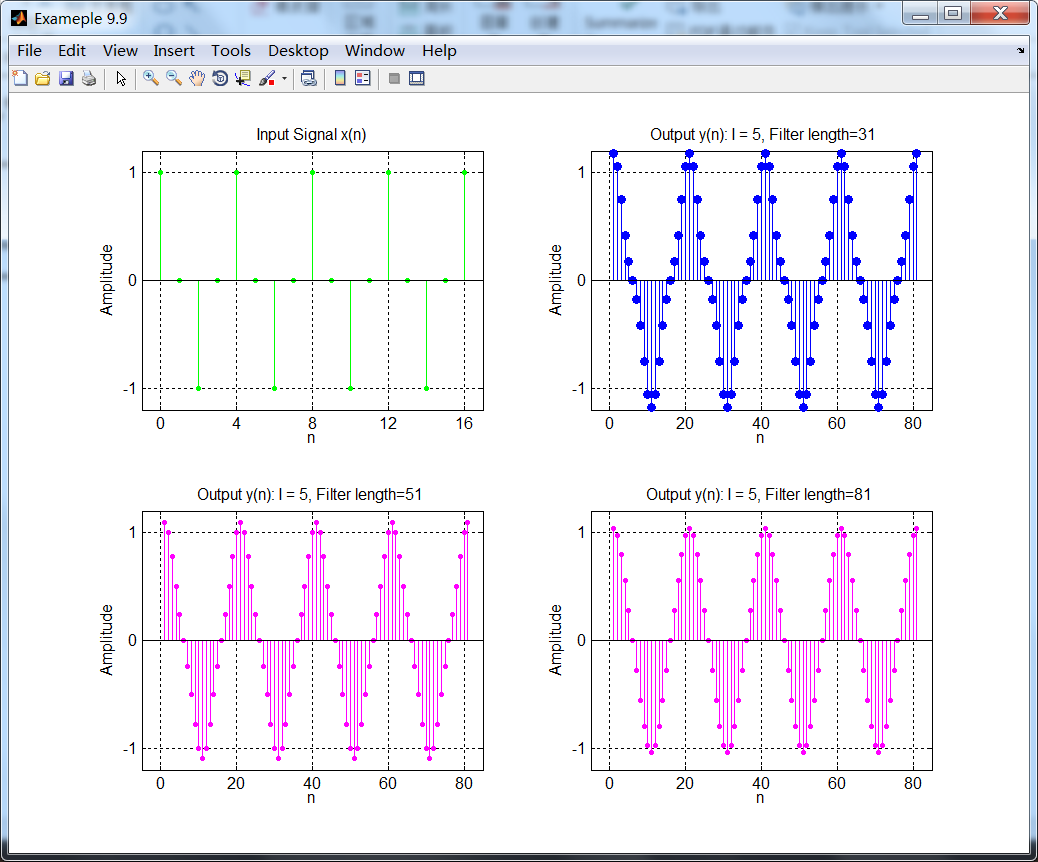
左上图是输入信号x(n)的一部分,右上图是使用长度为31的滤波器后得到的输出y(n)。对于滤波器延迟和过渡带响应来说,该图是正确的。令人惊讶的是插值后的信号不是其应该的模样。
峰值超过了1,形状有些变形。仔细看图9.20中的滤波器响应表现为宽的过渡带和小的衰减,必然会导致一些谱能量的泄漏,产生变形。
对于较大的阶数来说,滤波器低通特征较好。信号峰值接近1,并且其形状接近余弦波形。因此,一个好的滤波器设计甚至对一个简单的信号都是严格适用的。
《DSP using MATLAB》示例Example 9.9的更多相关文章
- DSP using MATLAB 示例Example3.21
代码: % Discrete-time Signal x1(n) % Ts = 0.0002; n = -25:1:25; nTs = n*Ts; Fs = 1/Ts; x = exp(-1000*a ...
- DSP using MATLAB 示例 Example3.19
代码: % Analog Signal Dt = 0.00005; t = -0.005:Dt:0.005; xa = exp(-1000*abs(t)); % Discrete-time Signa ...
- DSP using MATLAB示例Example3.18
代码: % Analog Signal Dt = 0.00005; t = -0.005:Dt:0.005; xa = exp(-1000*abs(t)); % Continuous-time Fou ...
- DSP using MATLAB 示例Example3.23
代码: % Discrete-time Signal x1(n) : Ts = 0.0002 Ts = 0.0002; n = -25:1:25; nTs = n*Ts; x1 = exp(-1000 ...
- DSP using MATLAB 示例Example3.22
代码: % Discrete-time Signal x2(n) Ts = 0.001; n = -5:1:5; nTs = n*Ts; Fs = 1/Ts; x = exp(-1000*abs(nT ...
- DSP using MATLAB 示例Example3.17
- DSP using MATLAB示例Example3.16
代码: b = [0.0181, 0.0543, 0.0543, 0.0181]; % filter coefficient array b a = [1.0000, -1.7600, 1.1829, ...
- DSP using MATLAB 示例 Example3.15
上代码: subplot(1,1,1); b = 1; a = [1, -0.8]; n = [0:100]; x = cos(0.05*pi*n); y = filter(b,a,x); figur ...
- DSP using MATLAB 示例 Example3.13
上代码: w = [0:1:500]*pi/500; % freqency between 0 and +pi, [0,pi] axis divided into 501 points. H = ex ...
- DSP using MATLAB 示例 Example3.12
用到的性质 代码: n = -5:10; x = sin(pi*n/2); k = -100:100; w = (pi/100)*k; % freqency between -pi and +pi , ...
随机推荐
- WordPress配置
1.准备工作: 下载comsenzexp.exe 下载wordpress.zip 2.安装comsenzexp.exe,安装有个wwwroot目录: 3.解压wordpress.zip,然后ctrl+ ...
- Smarty模板变量调节器
Smarty模板变量调节器用法 在smarty里面,怎么修饰文本和变量呢?当然,你可以通过php函数处理文本,然后再通过assign()方法分配到模板,其实smarty提供了变量调节器能够很容易的处理 ...
- shoes的安装前后(一)
最近看到一个模型用到了shoes,准备自己试一试.搞了半天,也安装不成功.直接安装包,gem install shoes,失败, 从rubygems上下载最新版本的shoes 然后安装,成功了.随便写 ...
- 解决 failed to push some refs to 'git@github.com:zle1992/head-first-java' hint: Updates were rejected because the tip of your curr
问题描述: 寒假之前用实验室电脑push到github 上head first java 的程序,寒假回家后,想用自己的笔记本继续编,继续push . 我先从github下载zip到本地,然后 解压后 ...
- hdu5009
这题说的是给了一个 长度为n(n<=50000)的数列,数列表示的是给每个珍珠涂的颜色,任务是将一窜长度为n的珍珠涂成他所要的颜色.然后你可以操至多n次, 每次画只能画连续的区间,每次操作是的 ...
- 20145309 李昊 《网络攻防》 Exp2 后门原理与实践
实践内容: (1)理解免杀技术原理(1分) (2)正确使用msf编码器,veil-evasion,自己利用shellcode编程等免杀工具或技巧:(2分) (3)通过组合应用各种技术实现恶意代码免杀( ...
- 20155201 2016-2017-2 《Java程序设计》第十周学习总结
20155201 2016-2017-2 <Java程序设计>第十周学习总结 教材学习内容总结 Java密码技术 安全的三个属性 机密性 完整性 可用性 密码学: 主要是研究保密通信和信息 ...
- Tomcat启动报StackOverflowError
近期工程部署到Tomcat时,出现以下异常: 16-May-2018 09:35:25.590 严重 [localhost-startStop-1] org.apache.catalina.core. ...
- 欧几里德和扩展欧几里德详解 以及例题CodeForces 7C
欧几里德定理: 对于整数a,b来说,gcd(a, b)==gcd(b, a%b)==d(a与b的最大公约数),又称为辗转相除法 证明: 因为a是d的倍数,b是d的倍数:所以a%d==0:b%d==0: ...
- sqlyog注册码
姓 名(Name):ttrar 序 列 号(Code):8d8120df-a5c3-4989-8f47-5afc79c56e7c或者(OR)姓 名(Name):ttrar序 列 号(C ...