prometheus学习系列十一: Prometheus pushgateway的使用
由于网络问题或者安全问题,可能我们的数据无法直接暴露出一个entrypoint 给prometheus采集。 这个时候可能就需要一个pushgateway来作为中间者完成中转工作。 prometheus还是采用pull方式来采集pushgateway的数据,我们的采集端通过push方式把数据push给pushgateway,来完成数据的上报。
pushgateway的安装
[root@node01 src]# wget https://github.com/prometheus/pushgateway/releases/download/v0.10.0/pushgateway-0.10.0.linux-amd64.tar.gz

[root@node01 src]# tar xf pushgateway-0.10.0.linux-amd64.tar.gz

[root@node01 src]# ll

total 8732

drwxr-xr-x. 2 root root       6 Nov  5  2016 debug

drwxr-xr-x. 2 root root       6 Nov  5  2016 kernels

drwxr-xr-x  2 3434 3434      54 Oct 10 19:29 pushgateway-0.10.0.linux-amd64

-rw-r--r--  1 root root 8940709 Oct 10 19:30 pushgateway-0.10.0.linux-amd64.tar.gz

[root@node01 src]# mv pushgateway-0.10.0.linux-amd64 /usr/local/^C

[root@node01 src]# mkdir /usr/local/prometheus

[root@node01 src]# mv pushgateway-0.10.0.linux-amd64 /usr/local/prometheus/

[root@node01 src]# cd  /usr/local/prometheus/

[root@node01 prometheus]# ls

pushgateway-0.10.0.linux-amd64

[root@node01 prometheus]# ln -s pushgateway-0.10.0.linux-amd64/ pushgateway

[root@node01 prometheus]# ll

total 0

lrwxrwxrwx 1 root root 31 Oct 11 04:00 pushgateway -> pushgateway-0.10.0.linux-amd64/

drwxr-xr-x 2 3434 3434 54 Oct 10 19:29 pushgateway-0.10.0.linux-amd64
pushgateway的配置
[root@node01 system]#  cd /usr/lib/systemd/system

[root@node01 system]#  vim pushgateway.service

[root@node01 system]# cat pushgateway.service

[Unit]

Description=prometheus

After=network.target

[Service]

User=prometheus

Group=prometheus

WorkingDirectory=/usr/local/prometheus/pushgateway

ExecStart=/usr/local/prometheus/pushgateway/pushgateway \

                --web.enable-admin-api  \

                --persistence.file="pushfile.txt" \

                --persistence.interval=10m

[Install]

WantedBy=multi-user.target

[root@node01 system]# systemctl enable pushgateway

Created symlink from /etc/systemd/system/multi-user.target.wants/pushgateway.service to /usr/lib/systemd/system/pushgateway.service.

[root@node01 system]# systemctl start pushgateway

[root@node01 system]# systemctl status pushgateway
注意: 上面的持久文件如果存储量大,需要考虑配置单独的磁盘来存储。
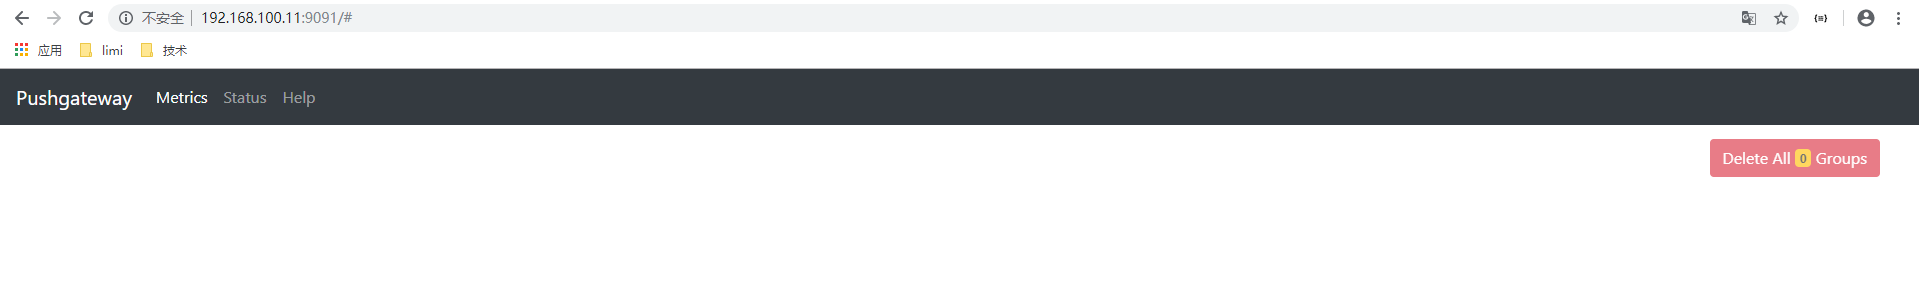
测试web页面
配置采集push端
添加一个数据,查看结果
[root@node02 ~]# !vim

vim push_memory.sh
#!/bin/bash
# desc push memory info

total_memory=$(free  |awk '/Mem/{print $2}')
used_memory=$(free  |awk '/Mem/{print $3}')

job_name="custom_memory"
instance_name="192.168.100.12"

cat <<EOF | curl --data-binary @- http://192.168.100.11:9091/metrics/job/$job_name/instance/$instance_name
#TYPE custom_memory_total  gauge
custom_memory_total $total_memory
#TYPE custom_memory_used  gauge
custom_memory_used $used_memory
EOF

# 执行导入
bash push_memory.sh
插入数据后效果图

集成prometheus
添加pushgateway的采集
# 修改prometheus.yml 加入如下片段

 - job_name: "custom-memory-pushgateway"

    #honor_labels: true

    static_configs:

    - targets: ["192.168.100.11:9091"]
持续生成数据
上面执行的 push_memory.sh脚本也就是只是插入一次数据, 我们这里使用计划任务来周期push数据到pushgateway中。
[root@node02 ~]# crontab  -e

no crontab for root - using an empty one

 * * * * /root/push_memory.sh

[root@node02 ~]# chmod a+x push_memory.sh
效果图
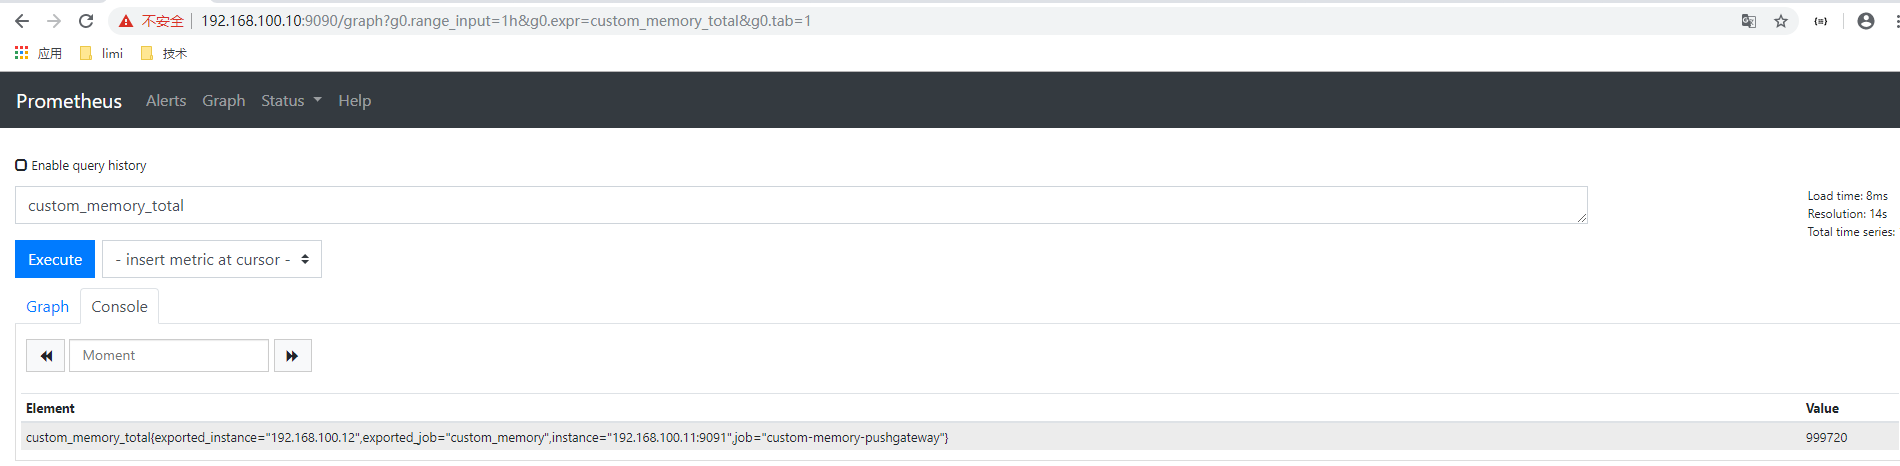
可以发现instance和job标签有点问题, 这是pushgateway填充的, 我们可以加入honor配置使用我们自定义的。
修改配置如下
  - job_name: "custom-memory-pushgateway"

    honor_labels: true

    static_configs:

    - targets: ["192.168.100.11:9091"]
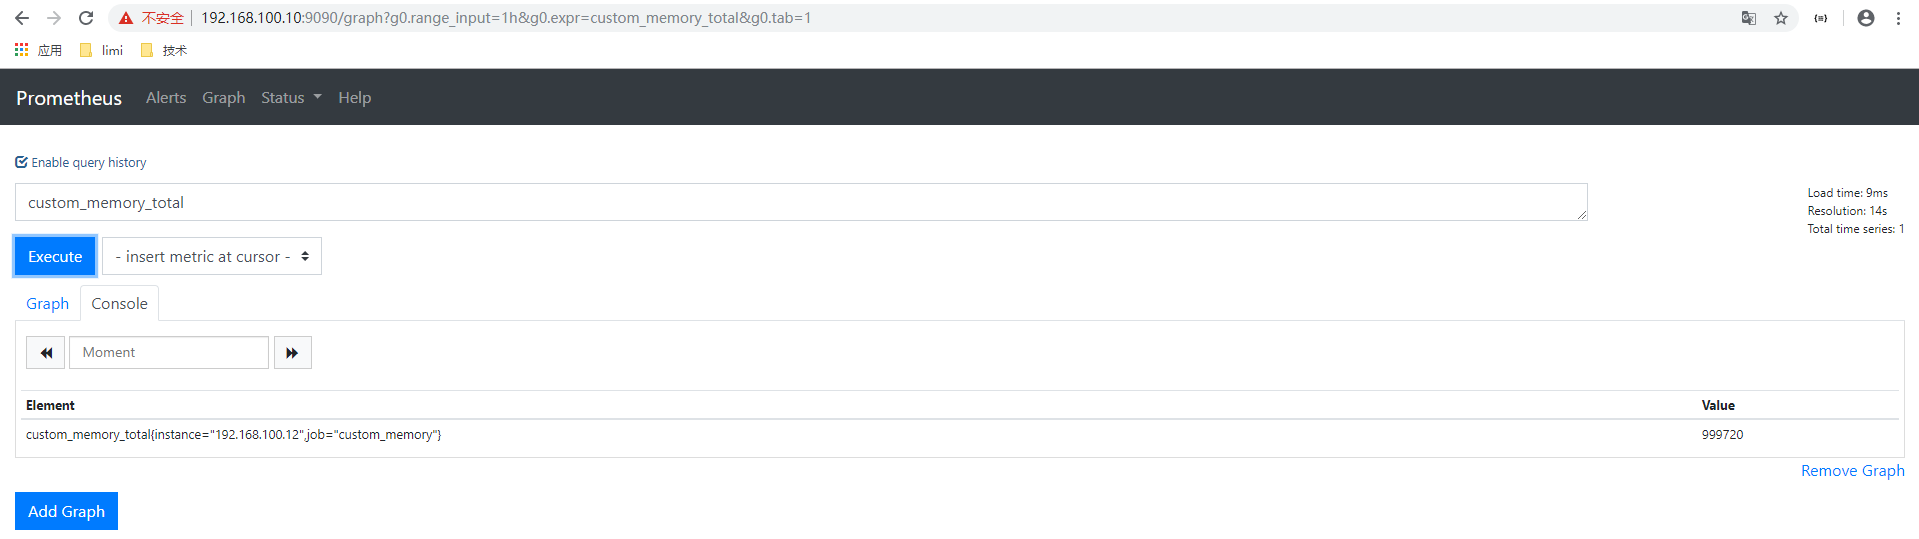
效果图
总结
我们可以通过pushgateway来辅助采集。 此场景中,我们假定的192.168.100.10这个prometheus server服务器是到192.168.100.12网络是不通的, 但是192.168.100.11 这个ip地址是可以和2个ip是通的, 这里就可以在192.168.100.11 这个服务器上面部署pushgateway来作为桥梁, 采集到192.168.100.12的监控数据。
prometheus学习系列十一: Prometheus pushgateway的使用的更多相关文章
- prometheus学习系列十一: Prometheus 安全
prometheus安全 我们这里说的安全主要是基本认证和https2种, 目前这2种安全在prometheus中都没有的, 需要借助第三方软件实现, 这里以nginx为例. 基本认证 配置基本认证 ...
- prometheus学习系列十一: Prometheus和AlertManager的高可用
前面的系列中, prometheus和alertmanager都是单机部署的,会有单机宕机导致系统不可用情况发生.本文主要介绍下prometheus和alertmanager的高可用方案. 服务的高可 ...
- prometheus学习系列十一: Prometheus exporter详解
exporter详解 前面的系列中,我们在主机上面安装了node_exporter程序,该程序对外暴露一个用于获取当前监控样本数据的http的访问地址, 这个的一个程序成为exporter,Expor ...
- prometheus学习系列十一: Prometheus 采集器的编写
在前面的文章已经写了官方的几个exporter的使用了. 在实际使用环境中,我们可能需要收集一些自定义的数据, 这个时候我们一般是需要自己编写采集器的. 快速入门编写一个入门的demo 编写代码 fr ...
- prometheus学习系列十一: Prometheus 报警规则配置
prometheus监控系统的的报警规则是在prometheus这个组件完成配置的. prometheus支持2种类型的规则,记录规则和报警规则, 记录规则主要是为了简写报警规则和提高规则复用的, 报 ...
- Prometheus学习系列(六)之Prometheus 查询说明
前言 本文来自Prometheus官网手册和 Prometheus简介 Prothetheus查询 Prometheus提供一个函数式的表达式语言PromQL (Prometheus Query La ...
- Prometheus学习系列(九)之Prometheus 联盟、迁移
前言 本文来自Prometheus官网手册 和 Prometheus简介 FEDERATION 允许Prometheus服务器从另一台Prometheus服务器抓取选定的时间序列. 一,用例 联盟有不 ...
- Prometheus学习系列(五)之Prometheus 规则(rule)、模板配置说明
前言 本文来自Prometheus官网手册1.2.3.4和 Prometheus简介1.2.3.4 记录规则 一.配置规则 Prometheus支持两种类型的规则,这些规则可以定期配置,然后定期评估: ...
- Prometheus学习系列(二)之Prometheus FIRST STEPS
前言 本文来自Prometheus官网手册 和 Prometheus简介 说明 Prometheus是一个监控平台,通过在监控目标上的HTTP端点来收集受监控目标的指标.本指南将向您展示如何使用Pro ...
随机推荐
- [RN] React Native 自定义 底部 弹出 选择框 实现
React Native 自定义 底部选择框 实现 效果如图所示: 实现方法: 一.组件封装 CustomAlertDialog.js import React, {Component} from ' ...
- 网络协议 7 - UDP 协议
网络协议五步登天路,我们一路迈过了物理层.链路层,今天终于到了传输层.从这一层开始,很多知识应该都是服务端开发必备的知识了,今天我们就一起来梳理下. 其实,讲到 UDP,就少不了 TCP.这俩 ...
- rpm安装和卸载
以jdk的卸载和安装为例. 1. 查找已安装的包名 $ rpm -q jdk jdk-1.7.0_79-fcs.x86_64 如果系统中有已经安装的jdk包,则会输出包名. 2. 卸载已安装的包 $ ...
- 超强在线考试系统源码(私有部署&二次开发)
随着信息化技术的发展,考试系统也在进行着深入的变革.从传统的纸质考试人工评分到现在的在线考试自动评分. 在线考试系统的应用场景也在逐渐扩宽,例如:学校的学生考试.员工培训考试.招聘考试.职称考试等等. ...
- Spring Boot进阶系列二
上一篇文章,主要分析了怎么建立一个Restful web service,系列二主要创建一个H5静态页面使用ajax请求数据,功能主要有添加一本书,请求所有书并且按照Id降序排列,以及查看,删除一本书 ...
- DI 依赖注入之unity的MVC版本使用Microsoft.Practices.Unity1.2与2.0版本对比
DI 依赖注入之unity的MVC版本使用Microsoft.Practices.Unity1.2与2.0版本对比 参考:https://www.cnblogs.com/xishuai/p/36702 ...
- 爬取'Content-Type': 'text/plain;charset=UTF-8' ,发送请求数据方式
解决方式 直接以字符串的方式发送data就可以得到响应数据 import requests data = 'k1:v1,k2:v2' requests.post(url, data=data)
- sde.layers表的eflags字段解析
ArcSDE地理数据库,虽然经常在用,但仅限于了解功能层面的东西,其内部实现机制对我来说是个黑盒子.因为想了解register with geodatabase操作在数据库层面到底发生了什么,我分析了 ...
- [记录]安装.Net Framework 4.6.2时出现“无法建立到信任根颁发机构的证书链”解决方法
在安装Microsoft .NET Framework 4.6.2脱机包时提示 无法建立到信任根颁发机构的证书链 实际上是要安装一个根证书.解决方案如下(因无法贴链接,可百度搜索“mamicode.c ...
- 使用Prometheus监控snmp
获取snmp信息 首先获取需要监控的snmp的基本信息,假设基本信息如下: snmp服务IP: 1.1.1.1 snmp community: public snmp exportor部署地址: 2. ...