prometheus学习系列十一: Prometheus 采集器的编写
在前面的文章已经写了官方的几个exporter的使用了。 在实际使用环境中,我们可能需要收集一些自定义的数据, 这个时候我们一般是需要自己编写采集器的。
快速入门编写一个入门的demo
编写代码
from prometheus_client import Counter, Gauge, Summary, Histogram, start_http_server

# need install prometheus_client

if __name__ == '__main__':

    c = Counter('cc', 'A counter')

    c.inc()

    g = Gauge('gg', 'A gauge')

    g.set(17)

    s = Summary('ss', 'A summary', ['a', 'b'])

    s.labels('c', 'd').observe(17)

    h = Histogram('hh', 'A histogram')

    h.observe(.6)

    start_http_server(8000)

    import time

    while True:

        time.sleep(1)
只需要一个py文件, 运行起来, 会监听在8000端口,访问127.0.0.1:8000端口。
效果图
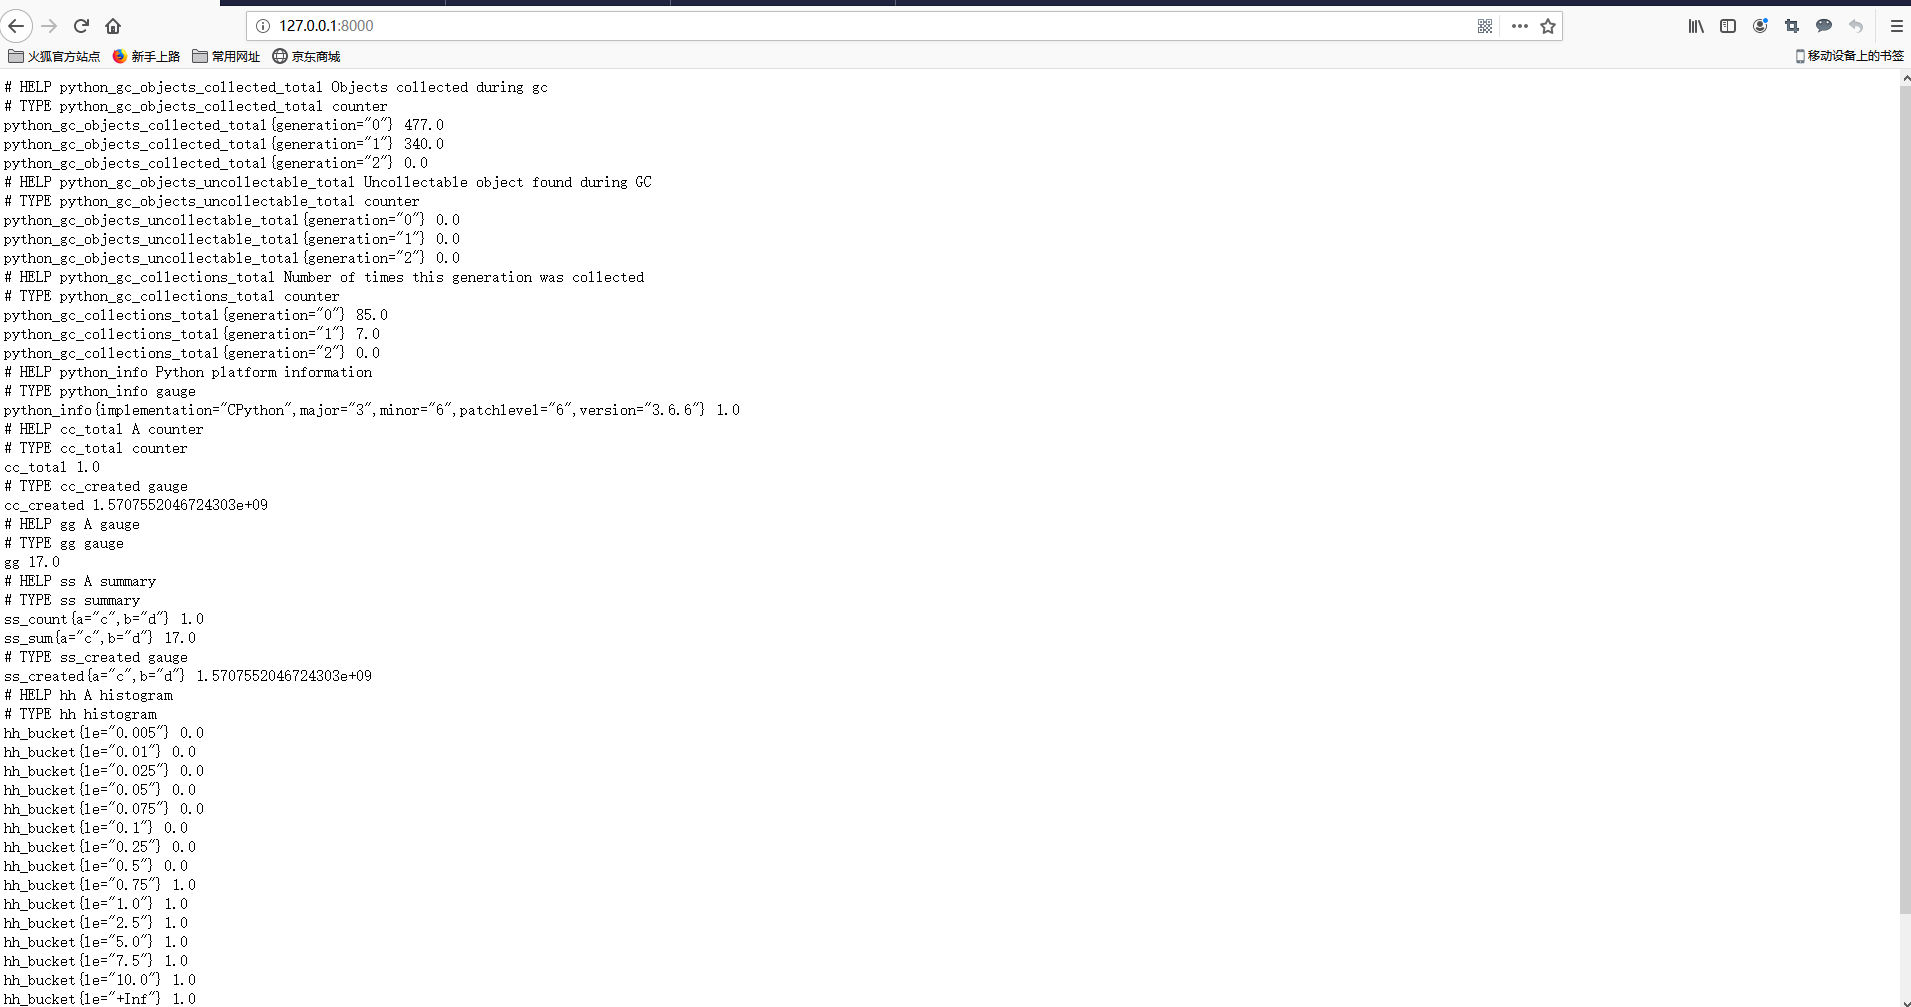
其实一个导出器就已经写好了, 就是这么简单的,我们只需要在prometheus配置来采集对应的导出器就可以了。 不过我们的导出的数据都是没有实际意义了。
数据类型介绍
Counter 累加类型, 只能上升,比如记录http请求的总数或者网络的收发包累计值。
Gauge: 仪表盘类型, 适合有上升有下降的, 一般网络流量,磁盘读写这些,会有波动和变化的采用这个数据类型。
Summary: 基于采样的,在服务端完成统计。我们在统计平均值的时候,可能以为某个值异常导致计算平均值不能准确反映实际值, 就需要特定的点位置。
Histogram: 基于采样的,在客户端完成统计。我们在统计平均值的时候,可能以为某个值异常导致计算平均值不能准确反映实际值, 就需要特定的点位置。
采集内存使用数据
编写采集类代码
from prometheus_client.core import GaugeMetricFamily, REGISTRY

from prometheus_client import start_http_server

import psutil

class CustomMemoryUsaggeCollector():

    def format_metric_name(self):

        return 'custom_memory_'

    def collect(self):

        vm = psutil.virtual_memory()

        #sub_metric_list = ["free", "available", "buffers", "cached", "used", "total"]

        sub_metric_list = ["free", "available", "used", "total"]

        for sub_metric in sub_metric_list:

            gauge = GaugeMetricFamily(self.format_metric_name() + sub_metric, '')

            gauge.add_metric(labels=[], value=getattr(vm, sub_metric))

            yield gauge

if __name__ == "__main__":

    collector = CustomMemoryUsaggeCollector()

    REGISTRY.register(collector)

    start_http_server(8001)

    import time

    while True:

        time.sleep(1)
暴露数据情况

部署代码和集成prometheus
# 准备python3 环境 参考: https://virtualenvwrapper.readthedocs.io/en/latest/

yum install python36 -y

 pip3 install virtualenvwrapper

vim /usr/local/bin/virtualenvwrapper.sh

# 文件最前面添加如下行

# Locate the global Python where virtualenvwrapper is installed.

VIRTUALENVWRAPPER_PYTHON="/usr/bin/python3"

# 文件生效

source /usr/local/bin/virtualenvwrapper.sh

# 配置workon

[root@node01 ~]# echo "export WORKON_HOME=~/Envs" >>~/.bashrc

[root@node01 ~]# mkvirtualenv  custom_memory_exporter

(custom_memory_exporter) [root@node01 ~]# pip install prometheus_client psutil

yum install python36-devel

(custom_memory_exporter) [root@node01 ~]# chmod a+x custom_memory_exporter.py

(custom_memory_exporter) [root@node01 ~]# ./custom_memory_exporter.py

# 测试是否有结果数据

[root@node00 ~]# curl http://192.168.100.11:8001/

prometheus.yml 加入如下片段
  - job_name: "custom-memory-exporter"
    static_configs:
    - targets: ["192.168.100.11:8001"]

[root@node00 prometheus]# systemctl restart prometheus
[root@node00 prometheus]# systemctl status prometheu
查询效果图

prometheus学习系列十一: Prometheus 采集器的编写的更多相关文章
- prometheus学习系列十一: Prometheus pushgateway的使用
由于网络问题或者安全问题,可能我们的数据无法直接暴露出一个entrypoint 给prometheus采集. 这个时候可能就需要一个pushgateway来作为中间者完成中转工作. promethe ...
- prometheus学习系列十一: Prometheus 安全
prometheus安全 我们这里说的安全主要是基本认证和https2种, 目前这2种安全在prometheus中都没有的, 需要借助第三方软件实现, 这里以nginx为例. 基本认证 配置基本认证 ...
- prometheus学习系列十一: Prometheus exporter详解
exporter详解 前面的系列中,我们在主机上面安装了node_exporter程序,该程序对外暴露一个用于获取当前监控样本数据的http的访问地址, 这个的一个程序成为exporter,Expor ...
- prometheus学习系列十一: Prometheus和AlertManager的高可用
前面的系列中, prometheus和alertmanager都是单机部署的,会有单机宕机导致系统不可用情况发生.本文主要介绍下prometheus和alertmanager的高可用方案. 服务的高可 ...
- prometheus学习系列十一: Prometheus 报警规则配置
prometheus监控系统的的报警规则是在prometheus这个组件完成配置的. prometheus支持2种类型的规则,记录规则和报警规则, 记录规则主要是为了简写报警规则和提高规则复用的, 报 ...
- Prometheus学习系列(九)之Prometheus 联盟、迁移
前言 本文来自Prometheus官网手册 和 Prometheus简介 FEDERATION 允许Prometheus服务器从另一台Prometheus服务器抓取选定的时间序列. 一,用例 联盟有不 ...
- Prometheus学习系列(六)之Prometheus 查询说明
前言 本文来自Prometheus官网手册和 Prometheus简介 Prothetheus查询 Prometheus提供一个函数式的表达式语言PromQL (Prometheus Query La ...
- Prometheus学习系列(五)之Prometheus 规则(rule)、模板配置说明
前言 本文来自Prometheus官网手册1.2.3.4和 Prometheus简介1.2.3.4 记录规则 一.配置规则 Prometheus支持两种类型的规则,这些规则可以定期配置,然后定期评估: ...
- Prometheus学习系列(二)之Prometheus FIRST STEPS
前言 本文来自Prometheus官网手册 和 Prometheus简介 说明 Prometheus是一个监控平台,通过在监控目标上的HTTP端点来收集受监控目标的指标.本指南将向您展示如何使用Pro ...
随机推荐
- 【border相关】【P3426】 [POI2005]SZA-Template
[border相关][P3426] [POI2005]SZA-Template Description 给定一个字符串 \(S\),要求一个最短的字符串 \(T\),使得 \(S\) 可以由 \(T\ ...
- 【BZOJ3569】DZY Loves Chinese II
[BZOJ3569]DZY Loves Chinese II 题面 bzoj 题目大意: 给你一张\(N(1\leq N\leq 10^5)\)个点\(M(1\leq M\leq 5\times 10 ...
- 趣谈Linux操作系统学习笔记:第二十七讲
一.文件系统的功能规划 1.引子 咱们花了这么长的时间,规划了会议室管理系统,这样多个项目执行的时候,隔离性可以得到保证. 但是,会议室里面被回收,会议室里面的资料就丢失了.有一些资料我们希望项目结束 ...
- Spring注解和标签的比较说明
待完善.... xml标签 注解 说明 xml的Spring约束头 @Configuration xml约束头表明这是用于spring的的配置文件 @Configuration注解表情这是用于Spri ...
- java web开发入门汇总
servlet 用java语言开发动态资源网站的技术,在doGet方法中拼接显示html,在doPost方法中提交数据.类似于.net的ashx技术. servlet生成的class文件存放在tomc ...
- Linux搭建Nexus3.X构建maven私服
备注:linux版本: ubuntu 同时已经部署好JDK8环境 一.linux安装nexus 1.创建文件夹并进入该目录 cd /usr/local && mkdir nexus & ...
- mysql 基本操作 一
1.mysql 管理语句 1)展示数据库列表 mysql> show databases; +--------------------+ | Database | +-------------- ...
- Java爬虫利器HTML解析工具-Jsoup
Jsoup简介 Java爬虫解析HTML文档的工具有:htmlparser, Jsoup.本文将会详细介绍Jsoup的使用方法,10分钟搞定Java爬虫HTML解析. Jsoup可以直接解析某个URL ...
- 032 搭建搜索微服务01----向ElasticSearch中导入数据--通过Feign实现微服务之间的相互调用
1.创建搜索服务 创建module: Pom文件: <?xml version="1.0" encoding="UTF-8"?> <proje ...
- Scrum story
鸡和猪的故事故事: 一天,一只鸡散步时遇见了猪. 鸡对猪说:“嗨,我们合伙开个餐厅吧.” 猪说:“好啊,那准备取什么店名呢?” 鸡说:“要不,就叫火腿和鸡蛋吧.” 猪直接拒绝了:“那可不行.我要割肉, ...