
[系统集成] 部署 mesos-exporter 和 prometheus 监控 mesos task
前几天我在mesos平台上基于 cadvisor部署了 influxdb 和 grafana,用于监控 mesos 以及 docker app 运行信息,发现这套监控系统不太适合 mesos + docker 的架构,原因是:
1)mesos task id 和 docker container name 不一致
cadvisor 的设计基于 docker host,没有考虑到mesos 数据中心;
cadvisor 用 docker name(docker ps能看到)来标记抓取的数据,而 mesos 用 task id(在mesos ui 或者metrics里能看到) 来标记正在运行的任务。mesos task 的类型可以是 docker 容器,也可以是非容器。mesos task id 与docker container name 的命名也是完全不一样的。
上述问题导致 cadvisor 抓取到数据后,用户难以识别属于哪个 mesos task
2)cadvisor 和 grafana 不支持报警
经过查询资料,发现 mesos-exporter + prometheus + alert-manager 是个很好的组合,可以解决上述问题:
mesos-exporter 是 mesosphere 开发的工具,用于导出 mesos 集群包括 task 的监控数据并传递给prometheus;prometheus是个集 db、graph、statistic 于一体的监控工具;alert-manager 是 prometheus 的报警工具
搭建方法:
1. build mesos-exporter
git clone https://github.com/mesosphere/mesos_exporter.git

cd mesos_exporter

docker build -f Dockerfile -t mesosphere/mesos-exporter .
2. docker pull prometheus, alert-manager
3. 部署 mesos-exporter, alert-manager, prometheus
mesos-exporter:
{

  "id": "mesos-exporter-slave",

  "instances": 6,

  "cpus": 0.2,

  "mem": 128,

  "args": [

      "-slave=http://127.0.0.1:5051",

      "-timeout=5s"

  ],

  "constraints": [

      ["hostname","UNIQUE"],

      ["hostname", "LIKE", "slave[1-6]"]

  ],

  "container": {

    "type": "DOCKER",

    "docker": {

      "image": "172.31.17.36:5000/mesos-exporter:latest",

      "network": "HOST"

    },

    "volumes": [

      {

        "containerPath": "/etc/localtime",

        "hostPath": "/etc/localtime",

        "mode": "RO"

      }

    ]

  }

}
请打开slave 防火墙的9110/tcp 端口
alert-manager:
{

  "id": "alertmanager",

  "instances": 1,

  "cpus": 0.5,

  "mem": 128,

  "constraints": [

      ["hostname","UNIQUE"],

      ["hostname", "LIKE", "slave[1-6]"]

  ],

  "labels": {

    "HAPROXY_GROUP":"external",

    "HAPROXY_0_VHOST":"alertmanager.test.com"

  },

  "container": {

    "type": "DOCKER",

    "docker": {

      "image": "172.31.17.36:5000/alertmanager:latest",

      "network": "BRIDGE",

      "portMappings": [

        { "containerPort": 9093, "hostPort": 0, "servicePort": 0, "protocol": "tcp" }

      ]

    },

    "volumes": [

      {

        "containerPath": "/etc/localtime",

        "hostPath": "/etc/localtime",

        "mode": "RO"

      },

      {

        "containerPath": "/etc/alertmanager/config.yml",

        "hostPath": "/var/nfsshare/alertmanager/config.yml",

        "mode": "RO"

      },

      {

        "containerPath": "/alertmanager",

        "hostPath": "/var/nfsshare/alertmanager/data",

        "mode": "RW"

      }

    ]

  }

}
prometheus:
{

  "id": "prometheus",

  "instances": 1,

  "cpus": 0.5,

  "mem": 128,

  "args": [

      "-config.file=/etc/prometheus/prometheus.yml",

      "-storage.local.path=/prometheus",

      "-web.console.libraries=/etc/prometheus/console_libraries",

      "-web.console.templates=/etc/prometheus/consoles",

      "-alertmanager.url=http://alertmanager.test.com"

  ],

  "constraints": [

      ["hostname","UNIQUE"],

      ["hostname", "LIKE", "slave[1-6]"]

  ],

  "labels": {

    "HAPROXY_GROUP":"external",

    "HAPROXY_0_VHOST":"prometheus.test.com"

  },

  "container": {

    "type": "DOCKER",

    "docker": {

      "image": "172.31.17.36:5000/prometheus:latest",

      "network": "BRIDGE",

      "portMappings": [

        { "containerPort": 9090, "hostPort": 0, "servicePort": 0, "protocol": "tcp" }

      ]

    },

    "volumes": [

      {

        "containerPath": "/etc/localtime",

        "hostPath": "/etc/localtime",

        "mode": "RO"

      },

      {

        "containerPath": "/etc/prometheus",

        "hostPath": "/var/nfsshare/prometheus/conf",

        "mode": "RO"

      },

      {

        "containerPath": "/prometheus",

        "hostPath": "/var/nfsshare/prometheus/data",

        "mode": "RW"

      }

    ]

  }

}
4. prometheus 配置
prometheus.yml
# my global config

global:

  scrape_interval:     15s # By default, scrape targets every 15 seconds.

  evaluation_interval: 15s # By default, scrape targets every 15 seconds.

  # scrape_timeout is set to the global default (10s).

  # Attach these labels to any time series or alerts when communicating with

  # external systems (federation, remote storage, Alertmanager).

  external_labels:

      monitor: 'codelab-monitor'

# Load and evaluate rules in this file every 'evaluation_interval' seconds.

rule_files:

  # - "first.rules"

  # - "second.rules"

scrape_configs:

  - job_name: 'mesos-slaves'

    scrape_interval: 5s

    metrics_path: '/metrics'

    scheme: 'http'

    target_groups:

      - targets: ['172.31.17.31:9110', '172.31.17.32:9110', '172.31.17.33:9110', '172.31.17.34:9110', '172.31.17.35:9110', '172.31.17.36:9110']

      - labels:

          group: 'office'
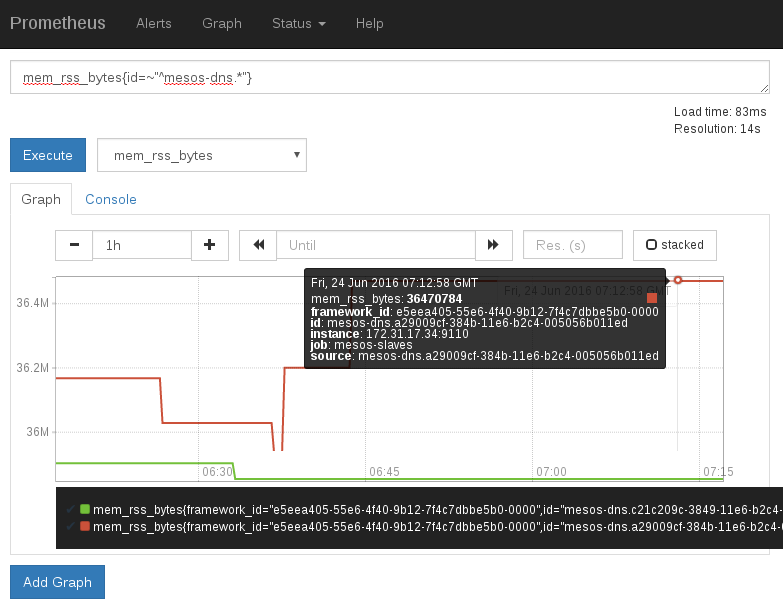
待补充 ...
5. 报警设置
待补充 ...
6. 与 grafana 集成
prometheus的 graph 功能不太完善,可以与 grafana 集成,让 grafana 承担 graph 功能。
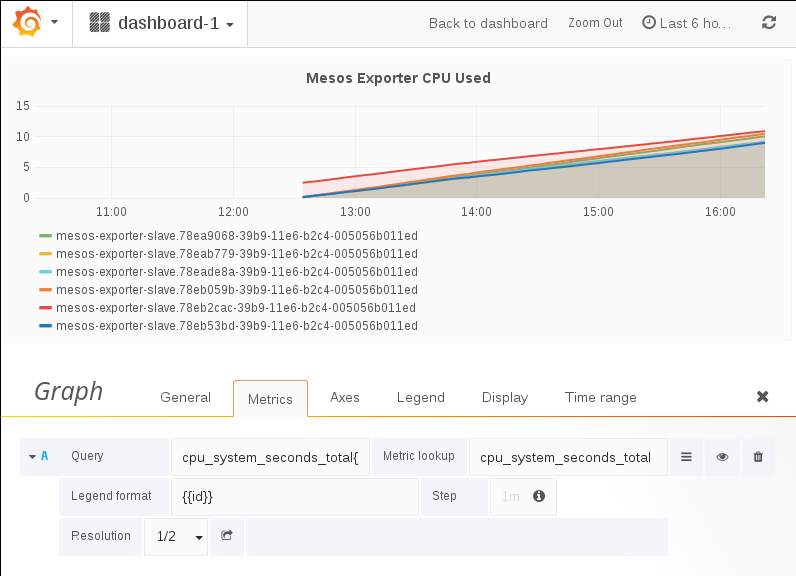
data source 设置:

7. 附:mesos metrics 和 statics 地址
http://master1:5050/metrics/snapshot
http://slave4:5051/metrics/snapshot
http://master1:5050/master/state.json
http://slave4:5051/monitor/statistics.json
用户可以基于上述页面的数据,编写自己的监控程序。
[系统集成] 部署 mesos-exporter 和 prometheus 监控 mesos task的更多相关文章
- 部署prometheus监控kubernetes集群并存储到ceph
简介 Prometheus 最初是 SoundCloud 构建的开源系统监控和报警工具,是一个独立的开源项目,于2016年加入了 CNCF 基金会,作为继 Kubernetes 之后的第二个托管项目. ...
- Prometheus监控软件部署方法
背景:负责基于区块链的某公正项目的状态上报模块设计编码,基于Prometheus进行二次开发 1.说明Prometheus 是一个开源的服务监控软件,它通过 HTTP 协议从远程机器收集数据并存储在本 ...
- Kubernetes集群部署史上最详细(二)Prometheus监控Kubernetes集群
使用Prometheus监控Kubernetes集群 监控方面Grafana采用YUM安装通过服务形式运行,部署在Master上,而Prometheus则通过POD运行,Grafana通过使用Prom ...
- 使用 Docker 部署 Grafana + Prometheus 监控 MySQL 数据库
一.背景 在平时开发过程当中需要针对 MySQL 数据库进行监控,这里我们可以使用 Grafana 和 Prometheus 来实现监控功能.Grafana 是一款功能强大的仪表盘面板,支持多种数据源 ...
- 基于k8s集群部署prometheus监控ingress nginx
目录 基于k8s集群部署prometheus监控ingress nginx 1.背景和环境概述 2.修改prometheus配置 3.检查是否生效 4.配置grafana图形 基于k8s集群部署pro ...
- 基于k8s集群部署prometheus监控etcd
目录 基于k8s集群部署prometheus监控etcd 1.背景和环境概述 2.修改prometheus配置 3.检查是否生效 4.配置grafana图形 基于k8s集群部署prometheus监控 ...
- 容器编排系统K8s之Prometheus监控系统+Grafana部署
前文我们聊到了k8s的apiservice资源结合自定义apiserver扩展原生apiserver功能的相关话题,回顾请参考:https://www.cnblogs.com/qiuhom-1874/ ...
- 如何利用Prometheus监控你的应用
Prometheus作为一套完整的开源监控接近方案,因为其诸多强大的特性以及生态的开放性,俨然已经成为了监控领域的事实标准并在全球范围内得到了广泛的部署应用.那么应该如何利用Prometheus对我们 ...
- 如何利用Prometheus监控你的应用(此列子是对于golang sdk进行运用)
Prometheus作为一套完整的开源监控接近方案,因为其诸多强大的特性以及生态的开放性,俨然已经成为了监控领域的事实标准并在全球范围内得到了广泛的部署应用.那么应该如何利用Prometheus对我们 ...
随机推荐
- 实时控制软件设计 第一次作业 Draw
#include <iostream> #include <cstring> #include <math.h> #include <Eigen/Dense& ...
- Appium常用的API函数
在学习应用一个框架之前,应该了解一下这个框架的整体结构或是相应的API函数.这篇文章还不错:http://blog.sina.com.cn/s/blog_68f262210102vzf9.html,就 ...
- (转)JS获取当前对象大小以及屏幕分辨率等
原文 JS获取当前对象大小以及屏幕分辨率等 <script type="text/javascript">function getInfo(){ var ...
- C# 类:类型 , 数学:类型
类(类型): //.Length:获取字符串的长度,返回int型 //.Trim去除字符串前后的空格 / ...
- 适配布局-ios
// 系统的约束代码 @implementation ViewController - (void)viewDidLoad { [super viewDidLoad]; UIView *superVi ...
- 10 条有趣的 Linux 命令
在终端工作是一件很有趣的事情.今天,我们将会列举一些有趣得为你带来欢笑的Linux命令. 1. rev 创建一个文件,在文件里面输入几个单词,rev命令会将你写的东西反转输出到控制台. # rev & ...
- 1.Basic Techniques and Knowledge
1.1 BASIC WINDOWS PROGRAMMING IN C/C++ 1.Hello World Version 1:Starting Your Browser Let's get down ...
- Xcode 的一些调式技巧
XCode 内置GDB,我们可以在命令行中使用 GDB 命令来调试我们的程序.下面将介绍一些常用的命令以及调试技巧. po 命令:为 print object 的缩写,显示对象的文本描述(显示从对象的 ...
- 编辑距离及其动态规划算法(Java代码)
编辑距离概念描述 编辑距离,又称Levenshtein距离,是指两个字串之间,由一个转成另一个所需的最少编辑操作次数.一般情况下编辑操作包括: 将一个字符替换成另一个字符: 插入一个字符: 删除一个字 ...
- 《The Evolution of Lua》读书笔记 1
lua的优点: 可移植性 容易嵌入 体积小 高效率 这些优点都来自于lua的设计目标:简洁.从Scheme获得了很多灵感,包括匿名函数,合理的语义域概念 lua前身: 巴西被禁运,引入计算机软件和 ...