漫谈可视化Prefuse(四)---被玩坏的Prefuse API
这个双12,别人都在抢红包、逛淘宝、上京东,我选择再续我的“漫谈可视化”系列(好了,不装了,其实是郎中羞涩。。。)
上篇《漫谈可视化Prefuse(三)---Prefuse API数据结构阅读有感》主要介绍了可视化工具Prefuse API中主要解读的是prefuse.data包中的主要接口,并利用《漫谈可视化Prefuse(一)---从SQL Server数据库读取数据》中例子,将参数配置模块剥离出来,实现界面传值,绘制图形。
本篇决定不再贴API,实在没啥意思,还占篇幅(但是不容置疑的是API确实很重要,想了解API点这里)。那今天我们主要讲讲Prefuse比较常用的包以及如何使用这些包做出自己想要的展示效果:
Demo1.解决图形元素形状单一化问题——DataShapeAction的使用
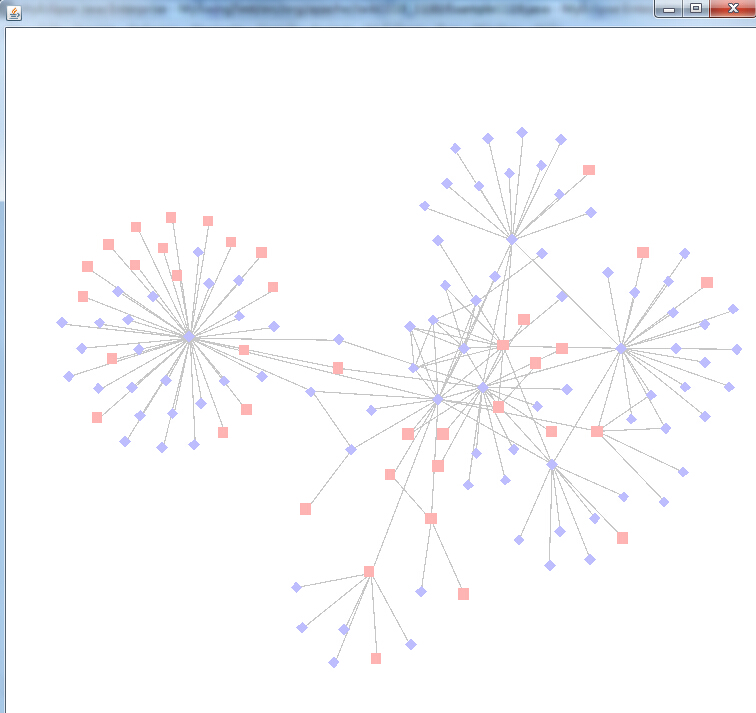
Prefuse对于节点的形状默认是使用Constants.SHAPE_RECTANGLE,这里使用DataShapeAction类完成一个图形中根据性别不同展示不同的节点形状,具体代码如下:
 public class Demo1 {

     /**

      * @param args

      */

     public static void main(String[] args) {

         Graph graph = null;

         try {

             graph = new GraphMLReader().readGraph("socialnet.xml");

         } catch (Exception e) {

             e.printStackTrace();

             System.out.println("Error loading");

             System.exit(1);

         }

         Visualization vis = new Visualization();

         vis.add("graph", graph);

         vis.setRendererFactory(new DefaultRendererFactory());

         int[] palette = new int[]{ColorLib.rgb(255, 180, 180),ColorLib.rgb(190, 190, 255)};

         DataColorAction fill = new DataColorAction("graph.nodes" , "gender" , Constants.NOMINAL, VisualItem.FILLCOLOR,palette);

         ColorAction text = new ColorAction("graph.nodes", VisualItem.TEXTCOLOR, ColorLib.gray(0));

         ColorAction edges = new ColorAction("graph.edges", VisualItem.STROKECOLOR, ColorLib.gray(200));

         int[] shapes = new int[]{ Constants.SHAPE_RECTANGLE, Constants.SHAPE_DIAMOND};

         DataShapeAction shape = new DataShapeAction("graph.nodes", "gender", shapes);

         ActionList color = new ActionList();

         color.add(fill);

         color.add(text);

         color.add(edges);

         color.add(shape);

         ActionList layout = new ActionList(Activity.INFINITY);

         layout.add(new ForceDirectedLayout("graph"));

         layout.add(new RepaintAction());

         vis.putAction("color", color);

         vis.putAction("layout", layout);

         Display display = new Display(vis);

         display.setSize(750, 700);

         display.pan(250, 250);

         display.addControlListener(new DragControl());

         display.addControlListener(new PanControl());

         display.addControlListener(new ZoomControl());

         display.addControlListener(new WheelZoomControl());

         display.addControlListener(new FocusControl(1));

         display.addControlListener(new ZoomToFitControl());

         JFrame jf = new JFrame();

         jf.setDefaultCloseOperation(JFrame.EXIT_ON_CLOSE);

         jf.add(display);

         jf.pack();

         jf.setVisible(true);

         vis.run("color");

         vis.run("layout");

     }

 }
DataShapeAction中的第一个参数为指定数据范围,这里指定针对“graph.nodes”点集;第二个参数为属性域,这里针对性别不同赋予不同的形状;第三个参数是形状数组,这里定义了Constants.SHAPE_RECTANGLE, Constants.SHAPE_DIAMOND,除此之外还有Constants.SHAPE_CROSS、Constants.SHAPE_ELLIPSE、Constants.SHAPE_STAR等。同理prefuse.action.assignment包下的DataColorAction用法与DataShapeAction类似。图形展示效果如下:
Demo2:打破输入输出流的垄断亲自绘制图形——Graph的使用
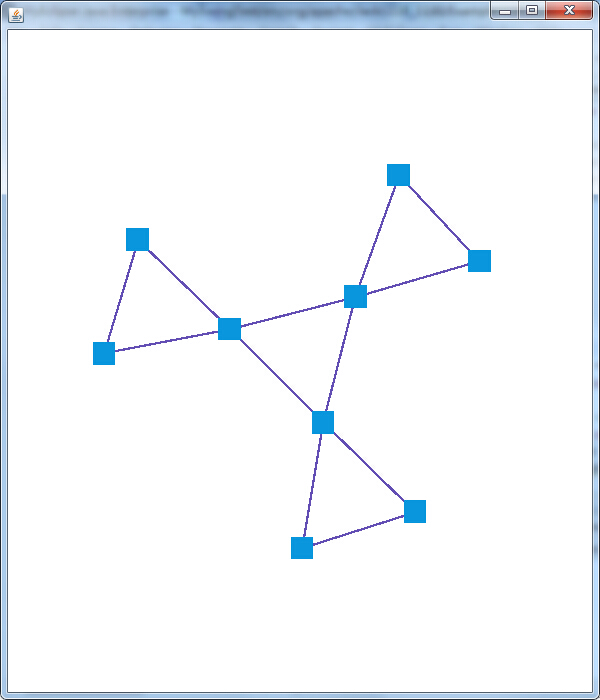
之前几篇介绍的例子主要依赖于prefuse.io中的读入写出操作类进行数据的导入,这里我们决定甩开膀子,自己丰衣足食,打造自己的图形,这里主要使用Graph类的添加节点以及添加边的方法,构建一个互连的三个三角形的形状。具体代码如下:
 public class Demo2{

     public static void main(String[] argv) {

         Visualization vis = new Visualization();

         Graph g = new Graph();

         for(int i = 0; i<3; i++){

             Node n1 = g.addNode();

             Node n2 = g.addNode();

             Node n3 = g.addNode();

             g.addEdge(n1, n2);

             g.addEdge(n2, n3);

             g.addEdge(n3, n1);

         }

         g.addEdge(0, 3);

         g.addEdge(3, 6);

         g.addEdge(6, 0);

         vis.add("graph", g);

         ShapeRenderer renderer = new ShapeRenderer(10);

         vis.setRendererFactory(new DefaultRendererFactory(renderer));

         ColorAction nodeFill = new ColorAction("graph.nodes", VisualItem.FILLCOLOR, ColorLib.rgb(10, 150, 220));

         ColorAction edgesStroke = new ColorAction("graph.edges", VisualItem.STROKECOLOR, ColorLib.rgb(100, 80, 180));

         ColorAction nodeHighlight = new ColorAction("graph.nodes", VisualItem.HIGHLIGHT, ColorLib.rgb(10, 150, 220));

         ActionList color = new ActionList();

         color.add(nodeFill);

         color.add(edgesStroke);

         ActionList layout = new ActionList(Activity.INFINITY);

         layout.add(color);

         layout.add(new ForceDirectedLayout("graph"));

         layout.add(new RepaintAction());

         Display display = new Display(vis);

         display.setSize(400, 500);

         display.pan(250, 250);

         display.addControlListener(new DragControl());

         display.addControlListener(new PanControl());

         display.addControlListener(new ZoomControl());

         display.addControlListener(new WheelZoomControl());

         display.addControlListener(new FocusControl(1));

         display.addControlListener(new ZoomToFitControl());

         vis.putAction("color", color);

         vis.putAction("layout", layout);

         JFrame frame = new JFrame();

         frame.setDefaultCloseOperation(JFrame.EXIT_ON_CLOSE);

         frame.pack();

         frame.setSize(600, 700);

         frame.add(display);

         frame.setVisible(true);

         vis.run("color");

         vis.run("layout");

     }

 }
从代码可以看出,对于创建节点、添加边,Graph处理的游刃有余,只有你想不到的图形,没有创建不了的Graph。当然只是简单创建了node和edge只是有了骨架,还需要血肉的填充,所以可以看到有很多的Action纷纷来助阵,最终的众志成城之作如下:
Demo3:谁说点点之间只能“直肠子”——EdgeRenderer的使用
看不惯点与点之间的“直肠子”?可以,Prefuse了解你,知道你喜新厌旧,这不使用EdgeRenderer就可以实现曲线连接,具体代码与Demo1相近,只是多了一下几行代码:
 DefaultRendererFactory rf = new DefaultRendererFactory(label);

 EdgeRenderer edgeRenderer = new EdgeRenderer(Constants.EDGE_TYPE_CURVE);

 rf.add(new InGroupPredicate("graph.edges"), edgeRenderer);
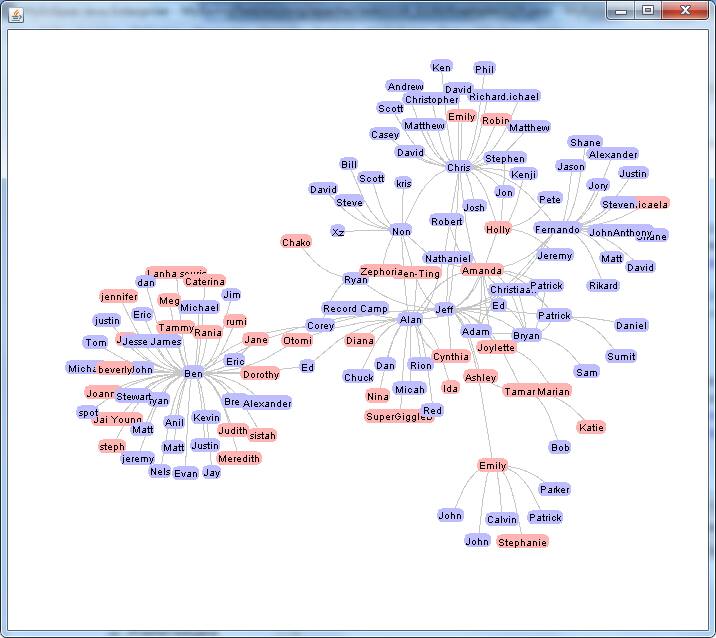
这里采用EdgeRenderer边渲染器,将边渲染为曲线,并统一应用到组“graph.edges”中的元素上,除了Constants.EDGE_TYPE_CURVE,还有Constants.EDGE_ARROW_FORWARD、Constants.EDGE_ARROW_NONE等。话不多说,看效果:
Demo4:Prefuse没节操?不知道筛选?No!——Predicate的使用
Prefuse自带过滤器,可以完成十分强大的过滤操作,视个别情况个别对待。拿Demo2中的图形来说,处在中间的节点可以不收节点控制(无法拖拽,不能交互),人家兄弟姐妹多,就拿那些势力若的边缘小弟拖过来拽过去^_^。具体代码如下:
 public class Demo4{

     public static void main(String[] argv) {

         Visualization vis = new Visualization();

         Graph g = new Graph();

         for(int i = 0; i<3; i++){

             Node n1 = g.addNode();

             Node n2 = g.addNode();

             Node n3 = g.addNode();

             g.addEdge(n1, n2);

             g.addEdge(n2, n3);

             g.addEdge(n3, n1);

         }

         g.addEdge(0, 3);

         g.addEdge(3, 6);

         g.addEdge(6, 0);

         vis.add("graph", g);

         ShapeRenderer renderer = new ShapeRenderer(10);

         EdgeRenderer edgeRenderer = new EdgeRenderer(Constants.EDGE_TYPE_CURVE);

         DefaultRendererFactory drf = new DefaultRendererFactory();

         drf.add(new InGroupPredicate("graph.edges"), edgeRenderer);

         vis.setRendererFactory(drf);

         ColorAction nodeFill = new ColorAction("graph.nodes", VisualItem.FILLCOLOR, ColorLib.rgb(10, 150, 220));

         ColorAction edgesStroke = new ColorAction("graph.edges", VisualItem.STROKECOLOR, ColorLib.rgb(100, 80, 180));

         ColorAction nodeHighlight = new ColorAction("graph.nodes", VisualItem.HIGHLIGHT, ColorLib.rgb(10, 150, 220));

         ShapeAction  shape = new ShapeAction("graph.nodes",Constants.SHAPE_CROSS); //设置节点形状

         ActionList color = new ActionList();

         color.add(nodeFill);

         color.add(edgesStroke);

         color.add(shape);

         ActionList layout = new ActionList(Activity.INFINITY);

         layout.add(color);

         layout.add(new ForceDirectedLayout("graph"));

         layout.add(new RepaintAction());

         Point p = new Point(100,200);

         p.move(300, 400);

         Predicate pCount =(Predicate)ExpressionParser.parse("degree()>2");

         Display display = new Display(vis);

         display.setSize(400, 500);

         display.pan(250, 250);

         display.animatePanAbs(230, 220, 2000);

         display.addControlListener(new DragControl());

         display.addControlListener(new PanControl());

         display.addControlListener(new ZoomControl());

         display.addControlListener(new WheelZoomControl());

         display.addControlListener(new FocusControl(1));

         display.addControlListener(new ZoomToFitControl());

         vis.removeGroup("graph");

         VisualGraph vg = vis.addGraph("graph", g);

         Iterator nodes = vg.nodes();

         display.addControlListener(new ControlAdapter() {

             public void itemEntered(VisualItem item, MouseEvent e) {

                 System.out.println("伦家已经是:" + item.getGroup()+"的人了");

             }

             public void itemExited(VisualItem item, MouseEvent e) {

                 System.out.println("哦,那杰哥再找找-_-");

             }

         });//为组件添加监控并作相应的响应

         vis.setInteractive("graph.nodes", pCount, false);

         vis.putAction("color", color);

         vis.putAction("layout", layout);

         JFrame frame = new JFrame();

         frame.setDefaultCloseOperation(JFrame.EXIT_ON_CLOSE);

         frame.pack();

         frame.setSize(600, 700);

         frame.add(display);

         frame.setVisible(true);

         vis.run("color");

         vis.run("layout");

     }

 }
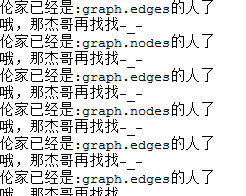
这里Predicate pCount =(Predicate)ExpressionParser.parse("degree()>2")表示过滤出节点度数大于2的,该过滤条件在vis.setInteractive("graph.nodes", pCount, false)中执行,即在组“graph.nodes”元素中节点度数大于2的不能交互(即鼠标拖拽无效)。
另外从代码中可以看出当鼠标经过和离开VisualItem(点或边)时会执行相应的操作,下图展现了部分结果:
Demo5:个性化定制,我有我个性——VisualItem的领悟
要知道,在数据中心Visualizaiton里,每一个node或是edge都可以看成一个VisualItem,每个VisualItem都可以有属于自己的造型、尺寸,这里我们还是用Demo2中的图形继续玩,直到玩坏为止。具体代码如下:
 public class Demo5{

     public static Visualization vis = new Visualization();

     public static void main(String[] argv) {

         Graph g = new Graph();

         for(int i = 0; i<3; i++){

             Node n1 = g.addNode();

             Node n2 = g.addNode();

             Node n3 = g.addNode();

             g.addEdge(n1, n2);

             g.addEdge(n2, n3);

             g.addEdge(n3, n1);

         }

         g.addEdge(0, 3);

         g.addEdge(3, 6);

         g.addEdge(6, 0);

         vis.add("graph", g);

         ShapeRenderer renderer = new ShapeRenderer(10);

         vis.setRendererFactory(new DefaultRendererFactory(renderer));

         vis.removeGroup("graph");

         VisualGraph vg = vis.addGraph("graph", g);

         VisualItem nodeI = (VisualItem)vg.getEdge(7).getSourceNode();

         nodeI.setShape(Constants.SHAPE_STAR);

         nodeI.setSize(4);

         nodeI.setFixed(true);

         VisualItem edgeI = (VisualItem)vg.getEdge(5);

         edgeI.setSize(8);

         ColorAction nodeFill = new ColorAction("graph.nodes", VisualItem.FILLCOLOR, ColorLib.rgb(10, 150, 220));

         ColorAction edgesStroke = new ColorAction("graph.edges", VisualItem.STROKECOLOR, ColorLib.rgb(100, 80, 180));

         ColorAction nodeHighlight = new ColorAction("graph.nodes", VisualItem.HIGHLIGHT, ColorLib.rgb(10, 150, 220));

         ActionList color = new ActionList();

         color.add(nodeFill);

         color.add(edgesStroke);

         ActionList layout = new ActionList(3000);

         layout.add(color);

         layout.add(new ForceDirectedLayout("graph"));

         layout.add(new RepaintAction());

         Display display = new Display(vis);

         display.setSize(400, 500);

         display.pan(250, 250);

         display.addControlListener(new DragControl());

         display.addControlListener(new PanControl());

         display.addControlListener(new ZoomControl());

         display.addControlListener(new WheelZoomControl());

         display.addControlListener(new FocusControl(1));

         display.addControlListener(new ZoomToFitControl());

         display.addControlListener(new ControlAdapter(){

             public void itemEntered(VisualItem item, MouseEvent e) {

                 System.out.println("伦家已经是:" + item.getGroup()+"的人了");

                 vis.run("color");

                 vis.run("layout");//重绘三秒

             }

         });

         vis.putAction("color", color);

         vis.putAction("layout", layout);

         JFrame frame = new JFrame();

         frame.setDefaultCloseOperation(JFrame.EXIT_ON_CLOSE);

         frame.pack();

         frame.setSize(600, 700);

         frame.add(display);

         frame.setVisible(true);

         vis.run("color");

         vis.run("layout");

     }

 }
可以看出代码中nodeI.setShape(Constants.SHAPE_STAR);nodeI.setSize(4);nodeI.setFixed(true);是将节点的形状设为星形,大小放大为4并固定此节点;edgeI.setSize(8);将边的粗细设为8。这里还具有一个功能,就是代码跑起来显示图形运行三秒,当鼠标经过某点或边是,整个图形在运行三秒,为展示这种效果,首次使用ps做gif,想想也是醉了。。。
Prefuse就先玩到这吧,真材实料送上5个Demo,虽然抢不到红包,抢点Demo补补脑也不错哦,走到这里,似乎我已经拉近了与Prefuse的距离,下一步就是力求亲密接触,碰撞出可视化狂拽炫酷的展示效果。觉得有用,记得点赞哦。
本文链接:《漫谈可视化Prefuse(四)---被玩坏的Prefuse API》http://www.cnblogs.com/bigdataZJ/p/VisualizationSoloShow4.html
友情赞助
如果你觉得博主的文章对你那么一点小帮助,恰巧你又有想打赏博主的小冲动,那么事不宜迟,赶紧扫一扫,小额地赞助下,攒个奶粉钱,也是让博主有动力继续努力,写出更好的文章^^。
1. 支付宝 2. 微信


漫谈可视化Prefuse(四)---被玩坏的Prefuse API的更多相关文章
- 漫谈可视化Prefuse(五)---一款属于我自己的可视化工具
伴随着前期的基础积累,翻过API,读过一些Demo,总觉得自己已经摸透了Prefuse,小打小闹似乎已经无法满足内心膨胀的自己.还记得儿时看的<武状元苏乞儿>中降龙十八掌最后一张居然是空白 ...
- 漫谈可视化Prefuse(五)
伴随着前期的基础积累,翻过API,读过一些Demo,总觉得自己已经摸透了Prefuse,小打小闹似乎已经无法满足内心膨胀的自己.还记得儿时看的<武状元苏乞儿>中降龙十八掌最后一张居然是空白 ...
- 漫谈可视化Prefuse(二)---一分钟学会Prefuse
前篇<漫谈可视化Prefuse(一)---从SQL Server数据库读取数据>主要介绍了prefuse如何连接数据库sql server并读取数据进行可视化展现. 回头想想还是应该好好捋 ...
- 漫谈可视化Prefuse(六)---改动源码定制边粗细
可视化一路走来,体会很多:博客一路写来,收获颇丰:代码一路码来,思路越来越清晰.终究还是明白了一句古话:纸上得来终觉浅,绝知此事要躬行. 跌跌撞撞整合了个可视化小tool,零零碎碎结交了众多的志同道合 ...
- 漫谈可视化Prefuse(三)---Prefuse API数据结构阅读有感
前篇回顾:上篇<漫谈可视化Prefuse(二)---一分钟学会Prefuse>主要通过一个Prefuse的具体实例了解了构建一个Prefuse application的具体步骤.一个Pre ...
- 漫谈可视化Prefuse(六)
可视化一路走来,体会很多:博客一路写来,收获颇丰:代码一路码来,思路越来越清晰.终究还是明白了一句古话:纸上得来终觉浅,绝知此事要躬行. 跌跌撞撞整合了个可视化小tool,零零碎碎结交了众多的志同道合 ...
- JS魔法堂:被玩坏的innerHTML、innerText、textContent和value属性
一.前言 由于innerText并非W3C标准属性,因此我们无法在FireFox中使用它(修正:FF45+已经支持innerText属性),一般情况下我们可以使用textContent来代替,但它两者 ...
- 【读后感】读《漫谈“大学生的四个learn”》之后有感
在看完<许纪霖教授在上海财经大学演讲——漫谈“大学生的四个Learn”>(下问简称<四l>)之后突然有点话想说.其实我对这篇文章有感的,所以想写这篇文章来说说看,我对四个lea ...
- [转]被玩坏的innerHTML、innerText、textContent和value属性
一.前言 由于innerText并非W3C标准属性,因此我们无法在FireFox中使用它,一般情况下我们可以使用textContent来代替,但它两者是否就能完全等同呢?在坑爹的表单元素(如input ...
随机推荐
- 离线安装eclipse的svn插件
原文:http://blog.sina.com.cn/s/blog_8e037f440101ebmz.html 连接不到外网情况下,在eclipse中安装svn插件. 两种方法: 首先下载安装到ecl ...
- [转]Python 中的 lambda,filter,map,reduce,apply
1. lambda 1. 基本形式: 函数名=lambda args1,args2,...,argsn:expression与C语言中的宏定义类似 2. Code isodd = lambda x: ...
- WinAPI: GetKeyNameText - 根据键盘消息获取按键名称
; Canvas.Font.Style := [fsBold]; Canvas.Font.Color := clRed; Canvas.Brush.Color := clWhite;..] of ...
- GnuPG 1.4.15 发布,邮件加密工具
GnuPG 1.4.15 改进包括: * Fixed possible infinite recursion in the compressed packet parser. [CVE-2013-44 ...
- 用c#开发微信 系列汇总
网上开发微信开发的教程很多,但c#相对较少.这里列出了我所有c#开发微信的文章,方便自己随时查阅. 一.基础知识 用c#开发微信(1)服务号的服务器配置和企业号的回调模式 - url接入 (源码下 ...
- 控件UI性能调优 -- SizeChanged不是万能的
简介 我们在之前的“UWP控件开发——用NuGet包装自己的控件“一文中曾提到XAML的布局系统 和平时使用上的一些问题(重写Measure/Arrange还是使用SizeChanged?),这篇博文 ...
- win10最新预览版9926使用评估
1月21日微软发布会,终于在周一发布了新的预览版本Build 9926,这个并不是客户预览版,仍然是开发者预览版,如图: 如果要查看自己的windows 10是那个版本,打开运行窗口,输入如下命令: ...
- 谈谈对BPM的理解
BPM的产生缘由 近年来,随着计算机技术的发展和互联网时代的到来,我们已经进入了信息时代,也称为数字化时代,在这数字化的时代里,企业的经营管理都受到了极大的挑战.从上世纪90年代起至今,企业的信息化工 ...
- Linux Shell函数
200 ? "200px" : this.width)!important;} --> 介绍 正文 $? $?是shell变量,表示"最后一次执行命令"的 ...
- VC++中开发汇编语言(转)
汇编程序结构 一个显示字符串的汇编程序 程序格式 一.模式定义 二.includelib语句 三.函数声明语句 四.数据和代码部分 Visual C/C++环境 建立工程 汇编程序的调试 一.设置断点 ...