
《机器学习实战》之k-近邻算法(改进约会网站的配对效果)
示例背景:
准备数据:从文本文件中解析数据
分析数据:使用Matplotlib创建散点图
 import matplotlib as mpl

 import matplotlib.pyplot as plt

 import operator

 def file2matrix(filename):  #获取数据

     f = open(filename)

     arrayOLines = f.readlines()

     numberOfLines = len(arrayOLines)

     returnMat = zeros((numberOfLines,3),dtype=float)

     #zeros(shape, dtype, order),创建一个shape大小的全为0矩阵,dtype是数据类型,默认为float,
       #order表示在内存中排列的方式(以C语言或Fortran语言方式排列),默认为C语言排列

     classLabelVector = []

     rowIndex = 0

     for line in arrayOLines:

         line = line.strip()

         listFormLine = line.split('\t')

         returnMat[rowIndex,:] = listFormLine[0:3]

         classLabelVector.append(int(listFormLine[-1]))

         rowIndex += 1

     return returnMat, classLabelVector

 if __name__ == "__main__":

     datingDataMat, datingLabels = file2matrix('datingTestSet2.txt')

     fig = plt.figure()  #图

     mpl.rcParams['font.sans-serif'] = ['KaiTi']

     mpl.rcParams['font.serif'] = ['KaiTi']

     plt.xlabel('玩视频游戏所耗时间百分比')

     plt.ylabel('每周消费的冰淇淋公升数')

     '''

     matplotlib.pyplot.ylabel(s, *args, **kwargs)

     override = {

        'fontsize'            : 'small',

        'verticalalignment'   : 'center',

        'horizontalalignment' : 'right',

        'rotation'='vertical' : }

     '''

     ax = fig.add_subplot(111) #将图分成1行1列,当前坐标系位于第1块处(这里总共也就1块)

     ax.scatter(datingDataMat[: ,1], datingDataMat[: ,2],15.0*array(datingLabels), 15.0*array(datingLabels))

     #scatter是用来画散点图的

     # scatter(x,y,s=1,c="g",marker="s",linewidths=0)

     # s:散列点的大小,c:散列点的颜色,marker:形状,linewidths:边框宽度

     plt.show()
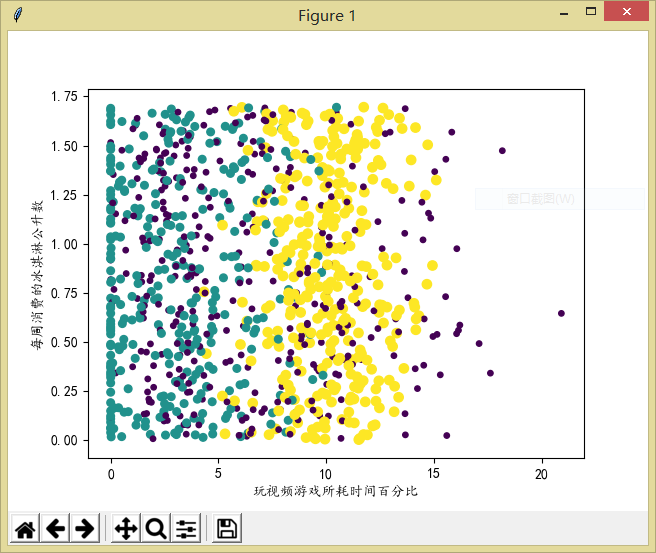
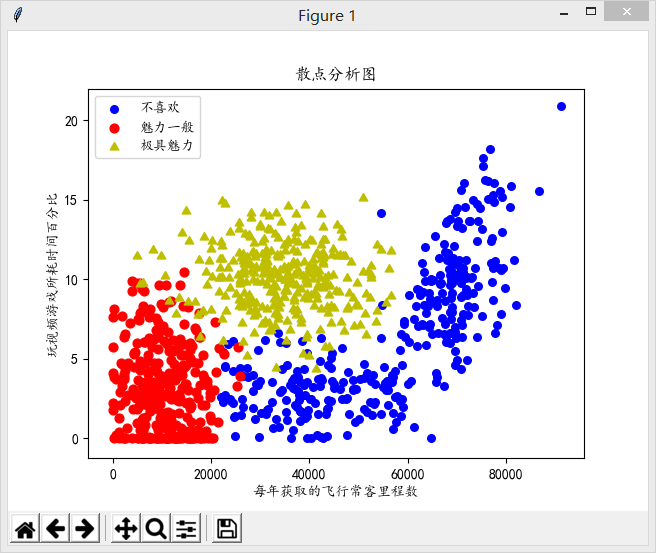
这是简单的创建了一下散点图,可以看到上面的图中还缺少了图例,所以下面的代码以另两列数据为例创建了带图例的散点图,代码大致还是一样的:
 from numpy import *

 import matplotlib as mpl

 import matplotlib.pyplot as plt

 import operator

 def file2matrix(filename):  #获取数据

     f = open(filename)

     arrayOLines = f.readlines()

     numberOfLines = len(arrayOLines)

     returnMat = zeros((numberOfLines,3),dtype=float)

     #zeros(shape, dtype, order),创建一个shape大小的全为0矩阵,dtype是数据类型,默认为float,order表示在内存中排列的方式(以C语言或Fortran语言方式排列),默认为C语言排列

     classLabelVector = []

     rowIndex = 0

     for line in arrayOLines:

         line = line.strip()

         listFormLine = line.split('\t')

         returnMat[rowIndex,:] = listFormLine[0:3]

         classLabelVector.append(int(listFormLine[-1]))

         rowIndex += 1

     return returnMat, classLabelVector

 if __name__ == "__main__":

     datingDataMat, datingLabels = file2matrix('datingTestSet2.txt')

     fig = plt.figure()  #图

     plt.title('散点分析图')

     mpl.rcParams['font.sans-serif'] = ['KaiTi']

     mpl.rcParams['font.serif'] = ['KaiTi']

     plt.xlabel('每年获取的飞行常客里程数')

     plt.ylabel('玩视频游戏所耗时间百分比')

     '''

     matplotlib.pyplot.ylabel(s, *args, **kwargs)

     override = {

        'fontsize'            : 'small',

        'verticalalignment'   : 'center',

        'horizontalalignment' : 'right',

        'rotation'='vertical' : }

     '''

     type1_x = []

     type1_y = []

     type2_x = []

     type2_y = []

     type3_x = []

     type3_y = []

     ax = fig.add_subplot(111) #将图分成1行1列,当前坐标系位于第1块处(这里总共也就1块)

     index = 0

     for label in datingLabels:

         if label == 1:

             type1_x.append(datingDataMat[index][0])

             type1_y.append(datingDataMat[index][1])

         elif label == 2:

             type2_x.append(datingDataMat[index][0])

             type2_y.append(datingDataMat[index][1])

         elif label == 3:

             type3_x.append(datingDataMat[index][0])

             type3_y.append(datingDataMat[index][1])

         index += 1

     type1 = ax.scatter(type1_x, type1_y, s=30, c='b')

     type2 = ax.scatter(type2_x, type2_y, s=40, c='r')

     type3 = ax.scatter(type3_x, type3_y, s=50, c='y', marker=(3,1))

     '''

      scatter是用来画散点图的

      matplotlib.pyplot.scatter(x, y, s=20, c='b', marker='o', cmap=None, norm=None, vmin=None, vmax=None, alpha=None, linewidths=None, verts=None, hold=None,**kwargs)

      其中,xy是点的坐标,s点的大小

      maker是形状可以maker=(5,1)5表示形状是5边型,1表示是星型(0表示多边形,2放射型,3圆形)

      alpha表示透明度;facecolor=‘none’表示不填充。

     '''

     ax.legend((type1, type2, type3), ('不喜欢', '魅力一般', '极具魅力'), loc=0)

     '''

     loc(设置图例显示的位置)

     'best'         : 0, (only implemented for axes legends)(自适应方式)

     'upper right'  : 1,

     'upper left'   : 2,

     'lower left'   : 3,

     'lower right'  : 4,

     'right'        : 5,

     'center left'  : 6,

     'center right' : 7,

     'lower center' : 8,

     'upper center' : 9,

     'center'       : 10,

     '''

     plt.show()
效果还是很不错的:
准备数据:归一化数值
当我们计算样本之间的欧几里得距离时,由于有些数值较大,所以它对结果整体的影响也就越大,那么小数据的可能就毫无影响了。在这个例子中飞行常客里程数很大,然而其余两列数据很小。为了解决这个问题,需要把数据相应的进行比例兑换,也就是这里需要做的归一化数值,将所有数值转化为[0,1]之间的值。
公式为:
$newValue = (oldValue-min)/(max-min)$ ($min$和$max$分别是数据集中的最小特征值和最大特征值)
 def autoNorm(dataSet): #归一化数值

     minVals = dataSet.min(0)  #0表示每列的最小值,1表示每行的最小值,以一维矩阵形式返回

     maxVals = dataSet.max(0)

     ranges = maxVals - minVals

     normDataSet = zeros(shape(dataSet))

     m = dataSet.shape[0]

     normDataSet = dataSet - tile(minVals, (m,1))

     normDataSet = normDataSet/tile(ranges, (m,1))

     return normDataSet, ranges, minVals
测试并构造完整算法
根据这1000个数据,将其中的100个作为测试数据,另900个作为训练集,看着100个数据集的正确率。
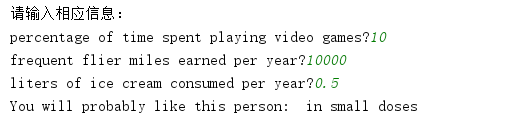
最后根据自己输入的测试数据来判断应该出现的结果是什么。
 from numpy import *

 import matplotlib as mpl

 import matplotlib.pyplot as plt

 import operator

 def classify0(inX, dataSet, labels, k):

     dataSetSize = dataSet.shape[0]

     diffMat = tile(inX, (dataSetSize,1)) - dataSet  #统一矩阵,实现加减

     sqDiffMat = diffMat**2

     sqDistances = sqDiffMat.sum(axis=1)  #进行累加,axis=0是按列,axis=1是按行

     distances = sqDistances**0.5  #开根号

     sortedDistIndicies = distances.argsort()  #按升序进行排序,返回原下标

     classCount = {}

     for i in range(k):

         voteIlabel = labels[sortedDistIndicies[i]]

         classCount[voteIlabel] = classCount.get(voteIlabel, 0) + 1  #get是字典中的方法,前面是要获得的值,后面是若该值不存在时的默认值

     sortedClassCount = sorted(classCount.items(), key=operator.itemgetter(1), reverse=True)

     return sortedClassCount[0][0]

 def file2matrix(filename):  #获取数据

     f = open(filename)

     arrayOLines = f.readlines()

     numberOfLines = len(arrayOLines)

     returnMat = zeros((numberOfLines,3),dtype=float)

     #zeros(shape, dtype, order),创建一个shape大小的全为0矩阵,dtype是数据类型,默认为float,order表示在内存中排列的方式(以C语言或Fortran语言方式排列),默认为C语言排列

     classLabelVector = []

     rowIndex = 0

     for line in arrayOLines:

         line = line.strip()

         listFormLine = line.split('\t')

         returnMat[rowIndex,:] = listFormLine[0:3]

         classLabelVector.append(int(listFormLine[-1]))

         rowIndex += 1

     return returnMat, classLabelVector

 def autoNorm(dataSet): #归一化数值

     minVals = dataSet.min(0)  #0表示每列的最小值,1表示每行的最小值,以一维矩阵形式返回

     maxVals = dataSet.max(0)

     ranges = maxVals - minVals

     normDataSet = zeros(shape(dataSet))

     m = dataSet.shape[0]

     normDataSet = dataSet - tile(minVals, (m,1))

     normDataSet = normDataSet/tile(ranges, (m,1))

     return normDataSet, ranges, minVals

 def datingClassTest(datingDataMat, datingLabels):  #测试正确率

     hoRatio = 0.1

     m = datingDataMat.shape[0]

     numTestVecs = int(hoRatio*m)

     numError = 0.0

     for i in range(numTestVecs):

         classifierResult = classify0(datingDataMat[i,:], datingDataMat[numTestVecs:m, :], datingLabels[numTestVecs:m], 3)

         print('The classifier came back with: %d, the real answer is: %d.' %(classifierResult, datingLabels[i]))

         if (classifierResult != datingLabels[i]):

             numError += 1

     print('错误率为 %f' %(numError/float(numTestVecs)))

 def classifyPerson(datingDataMat, datingLabels, ranges, minVals):

     result = ['not at all', 'in small doses', 'in large doses']

     print('请输入相应信息:')

     percentTats = float(input('percentage of time spent playing video games?'))

     ffMiles = float(input('frequent flier miles earned per year?'))

     iceCream = float(input('liters of ice cream consumed per year?'))

     inArr = array([ffMiles, percentTats, iceCream])

     classifyResult = classify0((inArr-minVals)/ranges, datingDataMat, datingLabels, 3)

     print('You will probably like this person: ', result[classifyResult-1])

 if __name__ == "__main__":

     datingDataMat, datingLabels = file2matrix('datingTestSet2.txt')

     datingDataMat, ranges, minVals = autoNorm(datingDataMat) #归一化数值

     datingClassTest(datingDataMat, datingLabels)

     classifyPerson(datingDataMat, datingLabels, ranges, minVals)

     fig = plt.figure()  #图

     plt.title('散点分析图')

     mpl.rcParams['font.sans-serif'] = ['KaiTi']

     mpl.rcParams['font.serif'] = ['KaiTi']

     plt.xlabel('每年获取的飞行常客里程数')

     plt.ylabel('玩视频游戏所耗时间百分比')

     '''

     matplotlib.pyplot.ylabel(s, *args, **kwargs)

     override = {

        'fontsize'            : 'small',

        'verticalalignment'   : 'center',

        'horizontalalignment' : 'right',

        'rotation'='vertical' : }

     '''

     type1_x = []

     type1_y = []

     type2_x = []

     type2_y = []

     type3_x = []

     type3_y = []

     ax = fig.add_subplot(111) #将图分成1行1列,当前坐标系位于第1块处(这里总共也就1块)

     index = 0

     for label in datingLabels:

         if label == 1:

             type1_x.append(datingDataMat[index][0])

             type1_y.append(datingDataMat[index][1])

         elif label == 2:

             type2_x.append(datingDataMat[index][0])

             type2_y.append(datingDataMat[index][1])

         elif label == 3:

             type3_x.append(datingDataMat[index][0])

             type3_y.append(datingDataMat[index][1])

         index += 1

     type1 = ax.scatter(type1_x, type1_y, s=30, c='b')

     type2 = ax.scatter(type2_x, type2_y, s=40, c='r')

     type3 = ax.scatter(type3_x, type3_y, s=50, c='y', marker=(3,1))

     '''

      scatter是用来画散点图的

      matplotlib.pyplot.scatter(x, y, s=20, c='b', marker='o', cmap=None, norm=None, vmin=None, vmax=None, alpha=None, linewidths=None, verts=None, hold=None,**kwargs)

      其中,xy是点的坐标,s点的大小

      maker是形状可以maker=(5,1)5表示形状是5边型,1表示是星型(0表示多边形,2放射型,3圆形)

      alpha表示透明度;facecolor=‘none’表示不填充。

     '''

     ax.legend((type1, type2, type3), ('不喜欢', '魅力一般', '极具魅力'), loc=0)

     '''

     loc(设置图例显示的位置)

     'best'         : 0, (only implemented for axes legends)(自适应方式)

     'upper right'  : 1,

     'upper left'   : 2,

     'lower left'   : 3,

     'lower right'  : 4,

     'right'        : 5,

     'center left'  : 6,

     'center right' : 7,

     'lower center' : 8,

     'upper center' : 9,

     'center'       : 10,

     '''

     plt.show()
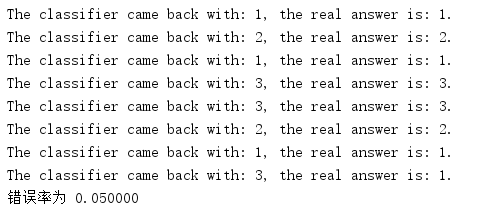
可以看到错误率为5%:
《机器学习实战》之k-近邻算法(改进约会网站的配对效果)的更多相关文章
- 使用K近邻算法改进约会网站的配对效果
1 定义数据集导入函数 import numpy as np """ 函数说明:打开并解析文件,对数据进行分类:1 代表不喜欢,2 代表魅力一般,3 代表极具魅力 Par ...
- 吴裕雄--天生自然python机器学习:使用K-近邻算法改进约会网站的配对效果
在约会网站使用K-近邻算法 准备数据:从文本文件中解析数据 海伦收集约会数据巳经有了一段时间,她把这些数据存放在文本文件(1如1^及抓 比加 中,每 个样本数据占据一行,总共有1000行.海伦的样本主 ...
- k-近邻(KNN)算法改进约会网站的配对效果[Python]
使用Python实现k-近邻算法的一般流程为: 1.收集数据:提供文本文件 2.准备数据:使用Python解析文本文件,预处理 3.分析数据:可视化处理 4.训练算法:此步骤不适用与k——近邻算法 5 ...
- 机器学习读书笔记(二)使用k-近邻算法改进约会网站的配对效果
一.背景 海伦女士一直使用在线约会网站寻找适合自己的约会对象.尽管约会网站会推荐不同的任选,但她并不是喜欢每一个人.经过一番总结,她发现自己交往过的人可以进行如下分类 不喜欢的人 魅力一般的人 极具魅 ...
- 【Machine Learning in Action --2】K-近邻算法改进约会网站的配对效果
摘自:<机器学习实战>,用python编写的(需要matplotlib和numpy库) 海伦一直使用在线约会网站寻找合适自己的约会对象.尽管约会网站会推荐不同的人选,但她没有从中找到喜欢的 ...
- 使用k-近邻算法改进约会网站的配对效果
---恢复内容开始--- < Machine Learning 机器学习实战>的确是一本学习python,掌握数据相关技能的,不可多得的好书!! 最近邻算法源码如下,给有需要的入门者学习, ...
- 《机器学习实战》-k近邻算法
目录 K-近邻算法 k-近邻算法概述 解析和导入数据 使用 Python 导入数据 实施 kNN 分类算法 测试分类器 使用 k-近邻算法改进约会网站的配对效果 收集数据 准备数据:使用 Python ...
- 机器学习实战1-2.1 KNN改进约会网站的配对效果 datingTestSet2.txt 下载方法
今天读<机器学习实战>读到了使用k-临近算法改进约会网站的配对效果,道理我都懂,但是看到代码里面的数据样本集 datingTestSet2.txt 有点懵,这个样本集在哪里,只给了我一个文 ...
- KNN算法项目实战——改进约会网站的配对效果
KNN项目实战——改进约会网站的配对效果 1.项目背景: 海伦女士一直使用在线约会网站寻找适合自己的约会对象.尽管约会网站会推荐不同的人选,但她并不是喜欢每一个人.经过一番总结,她发现自己交往过的人可 ...
- 02机器学习实战之K近邻算法
第2章 k-近邻算法 KNN 概述 k-近邻(kNN, k-NearestNeighbor)算法是一种基本分类与回归方法,我们这里只讨论分类问题中的 k-近邻算法. 一句话总结:近朱者赤近墨者黑! k ...
随机推荐
- Android Auto开发初探
一.Android Auto 概述 二.Android Auto 使用方法 四.Android Auto应用开发 五.Android Auto开发总结 一.Android Auto 概述 最近物联网是 ...
- echart中间显示固定的字
- Python+OpenCV图像处理(五)—— 像素运算
最近在忙毕业设计,只能偶尔更新博客........ 一.像素的算术运算 像素的算术运算涉及加减乘除等基本运算(要进行算术运算,两张图片的形状(shape)必须一样) 代码如下: #像素的算术运算(加. ...
- sass中的循环判断条件语句
@if $lte7:true !default;//是否兼容ie6,7 //inline-block //ie6-7 *display: inline;*zoom:1; @mixin inline-b ...
- ubuntu 18.04下安装配置Hue问题记录
前段时间将Hadoop 在ubuntu环境下装好,接下来尝试安装Hue来管理Hadoop,参照的资料有: 1.高可用Hadoop平台-Hue In Hadoop 2.ubuntu16.04 安装单机H ...
- mysql03
查询的列不在同一表中必须使用连接内连接,外链接 -- 输出学生姓名以及对应的年级名称 内连接 select studentName,gradeName from student inner join ...
- Python笔记 #20# SOM
SOM(自组织映射神经网络)是一种可以根据输入对象的特征自动进行分类(聚类)的神经网络.向该网络输入任意维度的向量都会得到一个二维图像, 不同特征的输入会被映射到二维图像的不同地方(所以SOM也可以用 ...
- mysql 查询重复值
SELECT `code`,count(`code`) as count FROM `yt_coupon` GROUP BY `code` HAVING count(`code`) > ...
- torchvision.datasets.ImageFolder数据加载
ImageFolder 一个通用的数据加载器,数据集中的数据以以下方式组织 root/dog/xxx.png root/dog/xxy.png root/dog/xxz.png root/cat/12 ...
- Python建立多线程任务并获取每个线程返回值
1.进程和线程 (1)进程是一个执行中的程序.每个进程都拥有自己的地址空间.内存.数据栈以及其他用于跟踪执行的辅助数据.进程也可以派生新的进程来执行其他任务,不过每个新进程都拥有自己的内存和数据栈,所 ...