.NetCore下使用Prometheus实现系统监控和警报 (二)Linux安装
Prometheus对Windows有相关的支持 下载地址:https://prometheus.io/download/
wget https://github.com/prometheus/prometheus/releases/download/v2.5.0/prometheus-2.5.0.linux-amd64.tar.gz
如果需要也可以下载其他组件支持
解压安装:
tar -xvf prometheus-2.5..linux-amd64.tar.gz
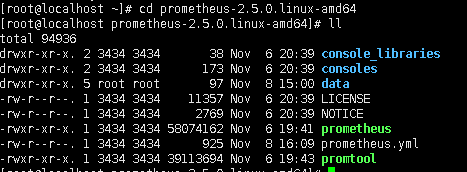
查看配置:cd /目录查看配置
cd prometheus-2.5..linux-amd64
配置如下:
# my global config

global:

  scrape_interval:    15s # Set the scrape interval to every  seconds. Default is every  minute.

  evaluation_interval: 15s # Evaluate rules every  seconds. The default is every  minute.

  # scrape_timeout is set to the global default (10s).

# Alertmanager configuration

alerting:

  alertmanagers:

  - static_configs:

    - targets:

      # - alertmanager:

# Load rules once and periodically evaluate them according to the global 'evaluation_interval'.

rule_files:

  # - "first_rules.yml"

  # - "second_rules.yml"

# A scrape configuration containing exactly one endpoint to scrape:

# Here it's Prometheus itself.

scrape_configs:

  # The job name is added as a label `job=<job_name>` to any timeseries scraped from this config.

  - job_name: 'prometheus'

    # metrics_path defaults to '/metrics'

    # scheme defaults to 'http'.

    static_configs:

    - targets: ['localhost:9090']

~

~

~

~

"prometheus.yml" 29L, 925C
scrape_interval:收集频率
evaluation_interval:分析评率
alerting:预警相关设置
scrape_configs:分析配置,static_configs中要特别说明下收集目标,targets:[localhost:9090] 这里是数组 可以配置多个
注意:这里跟前面的 InfluxDB+AppMetrics 不一样,AppMetrics是在应用程序中去主动推送分析数据到 InfluxDB,而Prometheus是通过targets配置的地址去获取,但是在应用程序端也需要使用客户端中间件处理下
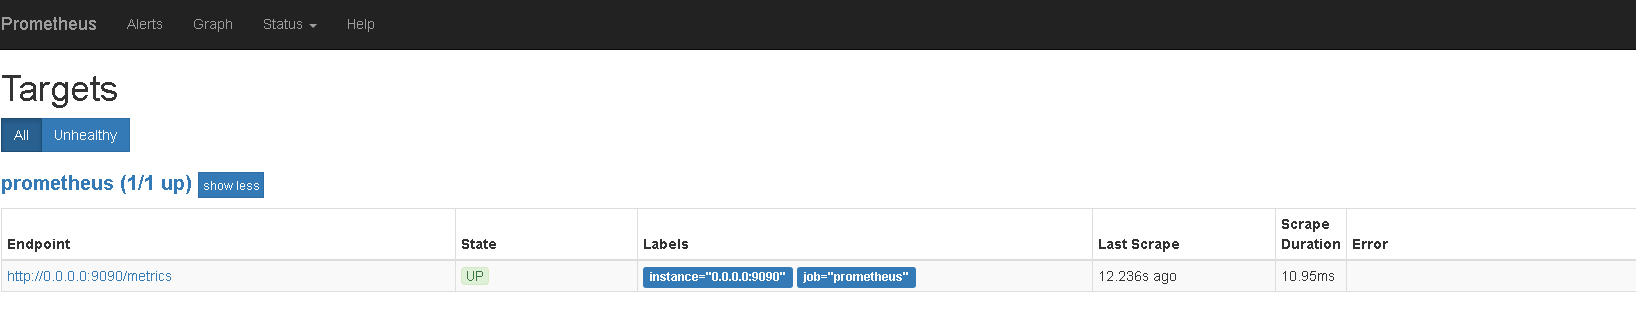
这里默认收集localhost:9090
下面我们后台启动下Prometheus,可以指定配置启动
./prometheus --config.file=prometheus.yml &
在打开9090端口测试下:
firewall-cmd --zone=public --add-port=/tcp --permanent

firewall-cmd --reload
浏览下

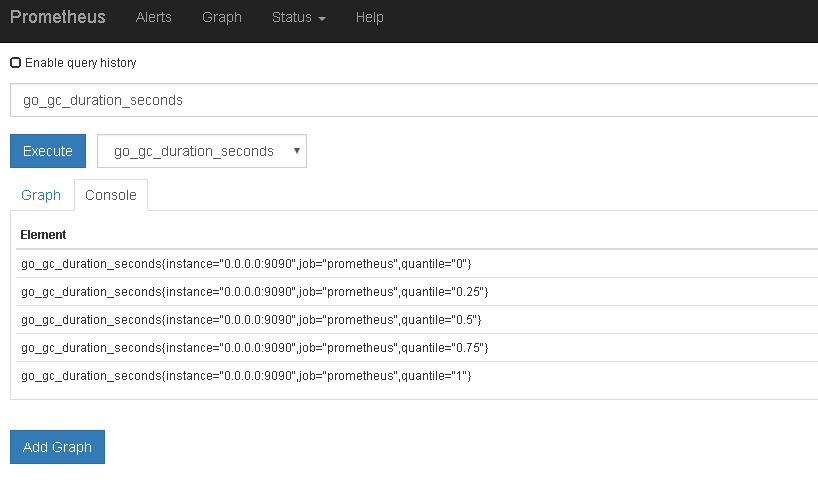
可以选择指定的分析指标

选择一个指标查询看下
我们也可以通过图表看查看分析情况,并添加添加多个图表分析

当然还有一些额外的处理,比如监控节点展示、服务发现等其他细节用法参考官方文档

.NetCore下使用Prometheus实现系统监控和警报 (二)Linux安装的更多相关文章
- .NetCore下使用Prometheus实现系统监控和警报 (一)介绍【译】
[译]原文https://prometheus.io/docs/introduction/overview 什么是Prometheus? Prometheus是一个开源系统监控和警报工具包,最初起源于 ...
- .NetCore下使用Prometheus实现系统监控和警报 (六)进阶Grafana集成自定义收集指标
Prometheus中包含了很多收集指标,那么我们怎来在Grafana中来使用呢? 接下来我们还是以之前自定义的来演示如图:我们在Prometheus中已经可以看到这个之前我们自定义的类型了 关于Gr ...
- .NetCore下使用Prometheus实现系统监控和警报 (五)进阶自定义收集指标 之 Counter
Prometheus下面定了四种类型的收集方式,下面我们主要来来说下Counter的使用 Nuget导入Prometheus.AspNetCore包 下面先来看下我的Prometheus配置,这里我没 ...
- .NetCore下使用Prometheus实现系统监控和警报 (四)客户端代码处理
在代码中使用就比较简单了 Nuget包获取下 prometheus-net prometheus-net.AspNetCore 然后添加中间件就行了 app.UseMetricServer(); 默认 ...
- .NetCore下使用Prometheus实现系统监控和警报 (三)集成Grafana
有了前面InfluxDB的经验,这里就很好处理了,数据类型选择Prometheus选地址等,填好保存 同样通过导入数据处理,我们在https://grafana.com/dashboards上选择Da ...
- VMware系统运维(二)安装Microsoft .NET 3.5
1.安装vmware vSphere 5.5 之前先安装Microsoft .NET 3.5. 2.安装Microsoft .NET3.5,添加角色和功能. 3.勾选.NET Framework 3. ...
- java系统监控分析Jprofile下载及安装配置【转】
JProfiler是一个全功能的Java剖析工具(profiler),专用於分析J2SE和J2EE应用程式.它把CPU.线程和记忆体的剖析组合在一个强大的应用中.JProfiler可提供许多IDE整合 ...
- Linux系统运维笔记(二),Linux文件编辑命令
Linux系统运维笔记 Linux文件编辑命令 首先我们使用命令 vi filename 打开一个文件,这个时候进入到的是命令模式 接下来我们按i,然后键盘随便输入写内容. 然后按ESC重新进入到命令 ...
- go-zero docker-compose 搭建课件服务(七):prometheus+grafana服务监控
0.转载 go-zero docker-compose 搭建课件服务(七):prometheus+grafana服务监控 0.1源码地址 https://github.com/liuyuede123/ ...
随机推荐
- python接口自动化感悟
一个方法对应一个接口,每个方法都要有登陆 成一个独立的逻辑功能块
- Java8新特性之Stream
原文链接:http://ifeve.com/stream/ Java8初体验(二)Stream语法详解 感谢同事[天锦]的投稿.投稿请联系 tengfei@ifeve.com上篇文章Java8初体验( ...
- Simple Cycles Edges CodeForces - 962F(点双连通分量)
题意: 求出简单环的所有边,简单环即为边在一个环内 解析: 求出点双连通分量,如果一个连通分量的点数和边数相等,则为一个简单环 点双连通分量 任意两个点都至少存在两条点不重复的路径 即任意两条边都 ...
- redis scan迭代模糊匹配
$redis = new Redis(); $redis->connect('localhost', 6379); $iterator = null; while (true) { $keys ...
- 【BZOJ1970】[AHOI2005]矿藏编码(模拟)
[BZOJ1970][AHOI2005]矿藏编码(模拟) 题面 BZOJ 洛谷 题解 随便写个高精度模拟一下就完了. #include<iostream> #include<cstd ...
- SQLServer过期的解决方案
看图吧,不喜欢说话,图里面我都打备注了 0SQLService异常 1找到安装中心 2升级版本 3监测ing 4输入升级key 5同意并下一步 6下一步 7下一步 8下一步 9收工 10可以打开了
- 转头条:阿里p7架构师:三年经验应该具备什么样的技能?
问:工作中,有时候实现一个功能,会去看有没有现成的轮子可用.对于重复造轮子与改造轮子有什么看法? 答:一定会的,其实这也是一个提高技术能力的方法,比如今天想做个日期转换的功能,JDK8有日期的新特性就 ...
- MVC、MVP和MVVM浅谈
MVC是最经典的开发模式之一,最早是后台那边来的,后台前端的复杂度也上来了,MVC的开发模式也带进前端了. MVC: MVC有两个很明显的问题: 1.m层和v层直接打交道,导致这两层耦合度高 2.因为 ...
- 本日吐槽!“人傻钱多”的P2P公司是否是程序员的合适选择(群聊天记录的娱乐)
这个题目“P2P的职位是否是程序员的合适选择”这个问题本身是没啥可以吐槽的 但是每当我们讨论那种类型的公司工资愿意给前端工程师开的最高的时候,P2P这个行业被第一个提出了 目前我收到过面试的企业类型千 ...
- html5 canvas 圆形径向渐变
<!DOCTYPE html PUBLIC "-//W3C//DTD XHTML 1.0 Transitional//EN" "http://www.w3.org/ ...