ELK使用3-Logstash
一、命令行输入输出操作
1、命令行输出:
/application/elk/logstash/bin/logstash -e 'input { stdin{} } output { stdout{} }'
说明:
a、stdin{}[标准输入]
b、stdout{}[标准输出]
2、以json格式展示,在logstash中等号用 => 表示
/application/elk/logstash/bin/logstash -e 'input { stdin{} } output { stdout{ codec => rubydebug} }'
3、输出到es
a、要使用按照自定义方式根据当前时间生成索引的方式来输入到es必须开启 manage_template => true此参数,如使用logstash默认的logstash-%{+YYYY.MM.dd} 则可以不用打开此参数,这个问题困扰了一下午。
/application/elk/logstash/bin/logstash -e 'input { stdin{} } output { elasticsearch { hosts => ["192.168.30.41:9200"] index => "wohaoshuai-%{+YYYY.MM.dd}"} manage_template => true}'
如果不使用manage_template => true参数会报错如下:
[406] {"error":"Content-Type header [text/plain; charset=ISO-8859-1] is not supported","status":406} {:class=>"Elasticsearch::Transport::Transport::Errors::NotAcceptable", :level=>:error}
b、如果只是自己命名的index则不需要添加manage_template参数。
/application/elk/logstash/bin/logstash -e 'input { stdin{ } } output { elasticsearch { hosts => ["192.168.30.41:9200"] index => "wohaoshuaitest"} }'
4、既输出到es又输出到屏幕:
/application/elk/logstash/bin/logstash -e 'input { stdin{ } } output { stdout { codec => rubydebug } elasticsearch { hosts => ["192.168.30.41:9200"] index => "wohaoshuaitest"} }'
5、要删除后重新生成index收集需要删除相应的记录
rm -rf /application/elk/logstash/data/plugins/inputs/file/.sincedb_*
6、nginx日志格式设置:
log_format access_log_json '{"user_ip":"$http_x_real_ip","lan_ip":"$remote_addr","log_time":"$time_iso8601","user_req":"$request","http_code":"$status","body_bytes_sent":"$body_bytes_sent","req_time":"$request_time","user_ua":"$http_user_agent"}';
7、filter
a、grok:对我们收进来的事件进行过滤。
利用正则表达式进行匹配进行字段的拆分,因此grok提供了一下预定义的正则表达式,logstash 5.6.1相应的文件在路径 /application/elk/logstash/vendor/bundle/jruby/2.3.0/gems/logstash-patterns-core-4.1.2/patterns下
简单的grok案例:
下面匹配的内容为:55.3.244.1 GET /index.html 15824 0.043
input {

  file {

    path => "/var/log/http.log"

  }

}

filter {

  grok {

    match => { "message" => "%{IP:client} %{WORD:method} %{URIPATHPARAM:request} %{NUMBER:bytes} %{NUMBER:duration}" } #这一行的意思是,将消息按照logstash提供的正则字段匹配,然后将匹配的内容的字段命名为冒号后面自定义的名字

  }

}
b、收集http日志,使用软件自定义的阿帕奇系统日志正则就可以,文件在/application/elk/logstash/vendor/bundle/jruby/2.3.0/gems/logstash-patterns-core-4.1.2/patterns/httpd中
如图
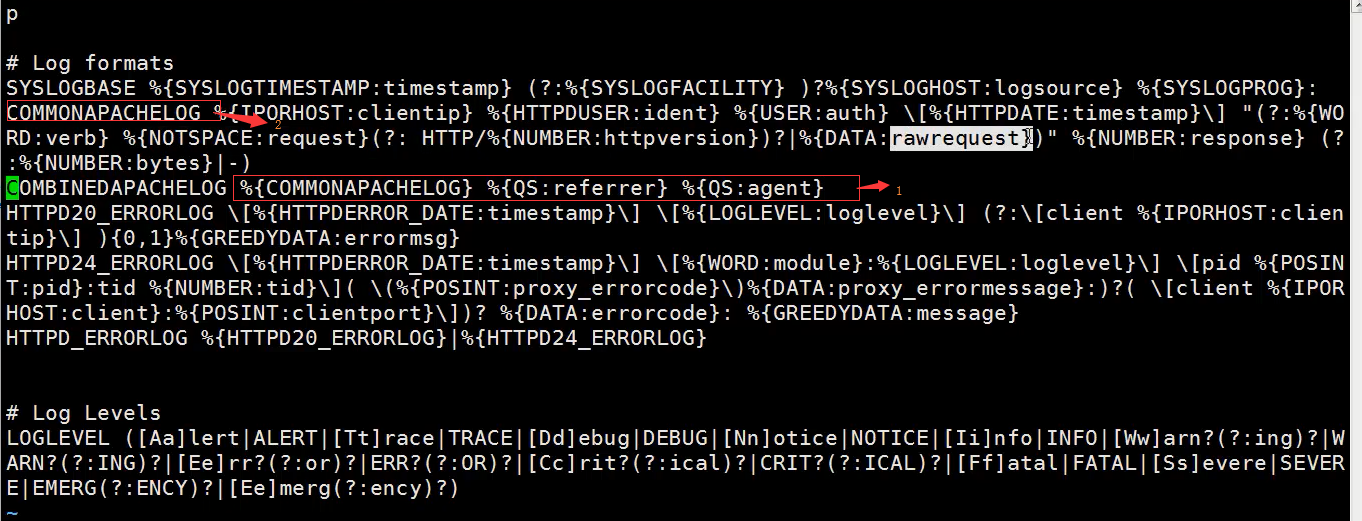
其中截图中序号1的意思是引用序号2中的匹配字段,然后又引用了两次QS匹配字段,QS匹配字段在同目录下的grok-patterns中
c、debuger地址http://grokdebug.herokuapp.com(需FQ)
二、公司架构设计
1、每个ES上面都启动一个Kibana
2、Kibana都连自己的ES
3、前端Nginx负载均衡+ ip_hash + 验证 +ACL
三、rsyslog记录
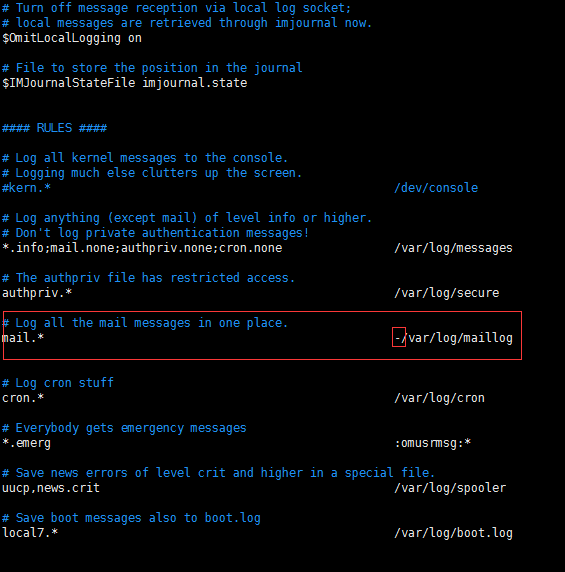
1、系统日志配置文件在/etc/rsyslog.conf中
2、配置文件中路径前面加 - 是为了不让日志立马写到文件中而是先进行缓存,在很多系统优化中都使用到。
3、要打开系统日志收集功能需要如下操作:
a、sed -i 's/#*.* @@remote-host:514/*.* @@192.168.30.42:514/g' /etc/rsyslog.conf
b、 systemctl restart rsyslog
4、手动产生系统日志方法
logger hehe
四、tcp日志收集
1、给tcp端口发送消息方法
yum install -y nc
a、方法1:
echo "wohaoshuai" | nc 192.168.56.12 6666
b、方法2:
nc 192.168.30.42 6666 < /etc/resolv.conf
c、方法3:伪设备的方式
echo "wohaoshuai" > /dev/tcp/192.168.30.42/6666
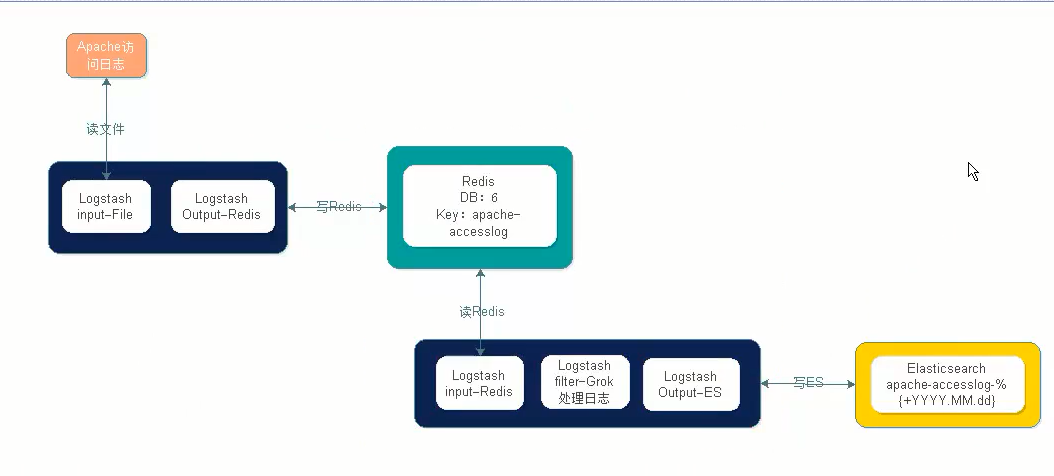
五、收集http日志架构
六、使用elk进行日志收集需求与思路
1、需求分析:
a、访问日志: apache访问日志、nginx访问日志、tomcat file - filter
b、错误日志:error log 、java日志 只接收,java异常需要处理
c、系统日志:/var/log/* syslog syslog,rsyslog
d、运行日志:程序写的 file,json
e、网络日志:防火墙,交换机,路由器的日志 syslog
2、标准化:日志放哪里 (/application/logs),格式是什么(JSON),命名规则 access_log error_log runtime_log 日志怎么切割,按天 按小时。access error crontab进行切分 runtime_log,所有的原始文本 rsync到NAS(文件服务器)后删除最近三天前的。
3、工具化:如何使用logstash进行收集方案
4、如果使用redis list 作为ELKstack的消息队列,那么请对所有list key的长度进行监控 llen key_name
a、根据实际情况,例如超过10万就报警。
七、相应logstash配置文件
1、stdin调试
input{

        stdin{}

}

filter{

}

output{

        #elasticsearch plugin

        elasticsearch{

                hosts => ["192.168.30.41:9200"]

                index => "log-%{+YYYY.MM.dd}"

                manage_template => true

        }

        stdout{

                codec => rubydebug

        }

}
2、file插件
input{

        file{

        path => ["/var/log/messages","/var/log/secure"]

        #type => "system-log"

        start_position => "beginning"

}

}

filter{

}

output{

        #elasticsearch plugin

        elasticsearch{

                hosts => ["192.168.30.41:9200"]

                index => "system-log-%{+YYYY.MM.dd}"

                manage_template => true

        }

        stdout{

                codec => rubydebug

        }

}
3、使用type判断
input{

        file{

        path => ["/var/log/messages","/var/log/secure"]

        type => "system-log"

        start_position => "beginning"

}

        file{

        path => ["/application/elk/elasticsearch/logs/elk-elasticsearch.log"]

        type => "es-log"

        start_position => "beginning"

}

}

filter{

}

output{

        #elasticsearch plugin

        if [type] == "system-log"

        {

                elasticsearch{

                        hosts => ["192.168.30.41:9200"]

                        index => "system-log-%{+YYYY.MM.dd}"

                        manage_template => true

                }

        }

        if [type] == "es-log"

        {

                elasticsearch{

                        hosts => ["192.168.30.41:9200"]

                        index => "es-log-%{+YYYY.MM.dd}"

                        manage_template => true

                }

        }

        stdout{

                codec => rubydebug

        }

}
4、收集某个目录下的所有日志
input{

        file{

        path => ["/var/log/messages","/var/log/secure"]

        type => "system-log"

        start_position => "beginning"

}

        file{

        path => ["/application/elk/elasticsearch/logs/elk-elasticsearch.log"]

        type => "es-log"

        start_position => "beginning"

}

        file{

        path => ["/application/elk/elasticsearch/logs/**/*.log"]

        type => "docker-log"

        start_position => "beginning"

}

}

filter{

}

output{

        #elasticsearch plugin

        if [type] == "system-log"

        {

                elasticsearch{

                        hosts => ["192.168.30.41:9200"]

                        index => "system-log-%{+YYYY.MM.dd}"

                        manage_template => true

                }

        }

        if [type] == "es-log"

        {

                elasticsearch{

                        hosts => ["192.168.30.41:9200"]

                        index => "es-log-%{+YYYY.MM.dd}"

                        manage_template => true

                }

        }

        if [type] == "docker-log"

        {

                elasticsearch{

                        hosts => ["192.168.30.41:9200"]

                        index => "docker-log-%{+YYYY.MM.dd}"

                        manage_template => true

                }

        }

        stdout{

                codec => rubydebug

    }

}
5、匹配与合并
input{

        stdin {

                codec => multiline

                        {

                                pattern => "^\[" #匹配这个正则

                                negate => true  #匹配到这个正则后,可以为true或false

                                what => "previous" #和上面这一行合并起来。 还有一个值为next,和下面这一行合并起来.

                        }

                }

}

filter{

}

output{

        stdout{

                codec => rubydebug

        }

}
6、综合后写入es
input{

        file{

        path => ["/var/log/messages","/var/log/secure"]

        type => "system-log"

        start_position => "beginning"

}

        file{

        path => ["/application/elk/elasticsearch/logs/elk-elasticsearch.log"]

        type => "es-log"

        start_position => "beginning"

}

        file{

        path => ["/application/elk/elasticsearch/logs/containers/**/*.log"]

        type => "docker-log"

        start_position => "beginning"

        codec => multiline

                 {

                        pattern => "^\{" #匹配这个正则

                        negate => true  #匹配到这个正则后,可以为true或false

                       what => "previous" #和上面这一行合并起来。 还有一个值为next,和下面这一行合并起来.

                }

}

}

filter{

}

output{

        #elasticsearch plugin

        if [type] == "system-log"

        {

                elasticsearch{

                        hosts => ["192.168.30.41:9200"]

                        index => "system-log-%{+YYYY.MM.dd}"

                        manage_template => true

                }

        }

        if [type] == "es-log"

        {

                elasticsearch{

                        hosts => ["192.168.30.41:9200"]

                        index => "es-log-%{+YYYY.MM.dd}"

                        manage_template => true

                }

        }

        if [type] == "docker-log"

        {

                elasticsearch{
hosts => ["192.168.30.41:9200"]
index => "docker-log-%{+YYYY.MM.dd}"
manage_template => true
}
}
stdout{
codec => rubydebug
}
}
7、收集nginx日志,并转换成json格式输出到es,nginx日志格式见本章 一.6
input{

        file{

        path => ["/var/log/nginx/access_log_json.log"]

        start_position => "beginning"

        codec => "json"

        type => "nginx-log"

}

}

filter{

}

output{

        if [type] == "nginx-log"

        {

                elasticsearch{

                        hosts => ["192.168.30.41:9200"]

                        index => "nginx-log-%{+YYYY.MM.dd}"

                        manage_template => true

                }

        }

        stdout{

                codec => rubydebug

        }

}
8、收集系统日志
input{

        syslog{

        type => "system-syslog"

        port => 514

        }

}

filter{

}

output{

        elasticsearch{

        hosts => ["192.168.30.41:9200"]

        index => "system-syslog-%{+YYYY.MM}"

}

        stdout{

                codec => rubydebug

        }

}
9、收集tcp日志
input{

        tcp{

                type => "tcp"

                port => "6666"

                mode => "server" #还有一个client

}

}

filter{

}

output{

        stdout{

                codec => rubydebug

        }

}
10、filter匹配与筛选字段
input{

        stdin{

                #输入内容为:55.3.244.1 GET /index.html 15824 0.043

                }

}

filter{

  grok {

    match => { "message" => "%{IP:client} %{WORD:method} %{URIPATHPARAM:request} %{NUMBER:bytes} %{NUMBER:duration}" }

  }

}

output{

        stdout{

                codec => rubydebug

        }

}
11、使用logstash自带的匹配规则匹配http日志
input{

        file {

                type => "http-log"

                path => "/var/log/httpd/access_log"

                start_position => beginning

}

}

filter{

        grok {

                match => {"message" => "%{HTTPD_COMBINEDLOG}" }

}

}

output{

        if [type] == "http-log"

        {

                elasticsearch{

                        hosts => ["192.168.30.41:9200"]

                        index => "http-log-%{+YYYY.MM.dd}"

                        manage_template => true

                }

        }

        stdout{

                codec => rubydebug

        }

}
12、获取输入信息到redis
input{

        stdin{}

}

output{

        redis{

                host => "192.168.30.42"

                port => "6379"

                db => "6"

                data_type => "list"

                key => "demo"

}

        stdout{

                codec => rubydebug

        }

}
13、收集http日志到redis
input{

        file {

                type => "http-log"

                path => "/var/log/httpd/access_log"

                start_position => beginning

}

}

output{

        redis{

                host => "192.168.30.42"

                port => "6379"

                db => "6"

                data_type => "list"

                key => "apache-accesslog"

}

        stdout{

                codec => rubydebug

        }

}
14、获取redis日志到es
input{

        redis{

                host => "192.168.30.42"

                port => "6379"

                db => "6"

                data_type => "list"

                key => "apache-accesslog"

}

}

filter{

        grok {

                match => {"message" => "%{HTTPD_COMBINEDLOG}" }

}

}

output{

         elasticsearch{

                        hosts => ["192.168.30.41:9200"]

                        index => "redis-log-%{+YYYY.MM.dd}"

                        manage_template => true

                }

        stdout{

                codec => rubydebug

        }

}
ELK使用3-Logstash的更多相关文章
- ELK初学搭建(logstash)
ELK初学搭建(logstash) elasticsearch logstash kibana ELK初学搭建 logstash 1.环境准备 centos6.8_64 mini IP:192.168 ...
- ELK 架构之 Logstash 和 Filebeat 配置使用(采集过滤)
相关文章: ELK 架构之 Elasticsearch 和 Kibana 安装配置 ELK 架构之 Logstash 和 Filebeat 安装配置 ELK 使用步骤:Spring Boot 日志输出 ...
- ELK(elasticsearch+kibana+logstash)搜索引擎(一): 环境搭建
1.ELK简介 这里简单介绍一下elk架构中的各个组件,关于elk的详细介绍的请自行百度 Elasticsearch是个开源分布式搜索引擎,是整个ELK架构的核心 Logstash可以对数据进行收集. ...
- ELK 性能(1) — Logstash 性能及其替代方案
ELK 性能(1) - Logstash 性能及其替代方案 介绍 当谈及集中日志到 Elasticsearch 时,首先想到的日志传输(log shipper)就是 Logstash.开发者听说过它, ...
- Centos7下使用ELK(Elasticsearch + Logstash + Kibana)搭建日志集中分析平台
日志监控和分析在保障业务稳定运行时,起到了很重要的作用,不过一般情况下日志都分散在各个生产服务器,且开发人员无法登陆生产服务器,这时候就需要一个集中式的日志收集装置,对日志中的关键字进行监控,触发异常 ...
- ELK stack elasticsearch/logstash/kibana 关系和介绍
ELK stack elasticsearch 后续简称ES logstack 简称LS kibana 简称K 日志分析利器 elasticsearch 是索引集群系统 logstash 是日志归集集 ...
- ELK( ElasticSearch+ Logstash+ Kibana)分布式日志系统部署文档
开始在公司实施的小应用,慢慢完善之~~~~~~~~文档制作 了好作运维同事之间的前期普及.. ~~~~~~~~~~~~~~~~~~~~~~~~~~~~~~~ 软件下载地址: https://www.e ...
- ELK 架构之 Logstash 和 Filebeat 安装配置
上一篇:ELK 架构之 Elasticsearch 和 Kibana 安装配置 阅读目录: 1. 环境准备 2. 安装 Logstash 3. 配置 Logstash 4. Logstash 采集的日 ...
- elk快速入门-Logstash
Logstash1.功能:数据输入,数据筛选,数据输出2.特性:数据来源中立性,支持众多数据源:如文件log file,指标,网站服务日志,关系型数据库,redis,mq等产生的数据3.beats:分 ...
- ELK Stack 介绍 & Logstash 日志收集
ELK Stack 组成 Software Description Function E:Elasticsearch Java 程序 存储,查询日志 L:Logstash Java 程序 收集.过滤日 ...
随机推荐
- fpm...failed: Cannot assign requested address
2017年6月23日 16:00:28 星期五 启动fpm的时候总是报错, 看了网上说的修改rlimit值但是不管用 后来发现fpm配置文件监听的地址写错了, 127.0.0.1 写成了 172.0. ...
- ASP.NET MVC5高级编程 之 模型
1. 为MVC Music Store建模 Models文件夹(右击) --> 添加 --> 类 为类添加对应的属性: public class Album { public virtua ...
- PHP中empty,isset,is_null的区别
isset 判断变量是否已存在 empty 判断变量是否为空或为0 is_null 判断变量是否为NULL 仅作为记录使用. 参考链接:http://www.jb51.net/article/6903 ...
- python创建tcp服务端和客户端
1.tcp服务端server from socket import * from time import ctime HOST = '' PORT = 9999 BUFSIZ = 1024 ADDR ...
- __new__方法和pop方法(判断)
new方法(构造方法)是在函数一加载的时候就被执行,在init方法执行之前被执行 def __new__(cls,*args,**kwargs): if kwargs.pop('many',False ...
- C#判断日期是否合法
- mysql5.7设置简单密码报错ERROR 1819 (HY000): Your password does not satisfy the current policy requirements
注:本文来源于< mysql5.7设置简单密码报错ERROR 1819 (HY000): Your password does not satisfy the current policy r ...
- nodejs之koa-router与koa-body搭配使用
简介 koa需要搭配中间件来做接口更方便,使用Koa-body & Koa-router 使用 koa2 创建接口,处理post请求 const koa=require("koa&q ...
- maven添加镜像与常用配置
maven解压后conf文件夹有个 settings.xml 在这个文件中可以配置我们的maven 配置镜像: 找到<mirrors></mirrors>找到这个节点在节点中添 ...
- STL的注意事项
template是一个泛化的:使用template时开始仅仅是声明,具体的例如:k<int> a;叫做实例化显式实例化:类似k<int>a:明确指出哪种类型:隐式实例化:类似k ...