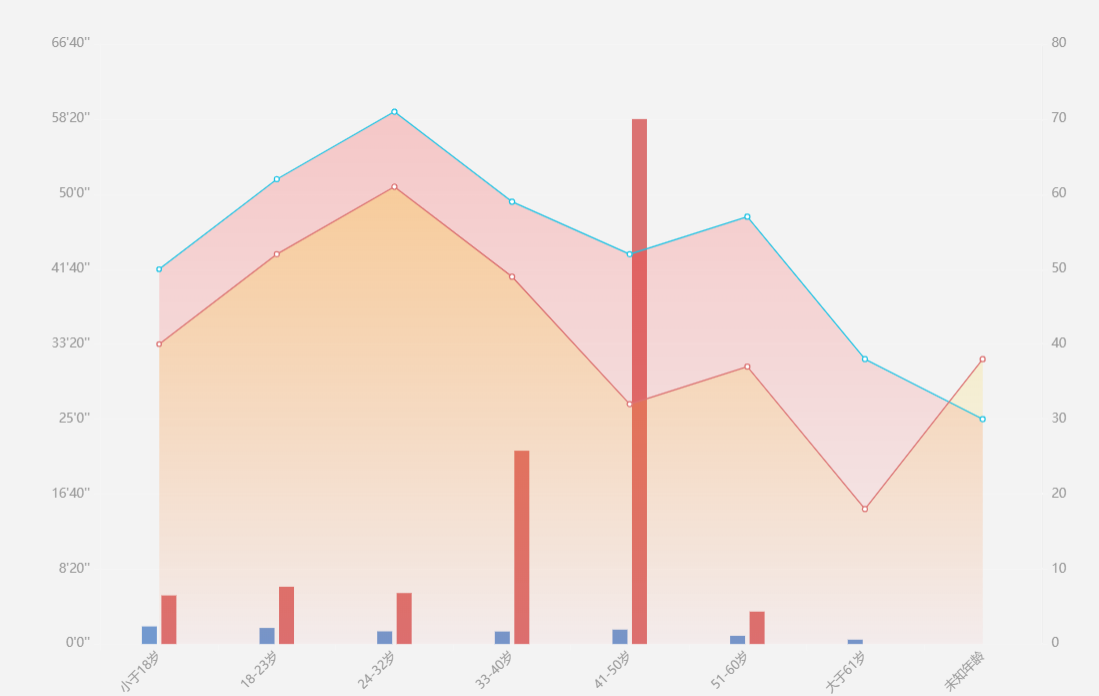
echart 折线渐变 加柱形图结合图形,左右纵轴自设置格式,现行图北京渐变 ,x轴字体倾斜
app.title = '折柱混合';

option = {

 grid: {

    left: '5%',   //距离左边的距离

    right: '5%', //距离右边的距离

    top:'8%',

    bottom:'5%',

    containLabel: true

    },

    tooltip: {

      trigger: 'axis',

      backgroundColor:'rgba(0,0,0,0.75)',

      axisPointer: {

        crossStyle: {

          color: '#999'

        },

        label: {

          backgroundColor: 'rgba(0,0,0,0.75)'

        }

      },

    },

    xAxis: [{

      type: 'category',

      data: ["小于18岁", "18-23岁", "24-32岁", "33-40岁", "41-50岁", "51-60岁", "大于61岁", "未知年龄"],

      axisPointer: {

        type: ''

      },

      axisLine: {

        lineStyle: {

          type: 'solid',

          color: '#f5f5f5',//左边线的颜色

          width:'1'//坐标线的宽度

        }

      },

      axisLabel: {

        interval:0,

        rotate:45,

        textStyle: {

          color:'#999',

          fontSize:'10'

        }

      },

    }],

    yAxis: [

      {

        type: 'value',

        name: '',

        splitNumber :8,

        axisPointer: {

          type: ''

        },

        axisLine: {

          lineStyle: {

            type: 'solid',

            color: '#f5f5f5',//左边线的颜色

            width:'1'//坐标线的宽度

          }

        },

        position:'left',

        splitLine: {

          show:false,

          lineStyle: {

            color: ['#f5f5f5']

          }

        },

        axisLabel: {

          textStyle: {

            color:'#999',

            fontSize:'10'

          },

          formatter: function (value) {

            // var hh = Math.floor(value % 3600 / 60 / 60)

            var mm = Math.floor(value % 3600 / 60);

            var ss = Math.floor(value % 60);

            if(value>3500){

              return mm + 60 + "'" + ss + "''";

            }else{

              return mm + "'" + ss + "''";

            }

          }

        }

      },

      {

        type: 'value',

        name: '',

        splitNumber :8,

        axisPointer: {

          type: ''

        },

        axisLine: {

          show:'false',

          lineStyle: {

            type: 'solid',

            color: '#f5f5f5',//左边线的颜色

            width:'1'//坐标线的宽度

          }

        },

        splitLine: {

          show:'false',

          lineStyle: {

            color: ['#f5f5f5']

          }

        },

        axisLabel: {

          textStyle: {

            color:'#999',

            fontSize:'10'

          },

        }

      }

    ],

    series: [

      {

        name:'男',

        type:'bar',

        data: [117.3005, 107.2594, 84.4112, 83.3266, 95.9611, 54.8313, 29.0411, 0],

        barWidth : 12,

        itemStyle: {

          normal: {

              color:'#7299CF'

          }

        }

      },

      {

        name:'女',

        type:'bar',

        data:[324.082, 382.1394, 340.01627, 1289.3278, 3501.2786, 216.18571, 0, 0],

        barWidth : 12,

        itemStyle: {

          normal: {

              color:'#DB7272'

          }

        }

      },

      {

        name:'男',

        type:'line',

        yAxisIndex: 2,

        symbol:'circle',

        yAxisIndex: 1,

        data:[50, 62, 71, 59, 52, 57, 38, 30],

        itemStyle: {

          normal: {

            color: "#fff",

            borderColor: '#1FC3E4',

            borderWidth: 1,

            lineStyle: {

              color:'#1FC3E4',

              width:1

            }

          },

          emphasis:{

            color:'#1FC3E4',

          }

        },

        areaStyle:{

          normal:{

            opacity:'0.3',

            //颜色渐变函数 前四个参数分别表示四个位置依次为左、下、右、上

              color: new echarts.graphic.LinearGradient(0, 0, 0, 1, [{

                offset: 0,

                color: 'rgba(255,0,0,0.6)'

              },{

                offset: 1,

                color: 'rgba(255,0,0,0.1)'

              }])

          }

        }

      },

      {

        name:'女',

        type:'line',

        yAxisIndex: 1,

        symbol:'circle',

        yAxisIndex: 1,

        data:[40, 52, 61, 49, 32, 37, 18,38],

        itemStyle: {

          normal: {

            color: "#fff",

            borderColor: "#DB7272",

            borderWidth: 1,

            lineStyle: {

              color:"#DB7272",

              width:1

            }

          },

          emphasis:{

            color:"#DB7272",

          }

        },

        areaStyle:{

          normal:{

            opacity:'0.3',

            //颜色渐变函数 前四个参数分别表示四个位置依次为左、下、右、上

              color: new echarts.graphic.LinearGradient(0, 0, 0, 1, [{

                offset: 0,

                color: 'rgba(255,203,0,0.8)'

              },{

                offset: 1,

                color: 'rgba(255,203,0,0)'

              }])

          }

        }

      }

    ]

}
echart 折线渐变 加柱形图结合图形,左右纵轴自设置格式,现行图北京渐变 ,x轴字体倾斜的更多相关文章
- 微信小程序echart 折线图legend不显示的问题
最近使用小程序echart折线图,遇到表头一直不显示问题,查询之后解决方案:
- 现代3D图形编程学习-环境设置
本书系列 现代3D图形编程学习 环境设置 由于本书中的例子,均是基于OpenGL实现的,因此你的工作环境需要能够运行OpenGL,为了读者能够更好的运行原文中的示例,此处简单地介绍了linux和win ...
- HighCharts之2D柱状图、折线图的组合多轴图
HighCharts之2D柱状图.折线图的组合多轴图 1.实例源码 SomeAxis.html: <!DOCTYPE html> <html> <head> < ...
- HighCharts之2D柱状图、折线图的组合双轴图
HighCharts之2D柱状图.折线图的组合双轴图 1.实例源码 DoubleAxis.html: <!DOCTYPE html> <html> <head> & ...
- ajax-json,遇到的一个问题,jquery var ,加载顺序。JS对象,json格式转换。
<!DOCTYPE html> <html lang="en"> <head> <meta charset="UTF-8&quo ...
- Highcharts 3D柱形图;Highcharts 堆叠3D柱形图;Highcharts 3D饼图;Highcharts 3D圆环图
Highcharts 3D柱形图 配置 chart.options3d 配置 以下列出了 3D 图的基本配置,设置 chart 的 type 属性为 column,options3d 选项可设置三维效 ...
- R语言与医学统计图形【5】饼图、条件图
R语言基础绘图系统 基础图形--饼图.克利夫兰点图.条件图 6.饼图 pie(rep(1,26),col=rainbow(26), labels = LETTERS[1:26], #标签 radius ...
- 用echartsjs 实现动态绘制折线、柱状等图形,并实现多图联动效果
echarts对于大数据处理后绘制折线图,柱形图等等的效果和速度都很好.下面我们介绍 怎么把封装的数据列表解析出来,动态绘图,并且实现鼠标联动效果引入js文件: <script type=&qu ...
- echart折线图系列一:折线图基本配置
引入echart插件 页面上准备一个容器:<div id="box" style="height:400px;width: 800px;padding: 20px& ...
随机推荐
- win10 64 位安装 MySQL(mysql-5.7.17-winx64)
版权声明:本文为搜集借鉴各类文章的原创文章,转载请注明出处:http://www.cnblogs.com/2186009311CFF/p/6517470.html. win10 64 位安装 MySQ ...
- leetcode打卡
leetcode刷题打卡 刷题链接 夸夸群 刷题记录链接 期中颜色不一样的,是刷题中遇到问题的,以后需要强化 [x] 6.1 打卡 [x] 6.2 打卡 中间因个人原因没做题,后面慢慢补上 [x] 6 ...
- mysqldump mysql数据库导入导出
syhuo_oauth数据库结构 [root@VM_58_118_centos dbback]# /usr/bin/mysqldump -uroot -P3306 --protocol=tcp --h ...
- java1.8 10大新特性
http://blog.csdn.net/u013598111/article/details/49720867 一.接口的默认方法 Java 8允许我们给接口添加一个非抽象的方法实现,只需要使用 d ...
- React-Native 之 GD (十四)小时风云榜 及 当前时间操作 及 上一小时、下一小时功能实现
1.小时风云榜 GDHourList.js /** * 小时风云榜 */ import React, { Component } from 'react'; import { StyleSheet, ...
- 状压dp(8.8上午)
神马是状态压缩? 就是当普通dp的每一维表示的状态非常少的时候,可以压缩成一维来表示 如果m==8 dp[i][0/1][0/1]......[0/1] 压缩一下 dp[i][s]表示到了第i行,状态 ...
- What is the difference between Kill and Kill -9 command in Unix?
w difference kill -9 pid and kill pid command - Ask Ubuntu https://askubuntu.com/questions/791841/d ...
- HDFS——完全分布式搭建
架构 NN--namenode SNN--secondnamenode DN--datanode hadoop_env.sh中修改JAVA_HOME core-site.xml <propert ...
- delphi自定义事件处理
http://www.cnblogs.com/ywangzi/archive/2012/09/06/2673414.html delphi自定义事件处理 为什么我们点击按钮,就会执行按钮的oncl ...
- javascript实现保留两位小数的多种方法
第一种方法:javascript实现保留两位小数一位自动补零代码实例:第一种方法介绍一下如何实现对数字保留两位小数效果,如果数字的原本小数位数不到两位,那么缺少的就自动补零,这个也是为了统一的效果,先 ...