PhpStorm, XDebug, and DBGp Proxy
phpstorm 利用 xdebug、dbgp-proxy配置远程调试
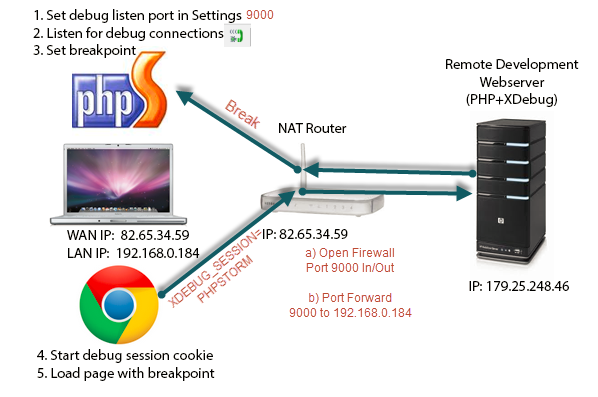
1.单客户机远程调试
a.安装xdebug库文件(windows:php_xdebug.dll;linux:php_xdebug.so)
b.修改php.ini(php源码运行环境)
        ;xdebug库文件

        zend_extension = "d:/wamp/bin/php/php5.3.10/zend_ext/php_xdebug.dll"

        ;开启远程调试

        xdebug.remote_enable = On

        ;客户机ip

        xdebug.remote_host=localhost

        ;客户机xdebug监听端口

        xdebug.remote_port=9000

        xdebug.remote_handler=dbgp

        ;idekey

        xdebug.idekey=PhpStorm

        xdebug.profiler_enable = off

        xdebug.profiler_enable_trigger = off

        xdebug.profiler_output_name = cachegrind.out.%t.%p

        xdebug.profiler_output_dir = "d:/wamp/tmp"
c.客户机(IDE运行环境)
I.配置php程序远程服务,phpstorm:File>Settings>Languages & Frameworks>PHP>Servers
apache服务:其中"use path mappings"用于将本地代码与远程服务主机代码映射,然后跟踪
II.配置xdebug,phpstorm:File>Settings>Languages & Frameworks>PHP>Debug
Debug port:默认9000,与"xdebug.remote_port"一致
III.单击“edit configurations”,选择服务器
IIII.在phpStorm里打开监听,就是一个电话一样的按钮
V.打开debug,就是那个像甲壳虫的小按钮(此操作会打开一个链接然后将连接后的参数XDEBUG_SESSION_START注入到cookie:XDEBUG_SESSION,该值唯一
标示一个ide)
2.多客户机远程调试

a.在远程服务主机上,安装Komodo Remote Debugging(http://code.activestate.com/komodo/remotedebugging/)
输入pydbgpproxy.exe --help,
控制台输出:
-i hostname:port listener port for IDE processes(defaults to '127.0.0.1:9001')
-d hostname:port listener port for debug processes(defaults to '127.0.0.1:9000')
启动pydbgpproxy.exe -i 0.0.0.0:9001 -d 9000
控制台输出:
INFO: dbgp.proxy: starting proxy listeners. appid: 10814
INFO: dbgp.proxy: dbgp listener on 127.0.0.1:9000
INFO: dbgp.proxy: IDE listener on 0.0.0.0:9001
则成功启动
dbgp proxy server监听9000与远程主机服务通信,监听9001与IDE(phpstorm)通信
b.安装xdebug库文件(windows:php_xdebug.dll;linux:php_xdebug.so)
c.修改php.ini(php源码运行环境)
        ;xdebug库文件

        zend_extension = "d:/wamp/bin/php/php5.3.10/zend_ext/php_xdebug.dll"

        ;开启远程调试

        xdebug.remote_enable = On

        ;DBGP PROXY SERVER所在主机ip

        xdebug.remote_host=localhost

        ;DBGP PROXY SERVER监听端口

        xdebug.remote_port=9000

        ;代理

        xdebug.remote_handler=dbgp

        ;此种模式下该项不在起作用,可以取消

        ;xdebug.idekey=PhpStorm

        xdebug.profiler_enable = off

        xdebug.profiler_enable_trigger = off

        xdebug.profiler_output_name = cachegrind.out.%t.%p

        xdebug.profiler_output_dir = "d:/wamp/tmp"
c.客户机(IDE运行环境)
I.配置php程序远程服务,phpstorm:File>Settings>Languages & Frameworks>PHP>Servers
apache服务:其中"use path mappings"用于将本地代码与远程服务主机代码映射,然后跟踪
II.配置xdebug,phpstorm:File>Settings>Languages & Frameworks>PHP>Debug
Debug port:xdebug的监听端口xx(其中xx根据自己选择),listening for connections from 'xdebug'
DBGP Proxy:
IDE Key(IDE的唯一key,一定不要与其他客户机的key相同,否则不能注册)
Host(DBGP Proxy server 的主机ip)
Port(DBGP Proxy server与IDE通信的监听端口,与-i 0.0.0.0:9001里设置一致)
III.将IDE的配置注入到DBGP Proxy server
单击工具栏"Tools",选择"Register IDE"进行注册(若果没有配置IDE,可以选择"configurations"进行配置,然后注册)
IIII.单击"edit configurations",选择服务器
V.在phpStorm里打开监听,就是一个电话一样的按钮
VI.打开debug,就是那个像甲壳虫的小按钮(此操作会打开一个链接然后将连接后的参数XDEBUG_SESSION_START注入到cookie:XDEBUG_SESSION,该值唯一
标示一个ide),将XDEBUG_SESSION_START参数值修改为IDE Key
参见:http://matthardy.net/blog/configuring-phpstorm-xdebug-dbgp-proxy-settings-remote-debugging-multiple-users/
http://wenku.baidu.com/link?url=ppL0e290lQSjle8jkI3Apaqvi5yYkv_kuSxl6SYnvwZFWPVMemRl8NrLO_QKmm6Kunn1JBmMmBLs5I4IL5yW5ixI2KQ0mFmcr1hL9uyIgq3
Komodo Remote Debugging
PhpStorm, XDebug, and DBGp Proxy的更多相关文章
- phpstorm xdebug
xdebug安装 https://xdebug.org/wizard.php http://blog.csdn.net/zhyh1986/article/details/45172685 http:/ ...
- PhpStorm/Xdebug安装使用
安装环境:XAMPP;phpStorm版本10; windows 7 64bit. XAMPP.phpStorm 都直接安装在了D盘根目录,9999m目录建在D:\xampp\htocts下,即目录工 ...
- php+phpStorm+xdebug配置方法
1.下载xdebug文件 http://xdebug.org/wizard.php 将phpinfo()的源代码复制到文本框中,xdebug会提示如何配置和下载哪个版本的xdebug. 全部下载地址: ...
- XAMPP PHPSTORM XDEBUG 配合使用
1.xdebug 配置 安装完xampp 进入 php.ini [XDebug]zend_extension = "C:\xampp\php\ext\php_xdebug.dll" ...
- PHPStorm+XDebug进行调试图文教程以及解析wamp的php.ini设置不生效的原因
这篇文章主要为大家详细介绍了PHPStorm+XDebug进行调试图文教程,内容很丰富,具有一定的参考价值,感兴趣的小伙伴们可以参考一下 笔者的开发环境如下:Windows8.1+Apache+P ...
- XAMPP环境下用phpStorm+XDebug进行断点调试的配置
具体过程: 服务器端(本地调试的情况下就是在本机)安装好XAMPP,停止apache服务(注意,如果直接退出XAMPP,是不会停止apache的) 在安装目录下找到php.ini,类似于D:\xamp ...
- phpStorm+XDebug+chrome 配置
运行环境: phpStorm 10.0.1 PHP 5.6.24 VC11 x86 Thread Safe Xdebug 2.4.1(PHP 5.6 VC11 TS (32 bit) 1. PHP安装 ...
- PhpStorm+xdebug+postman调试
PhpStorm+xdebug+postman调试 写PHP时,一直用postman做测试,最近发现在测试过程中可以用xdebug来断点调试,比原来手动打exit或者die来断点效率高多了. 下面记录 ...
- macOS 下 PHPStorm + Xdebug 调试 Docker 环境中的代码
0x00 描述 宿主机是 mac mini,构建的项目在 docker 中,所以需要在 PHPStorm 上配置 Xdebug 进行远程代码调试. 0x01 环境 宿主机:macOS High Sie ...
随机推荐
- [Papers]NSE, $\n u_3$, Lebesgue space, [Pokorny, EJDE, 2003; Zhou, MAA, 2002]
$$\bex \n u_3\in L^p(0,T;L^q(\bbR^3)),\quad \frac{2}{p}+\frac{3}{q}=\frac{3}{2},\quad 2\leq q\leq \i ...
- Selenium2Library系列 keywords 之 _SelectElementKeywords 之 get_selected_list_values(self, locator)
def get_selected_list_values(self, locator): """Returns the values of selected elemen ...
- EF6 Database First (DbContext) - Change Schema at runtime
Problem:There are two SQL databases (dev and live) with on Azure which has identical table structure ...
- Windows下使用NCL(Cygwin模拟Linux环境)
参考自:http://bbs.lasg.ac.cn/bbs/thread-37043-1-1.html 1.下载 所需文件均可在此下载:http://yunpan.cn/cQsvAEe3Axs2Z ...
- Config配置文件详解
(默认的配置设置)以下所有的代码都应该位于 <configuration> <system.web> 和 </system.web> </configurat ...
- BBED的安装
BBED是Block Browser EDitor的缩写,只有linux/unix版本,没有windows版本. 11g中默认是不带bbed的,如果要使用,可以在10g中拷贝过来,然后再进行编译使用. ...
- web服务器分析与设计(五)--一些总结
随着年龄与经验的增加,对于软件方面的分析与设计也会有一些新的认识.下面做个近期的总结: 1,关于到底用不用作设计的问题: 在最近两个公司,原有人马是不会作设计(我自己的感觉),也察觉不到作设计的任何冲 ...
- CoffeeScript学习(1)——Quick Start
什么是CoffeeScript CoffeeScript 是一门编译到 JavaScript 的小巧语言. 在 Java 般笨拙的外表下, JavaScript 其实有着一颗华丽的心脏. Coffee ...
- Xshell异常断开
这可能是由于 SSH 超时断开连接 导致的!可以这样做...修改/etc/ssh/sshd_config文件,找到 ClientAliveInterval 0和ClientAliveCountMax ...
- Gym 100507D Zhenya moves from the dormitory (模拟)
Zhenya moves from the dormitory 题目链接: http://acm.hust.edu.cn/vjudge/contest/126546#problem/D Descrip ...