
debug kibana in chrome
kibana5.6.5版本
在kibana根目录运行命令:NODE_OPTIONS='--inspect --debug' npm start
也可以尝试命令:NODE_OPTIONS="--debug-brk --inspect' npm start
npm start 可替换为 ./bin/kibana 或 ${project_dir}/src/cli
最后一个端口为5860的url
下面是命令执行后的日志:
caocy@ubuntu1:~/workspace/kibana-5.6.5$ NODE_OPTIONS='--inspect --debug' npm start

> kibana@5.6.5 start /home/caocy/workspace/kibana-5.6.5

> sh ./bin/kibana --dev

Debugger listening on port 9229.

Warning: This is an experimental feature and could change at any time.

To start debugging, open the following URL in Chrome:

    chrome-devtools://devtools/remote/serve_file/@60cd6e859b9f557d2312f5bf532f6aec5f284980/inspector.html?experiments=true&v8only=true&ws=127.0.0.1:9229/32809f53-3135-4523-9a5c-e5d36770bba0

 watching for changes  (407 files)

Debugger listening on port 5859.

Warning: This is an experimental feature and could change at any time.

To start debugging, open the following URL in Chrome:

    chrome-devtools://devtools/remote/serve_file/@60cd6e859b9f557d2312f5bf532f6aec5f284980/inspector.html?experiments=true&v8only=true&ws=127.0.0.1:5859/7877c417-38a6-470c-9b2e-77428acff5bf

Debugger listening on port 5860.

Warning: This is an experimental feature and could change at any time.

To start debugging, open the following URL in Chrome:

    chrome-devtools://devtools/remote/serve_file/@60cd6e859b9f557d2312f5bf532f6aec5f284980/inspector.html?experiments=true&v8only=true&ws=127.0.0.1:5860/1b36300a-30dd-4909-96f1-750c3fb8f7eb

  log   [04:08:49.225] [info][listening] basePath Proxy running at https://0.0.0.0:5701/dhe

optmzr    log   [04:08:53.402] [info][status][ui settings] Status changed from uninitialized to disabled - uiSettings.enabled config is set to `false`

optmzr    log   [04:08:54.713] [info][optimize] Lazy optimization of bundles for kibana, stateSessionStorageRedirect, timelion, sense-tests and status_page ready

server    log   [04:08:54.747] [info][optimize] Waiting for optimizer completion

optmzr    log   [04:08:54.771] [info][optimize] Lazy optimization started

optmzr    log   [04:08:54.801] [info] Plugin initialization disabled.

server    log   [04:08:54.885] [info][status][plugin:kibana@5.6.5] Status changed from uninitialized to green - Ready

server    log   [04:08:55.139] [info][status][plugin:elasticsearch@5.6.5] Status changed from uninitialized to yellow - Waiting for Elasticsearch

server    log   [04:08:55.220] [info][status][plugin:console@5.6.5] Status changed from uninitialized to green - Ready

server    log   [04:08:55.294] [info][status][plugin:metrics@5.6.5] Status changed from uninitialized to green - Ready

server    log   [04:08:55.341] [info][status][plugin:elasticsearch@5.6.5] Status changed from yellow to green - Kibana index ready

server    log   [04:08:55.871] [info][status][plugin:timelion@5.6.5] Status changed from uninitialized to green - Ready

server    log   [04:08:55.880] [info][listening] Server running at https://0.0.0.0:5603

server    log   [04:08:55.883] [info][status][ui settings] Status changed from uninitialized to green - Ready

optmzr    log   [04:09:49.859] [info][optimize] Lazy optimization success in 55.08 seconds
Debugging Node.js with Chrome DevTools:
Support for Node.js debuggability landed in Node.js in 2016. Here’s how to get up and running. (Post updated Jan 2018)
1. Download and install the current version of node. (v6.3.0+ required)
2. Run node with the --inspect flag:
▸ node --inspect index.js
# Break on the first statement of the script with --inspect-brk
▸ node --inspect-brk index.js
(In Node 6, you have to use --inspect --debug-brk for this inspect & pseudo-breakpoint combo.)
Next, you used to open the big chrome-devtools:// URL it spits out, but don’t. Now there’s a better way…
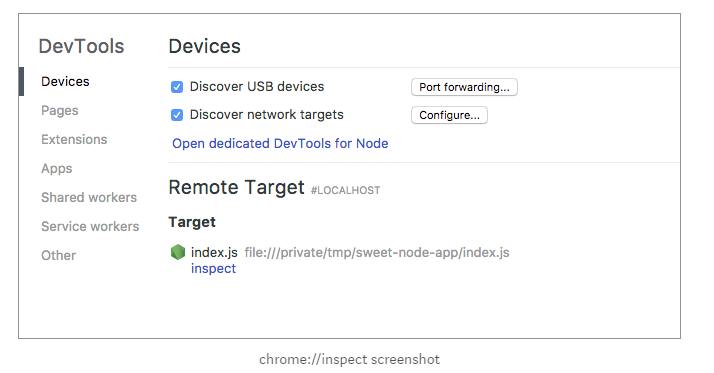
3. Open about:inspect in Chrome
It’ll redirect you to chrome://inspect quickly and you’ll see something like:
set targets:
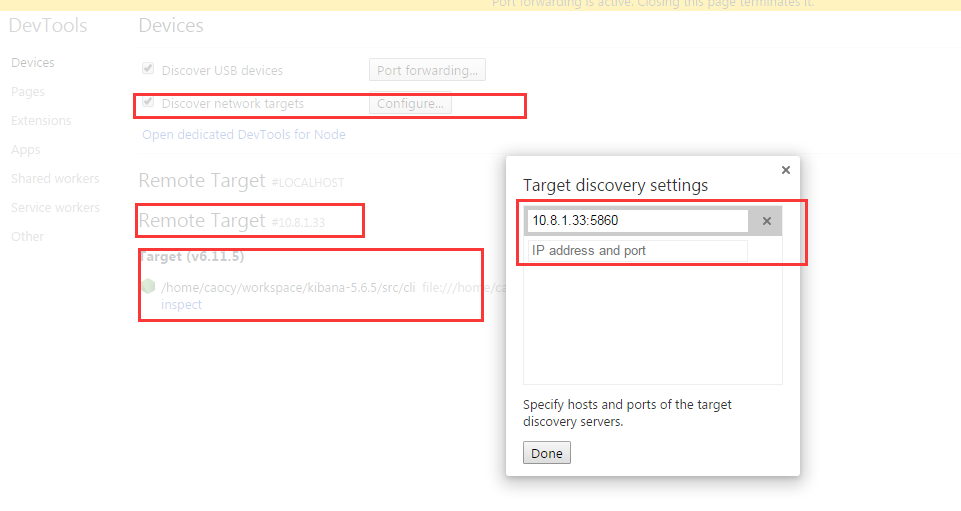
4. Click the Open dedicated DevTools for Node link.
You’ll get a popup window for debugging your node session.
But better than that, when you kill and restart node, the window will automatically reconnect to it.
debug kibana in chrome的更多相关文章
- 强制开启android webview debug模式使用Chrome inspect
强制开启android webview debug模式使用Chrome inspect https://blog.csdn.net/zhulin2609/article/details/5143782 ...
- Chrome开发者工具Debug入门
译者按: 手把手教你摆脱console.log,掌握高级的debug方法. 原文: Learn How To Debug JavaScript with Chrome DevTools 译者: Fun ...
- chrome extensions & debug
chrome extensions & debug debug background.js debug popup.js debug content_script.js chrome.stor ...
- How to debug Typescript in browser
How to debug typescript, In Chrome, we need to press F12, open settings, uncheck the Enable JavaScri ...
- Chrome 实用调试技巧
Chrome 实用调试技巧 2016-07-23 如今Chrome浏览器无疑是最受前端青睐的工具,原因除了界面简洁.大量的应用插件,良好的代码规范支持.强大的V8解释器之外,还因为Chrome开发者工 ...
- [chrome-debug]如何使用chrome调试你的移动设备
### usb debug by remote chrome ### https://developer.chrome.com/devtools/docs/remote-debugging ### c ...
- Chrome实用调试技巧
如今Chrome浏览器无疑是最受前端青睐的工具,原因除了界面简洁.大量的应用插件,良好的代码规范支持.强大的V8解释器之外,还因为Chrome开发者工具提供了大量的便捷功能,方便我们前端调试代码,我们 ...
- Chrome 编译错误汇总
由于各种你懂的原因,訪问google的服务总是出错,先是hosts不工作.代理也不好使,最后最终能够短暂訪问了.我的版本号还是採用svn维护的,直接svn update也不行.试试git吧,一晚上才下 ...
- .NET WEB程序员需要掌握的技能
本来这个是我给我们公司入职的新人做一个参考,由于 @张善友 老师在他的微信号转了我的这篇文章<<.Net WEB 程序员需要掌握的技能>>,很多人觉得比较有用,说是看了后知道一 ...
随机推荐
- 时间操作(struct tm、time_t)求指定日期 前n天的日期
1.在标准C/C++中,我们可通过tm结构来获得日期和时间,tm结构在time.h中的定义如下: #ifndef _TM_DEFINED struct tm { int tm_sec; /* 秒–取值 ...
- jquery 中json数组的操作(转)
在jquery中处理JSON数组的情况中遍历用到的比较多,但是用添加移除这些好像不是太多. 今天试过json[i].remove(),json.remove(i)之后都不行,看网页的DOM对象中好像J ...
- 使用什么工具连接MySQL Server
字符界面:命令行终端(需MySQL Client) GUI界面:Navicat.MySQL Workbench 开发语言:使用相应语言的MySQL数据库驱动包或模块连接MySQL 我一般用的是命令行, ...
- SVN版本冲突,导致出现Files 的值“ < < < < < < < .mine”无效。路径中具有非法字符。
SVN版本冲突,导致出现Files 的值“ < < < < < < < .mine”无效.路径中具有非法字符. 右键编辑.... 打开并删除含有'<&l ...
- LoadRunner 调用dll方法
本文主要介绍简单DLL的编写方法及在LoadRunner中局部调用与全局调用DLL方法. 1.动态链接库的编写 在Visual C++6.0开发环境下,打开FileNewProject选项,可以选择W ...
- Java------遍历Map<k,v>的方法
1. public class MapAction extends ActionSupport{ private Map<String, User> map = new HashMap&l ...
- [笔试题]MS 2014
http://blog.csdn.net/xiaoerlyl/article/details/12126807 别人写的答案: http://blog.csdn.net/zhou2214/articl ...
- MongoDB启动报错
启动mongodb的时候报错: [root@localhost bin]# ./mongod --dbpath /usr/java/mongoNode/data/db --logpath /usr/j ...
- Can't connect to local MySQL server through socket '/var/lib/mysql/mysql.sock'
MySQL在linux安装之后,连接到服务,报了下面的错误: ERROR 2002 (HY000): Can't connect to local MySQL server through socke ...
- laravel框架容器管理的一些要点
本文面向php语言的laravel框架的用户,介绍一些laravel框架里面容器管理方面的使用要点.文章很长,但是内容应该很有用,希望有需要的朋友能看到.php经验有限,不到位的地方,欢迎帮忙指正. ...