
Notes : <Hands-on ML with Sklearn & TF> Chapter 1
<Hands-on ML with Sklearn & TF> Chapter 1
- what is ml
- from experience E with respect to some task T and some performance measure P, if its performance on T, as measured by P, improves with experience E.
- what problems to solve
- exist solution but a lot of hand-tuning/rules
- no good solutions using a traditional approach
- fluctuating environment
- get insight about conplex problem and large data
- type
- whether or not trained with human supervision(supervised, unsupervised, semisupervised, reinforcement)
- whether or not learn incrementally on the fly(online, batch)
- whether or not work by simply comparing new data point vs know data point,or instance detect pattern in training data and build a prediction model(instace-based, model-based)
- (un)supervision learning
- supervision : include the desired solution called labels
- classification,K-Nearest Neighbors, Linear Regression, Logistic Regression, SVM, Decision Trees, Random Forests, Neural network
- unsupervision : without labels
- Clustering : k-means, HCA, ecpectation maximization
- Viualization and dimensionality reducation : PCA, kernal PCA, LLE, t-SNE
- Association rule learning : Apriori, Eclat
- semisupervision
- unsupervision --> supervision
- reinforcement : an agent in context
- observe the environment
- select and perform action
- get rewards in return
- supervision : include the desired solution called labels
- batch/online learning
- batch : offline, to known new data need to train a new version from scratch one the full dataset
- online : incremental learning : challenge is bad data
- instance-based/model-based
- instance-based : the system learns the examples by heart, then the generalizes to the new cases using a similarity measure
- model-based : studied the data; select a model; train it on the training data; applied the model to make predictions on new cases
- Challenge
- insufficient quantity of training data
- nonrepresentative training data
- poor-quality data
- irrelevant features : feature selection; feature extraction; creating new feature by gathering new data
- overfitting : regularization -> hyperparameter
- underfitting : powerful model; better feature; reduce construct
- Testing and Validating
- 80% of data for training 20% for testing
- validating : best model and hyperparameter for training set unliking perform as well on new data
- train multiple models with various hyperparameters using training data
- to get generatlization error , select the model and hyperparamaters that perform best on the validation set
- cross-validating : the training set is split into complementary subsets, ans each model is trained against a different conbination of thse subsets and validated against the remain parts.
Example 1-1:
import matplotlib

import matplotlib.pyplot as plt

import numpy as np

import pandas as pd

import sklearn.linear_model

#load the data

oecd_bli = pd.read_csv("datasets/lifesat/oecd_bli_2015.csv",thousands=',')

gdp_per_capita = pd.read_csv("datasets/lifesat/gdp_per_capita.csv",thousands=',',delimiter='\t',encoding='latin1',na_values='n/a')

#prepare the data

def prepare_country_stats(oecd_bli, gdp_per_capita):

    #get the pandas dataframe of GDP per capita and Life satisfaction

    oecd_bli = oecd_bli[oecd_bli["INEQUALITY"]=="TOT"]

    oecd_bli = oecd_bli.pivot(index="Country", columns="Indicator", values="Value")

    gdp_per_capita.rename(columns={"": "GDP per capita"}, inplace=True)

    gdp_per_capita.set_index("Country", inplace=True)

    full_country_stats = pd.merge(left=oecd_bli, right=gdp_per_capita, left_index=True, right_index=True)

    return full_country_stats[["GDP per capita", 'Life satisfaction']]

country_stats = prepare_country_stats(oecd_bli, gdp_per_capita)
#regularization remove_indices = [0, 1, 6, 8, 33, 34, 35]

country_stats.to_csv('country_stats.csv',encoding='utf-8')

X = np.c_[country_stats["GDP per capita"]]

Y = np.c_[country_stats["Life satisfaction"]]

#Visualize the data

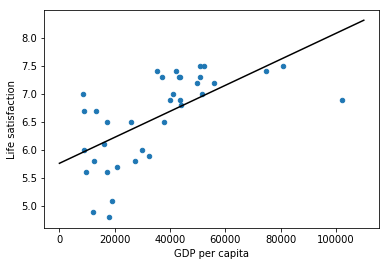
country_stats.plot(kind='scatter',x='GDP per capita',y='Life satisfaction')

#Select a linear model

lin_reg_model = sklearn.linear_model.LinearRegression()

#Train the model

lin_reg_model.fit(X, Y)

#plot Regression model

t0, t1 = lin_reg_model.intercept_[0], lin_reg_model.coef_[0][0]

X = np.linspace(0, 110000, 1000)

plt.plot(X, t0 + t1 * X, "k")

plt.show()

#Make a prediction for Cyprus

X_new=[[22587]]

print(lin_reg_model.predict(X_new))
课后练习挺好的
Notes : <Hands-on ML with Sklearn & TF> Chapter 1的更多相关文章
- Notes : <Hands-on ML with Sklearn & TF> Chapter 5
.caret, .dropup > .btn > .caret { border-top-color: #000 !important; } .label { border: 1px so ...
- Notes : <Hands-on ML with Sklearn & TF> Chapter 7
.caret, .dropup > .btn > .caret { border-top-color: #000 !important; } .label { border: 1px so ...
- Notes : <Hands-on ML with Sklearn & TF> Chapter 6
.caret, .dropup > .btn > .caret { border-top-color: #000 !important; } .label { border: 1px so ...
- Notes : <Hands-on ML with Sklearn & TF> Chapter 4
.caret, .dropup > .btn > .caret { border-top-color: #000 !important; } .label { border: 1px so ...
- Notes : <Hands-on ML with Sklearn & TF> Chapter 3
Chapter 3-Classification .caret, .dropup > .btn > .caret { border-top-color: #000 !important; ...
- Book : <Hands-on ML with Sklearn & TF> pdf/epub
非常好的书,最近发现了pdf版本,链接:http://www.finelybook.com/hands-on-machine-learning-with-scikit-learn-and-tensor ...
- H5 Notes:PostMessage Cross-Origin Communication
Javascript中要实现跨域通信,主要有window.name,jsonp,document.domain,cors等方法.不过在H5中有一种新的方法postMessage可以安全实现跨域通信,并 ...
- H5 Notes:Navigator Geolocation
H5的地理位置API可以帮助我们来获取用户的地理位置,经纬度.海拔等,因此我们可以利用该API做天气应用.地图服务等. Geolocation对象是我们获取地理位置用到的对象. 首先判断浏览器是否支持 ...
- notes:spm多重比较校正
SPM做完统计后,statistical table中的FDRc实际上是在该p-uncorrected下,可以令FDR-correcred p<=0.05的最小cluster中的voxel数目: ...
随机推荐
- 在consul上注册web服务
1. 创建web服务 IDEA->File->New->Project->Empty Project,project name取名provider,点击finish 2. 创建 ...
- python数据分析库pandas
在我看来,对于Numpy以及Matplotlib,Pandas可以帮助创建一个非常牢固的用于数据挖掘与分析的基础.而Scipy(会在接下来的帖子中提及)当然是另一个主要的也十分出色的科学计算库,但是我 ...
- 学习笔记:FIS3
http://fis.baidu.com/ FIS3官网 [配环境]: 1.先要安装node.js https://nodejs.org/en/ NODE.js官网(下载这个,下载后运行: http ...
- Spring MVC 之 请求url 带后缀的情况
RequestMappingInfoHandlerMapping 在处理http请求的时候, 如果 请求url 有后缀,如果找不到精确匹配的那个@RequestMapping方法.那么,就把后缀去掉, ...
- python3中一句话定义函数
import math as marea=lambda r:r**2*m.pi #定义一个计算圆的面积的函数area(8) 显示结果 201.06192982974676
- myeclipse和jdk的安装和配置
一.安装JDK 1.下载得到jdk-8u11-windows-i586.1406279697.exe,直接双击运行安装,一直next就可以,默认是安装到系统盘下面Program Files,我这里装在 ...
- sqlserver float小数存数据库变成多位了 比如说12.23存进去变成 12.229999998 甚至更长
使用 numeric(12,2)的数据类型,或者decimal(12,2) 追问 不能随意修改表结构 有别人办法么 程序上控制的 追答 那你就不用管他了,所谓 浮点数,必然是这么存储的.
- 尚硅谷springboot学习30-docker安装mysql示例
docker pull mysql 错误的启动示例 错误日志:需要设置密码 正确的启动 但还不能直接使用,因为没有做端口映射,外界无法连接 可用的启动 连接成功 几个高级的操作 指定配置文件 dock ...
- jQuery.extend 与 jQuery.fn.extend
extend方法为jQuery对象的核心之一,语法如下: jQuery.extend([deep], target, object1, [objectN]),返回值Object. 概述:用一个或多个其 ...
- CSS 表单
输入框前有图片 老板让你实现在输入框前有图片的功能.老板觉得用图片代替文字更有说服力. 要实现这样的功能很简单,它的原理是将图片放在内边距内. 代码 1 2 3 4 5 6 7 8 9 10 11 1 ...