
Embedding Python in C
http://codextechnicanum.blogspot.com/2013/12/embedding-python-in-c-converting-c.html

//Make some vectors containing the data

     static const double xarr[] = {1,2,3,4,5,6,7,8,9,10,11,12,13,14};

     std::vector<double> xvec (xarr, xarr + sizeof(xarr) / sizeof(xarr[0]) );

     static const double yarr[] = {0,0,1,1,0,0,2,2,0,0,1,1,0,0};

     std::vector<double> yvec (yarr, yarr + sizeof(yarr) / sizeof(yarr[0]) );

     //Transfer the C++ vector to a python tuple

     pXVec = PyTuple_New(xvec.size());

     for (i = 0; i < xvec.size(); ++i) {

          pValue = PyFloat_FromDouble(xvec[i]);

          if (!pValue) {

               Py_DECREF(pXVec);

               Py_DECREF(pModule);

               fprintf(stderr, "Cannot convert array value\n");

               return 1;

          }

          PyTuple_SetItem(pXVec, i, pValue);

     }

     //Transfer the other C++ vector to a python tuple

     pYVec = PyTuple_New(yvec.size());

     for (i = 0; i < yvec.size(); ++i) {

          pValue = PyFloat_FromDouble(yvec[i]);

          if (!pValue) {

               Py_DECREF(pYVec);

               Py_DECREF(pModule);

               fprintf(stderr, "Cannot convert array value\n");

               return 1;

          }

          PyTuple_SetItem(pYVec, i, pValue); //

     }

     //Set the argument tuple to contain the two input tuples

     PyTuple_SetItem(pArgTuple, 0, pXVec);

     PyTuple_SetItem(pArgTuple, 1, pYVec);

     //Call the python function

     pValue = PyObject_CallObject(pFunc, pArgTuple);
Here's the entire .py file:
def plotStdVectors(x, y):

    import numpy as np

    import matplotlib.pyplot as plt

    print "Printing from Python in plotStdVectors()"

    print x

    print y

    x = np.fromiter(x, dtype = np.float)

    y = np.fromiter(y, dtype = np.float)

    print x

    print y

    plt.plot(x, y)

    plt.show()

    return 0
And, after compiling with the Makefile (which is for Ubuntu 12.10 using the system's default Python installation), can be run with:
$ ./testEmbed pythonToEmbed plotStdVectors

Hello from main

Hello from runPython()

Printing from Python in plotStdVectors()

(1.0, 2.0, 3.0, 4.0, 5.0, 6.0, 7.0, 8.0, 9.0, 10.0, 11.0, 12.0, 13.0, 14.0)

(0.0, 0.0, 1.0, 1.0, 0.0, 0.0, 2.0, 2.0, 0.0, 0.0, 1.0, 1.0, 0.0, 0.0)

[  1.   2.   3.   4.   5.   6.   7.   8.   9.  10.  11.  12.  13.  14.]

[ 0.  0.  1.  1.  0.  0.  2.  2.  0.  0.  1.  1.  0.  0.]

Result of call: 0

Program finished
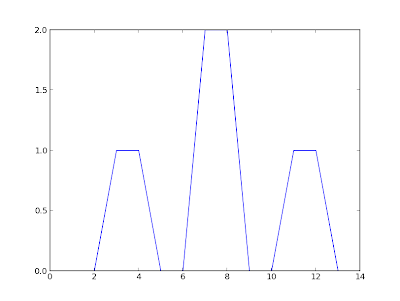
And the plot:
Real Time Plotting with C/C++ and python

Concepts:

Standard input/output (Think: the input and output of your program)

Unix Pipes

Plotting with matplotlib

So, you have your code working, but you are tired of having to run a separate program to see plots? There are many simple solutions, but I am going to present what I think is the absolute simplest. What we are going to do is have your C/C++ program output the data and have python capture it and save plots in real-time! What does this entail? Well...

Your C/C++ program no longer writes to a file (using fprintf), but rather writes to the standard output (STDIN, using simply printf)

Your python script will now read data straight from STDIN using raw_input()

You will have to use a unix shell to sew all of this together

Let's look at a very simple example. Suppose we have a very important C program that outputs some very important numbers. In order for it to work with this new standard, we have it output the data to screen. Namely, it does:

makedata.c

#include <stdio.h>

#include <math.h>

#define PI 3.14159

int main()

{

  int i,j;

  for(j=; j<; j++) {

    for(i=; i<; i++) {

      printf("%f\t",sinf(i * PI / 10.0 + j*PI/));

    }

    printf("\n");

  }

  return ;

}

Now, when we run this, we get a bunch of numbers thrown to screen!

$ gcc -lm -o makedata makedata.c

$ ./makedata

0.000000 0.309017 0.587785 0.809017 0.951056 1.000000 0.951057 0.809018 0.587787 0.309019 0.000003 -0.309014 -0.587783 -0.809015 -0.951055 -1.000000 -0.951058 -0.809020 -0.587789 -0.309022

0.309017 0.587785 0.809017 0.951056 1.000000 0.951057 0.809018 0.587787 0.309019 0.000003 -0.309014 -0.587783 -0.809015 -0.951055 -1.000000 -0.951058 -0.809020 -0.587789 -0.309022 -0.000005

0.587785 0.809017 0.951056 1.000000 0.951057 0.809018 0.587787 0.309019 0.000003 -0.309014 -0.587783 -0.809015 -0.951055 -1.000000 -0.951058 -0.809020 -0.587789 -0.309022 -0.000005 0.309012

0.809017 0.951056 1.000000 0.951057 0.809018 0.587787 0.309019 0.000003 -0.309014 -0.587783 -0.809015 -0.951055 -1.000000 -0.951058 -0.809020 -0.587789 -0.309022 -0.000005 0.309012 0.587781

0.951056 1.000000 0.951057 0.809018 0.587787 0.309019 0.000003 -0.309014 -0.587783 -0.809015 -0.951055 -1.000000 -0.951058 -0.809020 -0.587789 -0.309022 -0.000005 0.309012 0.587781 0.809013

1.000000 0.951057 0.809018 0.587787 0.309019 0.000003 -0.309014 -0.587783 -0.809015 -0.951055 -1.000000 -0.951058 -0.809020 -0.587789 -0.309022 -0.000005 0.309012 0.587781 0.809013 0.951055

0.951057 0.809018 0.587787 0.309019 0.000003 -0.309014 -0.587783 -0.809015 -0.951055 -1.000000 -0.951058 -0.809020 -0.587789 -0.309022 -0.000005 0.309012 0.587781 0.809013 0.951055 1.000000

0.809018 0.587787 0.309019 0.000003 -0.309014 -0.587783 -0.809015 -0.951055 -1.000000 -0.951058 -0.809020 -0.587789 -0.309022 -0.000005 0.309012 0.587781 0.809013 0.951055 1.000000 0.951059

0.587787 0.309019 0.000003 -0.309014 -0.587783 -0.809015 -0.951055 -1.000000 -0.951058 -0.809020 -0.587789 -0.309022 -0.000005 0.309012 0.587781 0.809013 0.951055 1.000000 0.951059 0.809021

0.309019 0.000003 -0.309014 -0.587783 -0.809015 -0.951055 -1.000000 -0.951058 -0.809020 -0.587789 -0.309022 -0.000005 0.309012 0.587781 0.809013 0.951055 1.000000 0.951059 0.809021 0.587792

In order to capture the data in python, we must use the raw_input() function. This function simply gets input from the user and puts it into a variable. It puts everything the user types up to when they press enter. This is why the C code is that it only prints a newline (ie: '\n') once one full line of data has been outputted to screen. If we had put a newline in the first printf statement, the python plotting program would only plot one number at a time! So, you can think of the tab (\t) as deliniating between values and the newline (\n) deliniating between different sets of data. The python code that reads this data looks like:

plot.py

import numpy as np

import pylab as py

def plot_data(data):

  py.clf()

  py.plot(data)

  py.show()

  py.savefig("data-%.8d.png"%counter)

if __name__ == "__main__":

  counter =

  while True:

    try:

      tmp = raw_input().strip().split()

      data = np.array(tmp, dtype=np.double)

    except EOFError:

      print "Input has terminated! Exiting"

      exit()

    except ValueError:

      print "Invalid input, skipping.  Input was: %s"%tmp

      continue

    print "Plotting plot number %d"%counter

    plot_data(data)

    counter +=

You can test this program by running it, typing a bunch of numbers separated by a space, then pressing enter. It will plot it, display it and save it! Then, the program will ask you again for more numbers. To exit, you type Control-D which makes the EOFError happen.

What is going on in this program is quite simple. First, "tmp" gets the long string of characters that you typed in. However, python doesn't know it contains numbers, it just looks like a bunch of random characters! Now, we use numpy and tell it to create an array out of the data. The "dtype=np.double" is us telling numpy that we are realing with valid numbers. A ValueError happens if we weren't good on our promise and the input isn't in fact all numbers.

Now for the most important part... how do we put these two things together? Unix has a very cool thing called input/output redirection. This allows us to redirect the output of one program to the input of another. So, instead of us having to type in the numbers for the python script, we can have the C/C++ program type it for us! The syntax is quite simple, all you have to do is:

$ ./makedata | python plot.py

And now you are done! You should have a bunch of plots coming up of sin waves with various phases. Congrats!

There is one more thing you can do to make your plots even more fancy. Sometimes, you don't want to save each figure or have to click through to see every plot, one at a time. Instead, you just want to see an animation of what is happening as it is happening! Or, you are already making an animation with many py.plot() statements, and you want it to be smoother and faster! To do this, you can to look into pylab animations. The people at scipy have a great tutorial on this issue. You can also look at a small plotting script I made which does something very similar.

The basics of this method involve: creating your plots at the beginning of your script, and saving them into variables. Then, when you get new data that you want to plot, you simply change the data in the plot with .set_data(). One thing to note is the line "py.ion()" right after I imported pylab and how I use py.draw() instead of py.show(). If you want to get started playing around with this, simply take the same code from earlier in this document, add "py.ion()" after we import pylab, delete the py.savefig() line and replace py.show() with py.draw()! This will give you a (quite slow) animation.
DECREF
http://stackoverflow.com/questions/6977161/where-should-i-put-py-incref-and-py-decref-on-this-block-in-python-c-extension
The objects you create with PyInt_FromLong() and you add to the list should be kept in a local variable.
The reason are the ownership rules: PyInt_FromLong() generates a reference that you own. In the call to PyTuple_SetItem(), you lose this ownership again, because PyTuple_SetItem() "steals" it from you, so you don't have to care about. But PyList_Append() doesn't do so, it increases the refcount. In order to have the object GC'ed correctly, you have to release your ownership by DECREF'ing.
So, instead of PyList_Append(item, PyInt_FromLong(jp)), you do the following:
PyObject * jpo = PyInt_FromLong(jp);

// do some error checking here

PyList_Append(item, jpo);

Py_DECREF(jpo);
boost.python
https://www.youtube.com/watch?v=GE8EsGUsC2w
python c api
pyerr_setstring
boost
register_exception_translator
handy debugging tip
boost::python::throw_error_already_set(), set breakpoint here
https://bitbucket.org/sixty-north/scipy2014_boost_python_workshop_student_material/src
simply expose c++ function to python
boost::python::def
Embedding Python in C的更多相关文章
- Embeding Python & Extending Python with FFPython
Introduction ffpython is a C++ lib, which is to simplify tasks that embed Python and extend Python. ...
- hybrid programming based on python and C/C++
Python/C API Reference Manual¶ https://docs.python.org/3/c-api/index.html Extending and Embedding th ...
- 很好的c++和Python混合编程文章
c++中嵌入python入门1 本人是用vc2003+python2.5学习的,其它的也应该差不了多少 0. 坏境设置把Python的include/libs目录分别加到vc的include/lib ...
- py_initialize:C调Python出错 是初始化错误?
还是pythonpath和pythonname变量没有配置正确? py_initialize()方法是什么? In an application embedding Python, this shou ...
- Python中的__name__和__main__含义详解
1背景 在写Python代码和看Python代码时,我们常常可以看到这样的代码: ? 1 2 3 4 5 def main(): ...... if __name == "__m ...
- 浅析 C++ 调用 Python 模块
浅析 C++ 调用 Python 模块 作为一种胶水语言,Python 能够很容易地调用 C . C++ 等语言,也能够通过其他语言调用 Python 的模块. Python 提供了 C++ 库,使得 ...
- 结合python版本安装python-devel gcc和g++的区别 安装前做yum搜索
[test@ecs autocloudservices]# yum install python-develLoaded plugins: fastestmirrorLoading mirror sp ...
- Python与Javascript相互调用超详细讲解(2022年1月最新)(三)基本原理Part 3 - 通过C/C++联通
目录 TL; DR python调javascript javascript调python 原理 基于Node.js的javascript调用python 从Node调用python函数 V8 嵌入P ...
- 推荐一个第三方Qt库的集合
https://inqlude.org/ Stable libraries | Development versions | Unreleased | Commercial | All attica ...
随机推荐
- node-webkit教程(16)调试typescript
原文链接:node-webkit教程(16)调试typescript 本文所讲的内容同样适用于chrome浏览器. 在chrome的开发人员工具的配置项中,有一个sourcemap的选项,用来配置ja ...
- TfS+强制删除签出锁定项
1.连接到tfs数据库服务器的tfsversioncontrol库: 2.查tbl_workspace表,找出相应的工作目录,比如 select * from tbl_workspace where ...
- 隐藏路由器的WIFI信号,防蹭网
进入路由器的管理界面 最后别忘了 现在信号隐藏了,现在说一下如何用手机连接隐藏的路由器
- atitit.编辑表单的实现最佳实践dwr jq easyui
atitit.编辑表单的实现最佳实践dwr jq easyui 1. 提交表单 1 2. 表单验证 1 3. 数据保存使用meger方式取代save&update方式 1 3.1. Filte ...
- Quartz定时任务学习(二)web应用/Quartz定时任务学习(三)属性文件和jar
web中使用Quartz 1.首先在web.xml文件中加入 如下内容(根据自己情况设定) 在web.xml中添加QuartzInitializerServlet,Quartz为能够在web应用中使用 ...
- Windows Server 2008 R2 备份和恢复 (转)
Windows Server Backup : 1.安装Windows Server Backup的方法: 通过"服务器管理器"中的"添加功能"向导进行安装. ...
- KVM 基础使用(一)
Host OS:CentOS release 6.3 (Final) x64 安装时选择Virtual Host 1.测试KVM有没有启动 运行 lsmod | grep kvm 和 stat /de ...
- iOS开发- UICollectionView详解+实例
本章通过先总体介绍UICollectionView及其常用方法,再结合一个实例,了解如何使用UICollectionView. UICollectionView 和 UICollectionViewC ...
- [LeetCode] Find Median from Data Stream
Find Median from Data Stream Median is the middle value in an ordered integer list. If the size of t ...
- 美行Thinkpad八通道快捷入口
美行Thinkpad八通道快捷入口 链接: http://shop.lenovo.com/perksoffer/us/en/laptops/thinkpad/?__followRobots=true打 ...