python 特征选择 绘图 + mine
demo代码:
# _*_coding:UTF-8_*_

import numpy as np

import sys

import pandas as pd

from pandas import Series,DataFrame

import numpy as np

import sys

from sklearn import preprocessing

from sklearn.ensemble import ExtraTreesClassifier

import os

from minepy import MINE

def iterbrowse(path):

    for home, dirs, files in os.walk(path):

        for filename in files:

            yield os.path.join(home, filename)

def get_data(filename):

    white_verify = []

    with open(filename) as f:

        lines = f.readlines()

        data = {}

        for line in lines:

            a = line.split("\t")

            if len(a) != 78:

                print(line)

                raise Exception("fuck")

            white_verify.append([float(n) for n in a[3:]])

    return white_verify

if __name__ == '__main__':

    # pdb.set_trace()

    neg_file = "cc_data/black_all.txt"

    pos_file = "cc_data/white_all.txt"

    X = []

    y = []

    if os.path.isfile(pos_file):

        if pos_file.endswith('.txt'):

            pos_set = np.genfromtxt(pos_file)

        elif pos_file.endswith('.npy'):

            pos_set = np.load(pos_file)

        X.extend(pos_set)

        y += [0] * len(pos_set)

    if os.path.isfile(neg_file):

        if neg_file.endswith('.txt'):

            neg_set = np.genfromtxt(neg_file)

        elif neg_file.endswith('.npy'):

            neg_set = np.load(neg_file)

        '''

        X.extend(list(neg_set) * 5)

        y += [1] * (5 * len(neg_set))

        '''

        X.extend(neg_set)

        y += [1] * len(neg_set)

    print("len of X:", len(X))

    print("X sample:", X[:3])

    print("len of y:", len(y))

    print("y sample:", y[:3])

    X = [x[3:] for x in X]

    print("filtered X sample:", X[:3])

    cols = [str(i + 6) for i in range(len(X[0]))]

    clf = ExtraTreesClassifier()

    clf.fit(X, y)

    print (clf.feature_importances_)

    print "Features sorted by their score:"

    print sorted(zip(clf.feature_importances_, cols), reverse=True)

    black_verify = []

    for f in iterbrowse("todo/top"):

        print(f)

        black_verify += get_data(f)

    # ValueError: operands could not be broadcast together with shapes (1,74) (75,) (1,74)

    print(black_verify)

    black_verify_labels = [3] * len(black_verify)

    white_verify = get_data("todo/white_verify.txt")

    print(white_verify)

    white_verify_labels = [2] * len(white_verify)

    unknown_verify = get_data("todo/pek_feature74.txt")

    print(unknown_verify)

    # extend data

    X = np.concatenate((X, black_verify))

    y += black_verify_labels

    X = np.concatenate((X, white_verify))

    y += white_verify_labels

    #################################### plot ####################################

    data_train = pd.DataFrame(X)

    # cols = [str(i) for i in range(6, 81)]

    data_train.columns = cols

    # add label column

    # data_train = data_train.assign(label=pd.Series(y))

    data_train["label"] = pd.Series(y)

    print(data_train.info())

    print(data_train.columns)

    import matplotlib.pyplot as plt

    for col in cols:

        fig = plt.figure(figsize=(20, 16), dpi=8)

        fig.set(alpha=0.2)

        plt.figure()

        data_train[data_train.label == 0.0][col].plot()

        data_train[data_train.label == 1.0][col].plot()

        data_train[data_train.label == 2.0][col].plot()

        data_train[data_train.label == 3.0][col].plot()

        plt.xlabel(u"sample data id")

        plt.ylabel(u"value")

        plt.title(col)

        plt.legend((u'white', u'black', u"white-todo", u"black-todo"), loc='best')

        plt.show()

    print "calculate MINE mic value:"

    for col in cols:

        print col,

        mine = MINE(alpha=0.6, c=15,

                    est="mic_approx")  # http://minepy.readthedocs.io/en/latest/python.html#second-example

        mine.compute_score(data_train[col], y)

        print "MIC=", mine.mic()

    sys.exit(-1)
extend data 表示待预测的数据
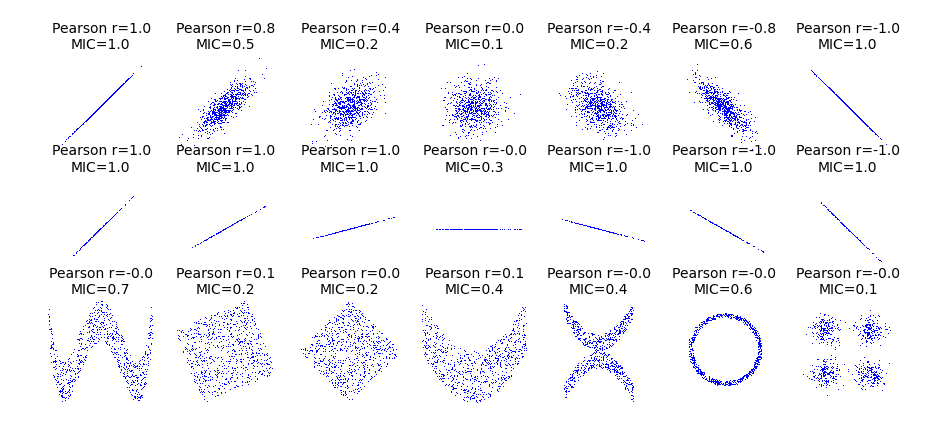
关于mic:
from __future__ import division

import numpy as np

import matplotlib.pyplot as plt

from minepy import MINE

rs = np.random.RandomState(seed=0)

def mysubplot(x, y, numRows, numCols, plotNum,

              xlim=(-4, 4), ylim=(-4, 4)):

    r = np.around(np.corrcoef(x, y)[0, 1], 1)

    mine = MINE(alpha=0.6, c=15, est="mic_approx")

    mine.compute_score(x, y)

    mic = np.around(mine.mic(), 1)

    ax = plt.subplot(numRows, numCols, plotNum,

                     xlim=xlim, ylim=ylim)

    ax.set_title('Pearson r=%.1f\nMIC=%.1f' % (r, mic),fontsize=10)

    ax.set_frame_on(False)

    ax.axes.get_xaxis().set_visible(False)

    ax.axes.get_yaxis().set_visible(False)

    ax.plot(x, y, ',')

    ax.set_xticks([])

    ax.set_yticks([])

    return ax

def rotation(xy, t):

    return np.dot(xy, [[np.cos(t), -np.sin(t)], [np.sin(t), np.cos(t)]])

def mvnormal(n=1000):

    cors = [1.0, 0.8, 0.4, 0.0, -0.4, -0.8, -1.0]

    for i, cor in enumerate(cors):

        cov = [[1, cor],[cor, 1]]

        xy = rs.multivariate_normal([0, 0], cov, n)

        mysubplot(xy[:, 0], xy[:, 1], 3, 7, i+1)

def rotnormal(n=1000):

    ts = [0, np.pi/12, np.pi/6, np.pi/4, np.pi/2-np.pi/6,

          np.pi/2-np.pi/12, np.pi/2]

    cov = [[1, 1],[1, 1]]

    xy = rs.multivariate_normal([0, 0], cov, n)

    for i, t in enumerate(ts):

        xy_r = rotation(xy, t)

        mysubplot(xy_r[:, 0], xy_r[:, 1], 3, 7, i+8)

def others(n=1000):

    x = rs.uniform(-1, 1, n)

    y = 4*(x**2-0.5)**2 + rs.uniform(-1, 1, n)/3

    mysubplot(x, y, 3, 7, 15, (-1, 1), (-1/3, 1+1/3))

    y = rs.uniform(-1, 1, n)

    xy = np.concatenate((x.reshape(-1, 1), y.reshape(-1, 1)), axis=1)

    xy = rotation(xy, -np.pi/8)

    lim = np.sqrt(2+np.sqrt(2)) / np.sqrt(2)

    mysubplot(xy[:, 0], xy[:, 1], 3, 7, 16, (-lim, lim), (-lim, lim))

    xy = rotation(xy, -np.pi/8)

    lim = np.sqrt(2)

    mysubplot(xy[:, 0], xy[:, 1], 3, 7, 17, (-lim, lim), (-lim, lim))

    y = 2*x**2 + rs.uniform(-1, 1, n)

    mysubplot(x, y, 3, 7, 18, (-1, 1), (-1, 3))

    y = (x**2 + rs.uniform(0, 0.5, n)) * \

        np.array([-1, 1])[rs.random_integers(0, 1, size=n)]

    mysubplot(x, y, 3, 7, 19, (-1.5, 1.5), (-1.5, 1.5))

    y = np.cos(x * np.pi) + rs.uniform(0, 1/8, n)

    x = np.sin(x * np.pi) + rs.uniform(0, 1/8, n)

    mysubplot(x, y, 3, 7, 20, (-1.5, 1.5), (-1.5, 1.5))

    xy1 = np.random.multivariate_normal([3, 3], [[1, 0], [0, 1]], int(n/4))

    xy2 = np.random.multivariate_normal([-3, 3], [[1, 0], [0, 1]], int(n/4))

    xy3 = np.random.multivariate_normal([-3, -3], [[1, 0], [0, 1]], int(n/4))

    xy4 = np.random.multivariate_normal([3, -3], [[1, 0], [0, 1]], int(n/4))

    xy = np.concatenate((xy1, xy2, xy3, xy4), axis=0)

    mysubplot(xy[:, 0], xy[:, 1], 3, 7, 21, (-7, 7), (-7, 7))

plt.figure(facecolor='white')

mvnormal(n=800)

rotnormal(n=200)

others(n=800)

plt.tight_layout()

plt.show()
python 特征选择 绘图 + mine的更多相关文章
- python常用绘图软件包记录
在没有使用python之前,觉得matlab的绘图功能还算可以~但现在发现python的绘图包真的好强大,绘制出的图像非常专业漂亮,但具体使用还有待学习,这里记录学习过程中遇到的python绘图包,以 ...
- Python之绘图和可视化
Python之绘图和可视化 1. 启用matplotlib 最常用的Pylab模式的IPython(IPython --pylab) 2. matplotlib的图像都位于Figure对象中. 可以使 ...
- 10分钟轻松学会python turtle绘图
 1. 画布(canvas) 1.1 相关函数: 2. 画笔 2.1 画笔的状态 2.2 画笔的属性 2.3 绘图命令 3. 命令详解 4. 绘图举例 4.1 太阳花 4.2 绘制小蟒蛇 4.3 绘 ...
- python matplotlib 绘图基础
在利用Python做数据分析时,探索数据以及结果展现上图表的应用是不可或缺的. 在Python中通常情况下都是用matplotlib模块进行图表制作. 先理下,matplotlib的结构原理: mat ...
- 10分钟轻松学会 Python turtle 绘图
python2.6版本中后引入的一个简单的绘图工具,叫做海龟绘图(Turtle Graphics),turtle库是python的内部库,使用导入即可 import turtle 先说明一下turtl ...
- Python函数绘图
最近看数学,发现有时候画个图还真管用,对理解和展示效果都不错.尤其是三维空间和一些复杂函数,相当直观,也有助于解题.本来想用mathlab,下载安装都太费事,杀鸡不用牛刀,Python基本就能实现.下 ...
- 【Matplotlib】利用Python进行绘图
[Matplotlib] 教程:https://morvanzhou.github.io/tutorials/data-manipulation/plt/ 官方文档:https://matplotli ...
- python海龟绘图
最近学了python,看了几本书之后,才明白python的强大,python是一种解释型的语言,即每写一行程序就执行一行. 而且在科学计算方面,处理的能力特别的方便. 比如python中的字典dict ...
- 【震惊】手把手教你用python做绘图工具(一)
在这篇博客里将为你介绍如何通过numpy和cv2进行结和去创建画布,包括空白画布.白色画布和彩色画布.创建画布是制作绘图工具的前提,有了画布我们就可以在画布上尽情的挥洒自己的艺术细胞. 还在为如何去绘 ...
随机推荐
- 如何自定义View
1. 首先 在values目录下建立attrs.xml文件,添加属性内容 ·在布局文件中添加新的命名空间xmlns,然后可以使用命名空间给自定义的空间设置属性 attrs.xml <resour ...
- php 获取文件加的名称
/*** * 根本平台类型获取文件名 */ function showGetFileName($type,$url){ #判断平台类型 if($type=='android'||$type=='ios ...
- ipmitool常用命令
然后查看ip等信息,使用如下命令: ipmitool lan print 远程访问 可使用如下命令尝试: ipmitool -I lanplus -H 10.108.125.227 -U Admini ...
- 安装Hadoop 1.1.2 (三 安装配置Hadoop)
1 tar -zxvf hadoop-1.1.2.tar.gz 2 在hadoop/conf目录 (1) 编辑 hadoop-env.sh export JAVA_HOME=/usr/java/jdk ...
- js校验密码强度
网上转载的一段代码,留着以后用, js文件: //判断输入密码的类型 function CharMode(iN){ if (iN>=48 && iN <=57) //数字 ...
- 识别不了socket未知的名称或服务
个人博客地址:https://blog.sharedata.info/ socket 链接导致java.net.UnknownHostException: R1-T1-N6: R1-T1-N6: 未知 ...
- Card Collector
In your childhood, do you crazy for collecting the beautiful cards in the snacks? They said that, fo ...
- Collective Mindsets (medium) (逻辑题)
B - Collective Mindsets (medium) Time Limit:1000MS Memory Limit:262144KB 64bit IO Format:%I6 ...
- IoC与DI
IoC与DI 首先想说说IoC(Inversion of Control,控制倒转).这是spring的核心,贯穿始终.所谓IoC,对于spring框架来说,就是由spring来负责控制对象的生命周期 ...
- 在VS2010下打开VS2008项目的解决办法
如何在vs2010中打开vs2008项目文件? 第一步:以记事本方式打开该项目的sln解决方案,找到这两行信息,分别如下:Microsoft Visual Studio Solution File, ...