
使用Aspose.Cells生成Excel的线型图表
目的:
1.根据模板里面的excel数据信息,动态创建line chart
2.linechart 的样式改为灰色
3.以流的形式写到客户端,不管客户端是否装excel,都可以导出到到客户端
4.使用Aspose.Cells的基本功能
5.使用mvc测试代码
导出到excel里面的效果图
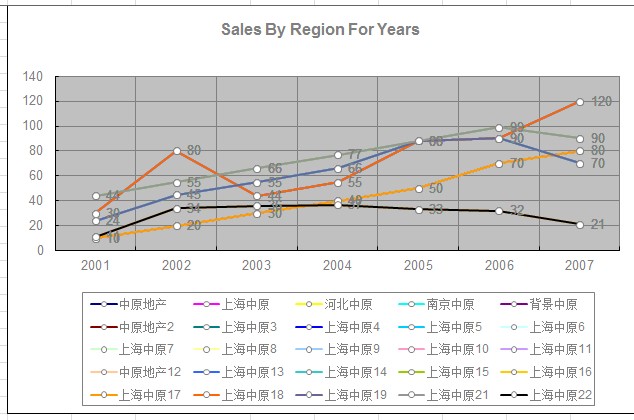
excel里面的数据源sheet2
|
1
2
3
4
5
6
7
8
9
10
11
12
13
14
15
16
17
18
19
20
21
22
23
24
25
26
|
2001 2002 2003 2004 2005 2006 2007中原地产 10 20 30 40 50 70 80上海中原 30 80 44 55 88 90 120河北中原 24 45 55 66 88 90 70南京中原 44 55 66 77 88 99 90背景中原 11 34 36 37 33 32 21中原地产2 10 20 30 40 50 70 80上海中原3 30 80 44 55 88 90 120上海中原4 24 45 55 66 88 90 70上海中原5 44 55 66 77 88 99 90上海中原6 11 34 36 37 33 32 21上海中原7 10 20 30 40 50 70 80上海中原8 30 80 44 55 88 90 120上海中原9 24 45 55 66 88 90 70上海中原10 44 55 66 77 88 99 90上海中原11 11 34 36 37 33 32 21中原地产12 10 20 30 40 50 70 80上海中原13 30 80 44 55 88 90 120上海中原14 24 45 55 66 88 90 70上海中原15 44 55 66 77 88 99 90上海中原16 11 34 36 37 33 32 21上海中原17 10 20 30 40 50 70 80上海中原18 30 80 44 55 88 90 120上海中原19 24 45 55 66 88 90 70上海中原21 44 55 66 77 88 99 90上海中原22 11 34 36 37 33 32 21 |
入口方法:
|
1
2
3
4
5
6
7
8
9
10
11
12
13
14
15
16
17
18
|
public ActionResult excels(){WorkbookDesigner designer = new WorkbookDesigner();string path = Server.MapPath("/Templete/11111.xls");designer.Workbook.Open(path);Workbook workbook = designer.Workbook;//创建一个chart到页面CreateStaticReport1(workbook);designer.Process();//将流文件写到客户端流的形式写到客户端,名称是_report.xlsdesigner.Save("_report.xls", SaveType.OpenInExcel, FileFormatType.Excel2003, System.Web.HttpContext.Current.Response);Response.Flush();Response.Close();designer = null;// Response.End();return View("getexcel");} |
生成chart方法
|
1
2
3
4
5
6
7
8
9
10
11
12
13
14
15
16
17
18
19
20
21
22
23
24
25
26
27
28
29
30
31
32
33
34
35
36
37
38
39
40
41
42
43
44
45
46
47
48
49
50
51
52
53
54
55
56
57
58
59
60
61
62
63
64
65
|
private void CreateStaticReport1(Workbook workbook){ //创建一个折线图 workbook.Worksheets[0].Charts.Add(ChartType.Line, 1, 1, 25, 10); Aspose.Cells.Chart chart = workbook.Worksheets[0].Charts[0]; //折线区域竖线设置为显示颜色设置为灰色 chart.CategoryAxis.MajorGridLines.IsVisible = true; chart.CategoryAxis.MajorGridLines.Color = Color.Gray; //折线区域设置横着的网格线显示 chart.MajorGridLines.IsVisible = true; chart.MajorGridLines.Color = Color.Gray; //设置title样式 chart.Title.Text = "Sales By Region For Years"; chart.Title.TextFont.Color = Color.Gray; chart.Title.TextFont.IsBold = true; chart.Title.TextFont.Size = 12; //Set Properties of nseries chart.NSeries.Add("Sheet2!B2:H26", false); //Set NSeries Category Datasource chart.NSeries.CategoryData = "Sheet2!B1:H1"; Cells cells = workbook.Worksheets[1].Cells; //loop over the Nseriese for (int i = 0; i < chart.NSeries.Count; i++) { //设置每条折线的名称 chart.NSeries[i].Name = cells[i + 1, 0].Value.ToString(); //设置线的宽度 chart.NSeries[i].Line.Weight = WeightType.MediumLine; //设置每个值坐标点的样式 chart.NSeries[i].MarkerStyle = ChartMarkerType.Circle; chart.NSeries[i].MarkerSize = 5; chart.NSeries[i].MarkerBackgroundColor = Color.White; chart.NSeries[i].MarkerForegroundColor = Color.Gray; //每个折线向显示出值 chart.NSeries[i].DataLabels.IsValueShown = true; chart.NSeries[i].DataLabels.TextFont.Color = Color.Gray; } //设置x轴上数据的样式为灰色 chart.CategoryAxis.TickLabels.Font.Color = Color.Gray; chart.CategoryAxis.TickLabelPosition = TickLabelPositionType.NextToAxis; //设置y轴的样式 chart.ValueAxis.TickLabelPosition = TickLabelPositionType.Low; chart.ValueAxis.TickLabels.Font.Color = Color.Gray; // chart.ValueAxis.TickLabels.TextDirection = TextDirectionType.LeftToRight; //设置Legend位置以及样式 chart.Legend.Position = LegendPositionType.Bottom; chart.Legend.TextFont.Color = Color.Gray; chart.Legend.Border.Color = Color.Gray;} |
使用Aspose.Cells 设置chart的y坐标轴显示值
目的:设置chart的y坐标轴显示值
用aspose.cell生成的chart生成的Y轴是默认生成的,自己要定义y轴坐标值
1.把数据源写到excel里面,list里面
2.y轴坐标自己定义
第一种:默认设置:chart里面会自己定义y轴坐标
第二种:y周坐标以对数显示 chart.ValueAxis.IsLogarithmic = true; 以10 100 1000格式显示
第三种:只设置间隔值 chart.ValueAxis.MajorUnit =20000;,会自动获取y轴的最大值与最小值
第四种:设置y轴的最大值与最小值,设置间隔值
//设置y坐标轴的厚度
chart.ValueAxis.AxisLine.Weight = WeightType.WideLine;
chart.ValueAxis.Title.Text = "y轴坐标";
chart.ValueAxis.MajorUnit =20000;//设置y轴的显示值间隔
chart.ValueAxis.MaxValue = 200000;//设置y轴开始最大值
chart.ValueAxis.MinValue = 0;//设置y轴的最小值
3.设置右边坐标轴是不是显示
//设置右边坐标轴显示
chart.SecondValueAxis.IsVisible = true;
//设置y坐标轴间隔值字大小
chart.SecondValueAxis.TickLabels.Font.Size = 12;
chart.SecondValueAxis.Title.Text = "y轴坐标2";
导出效果:
//设置y坐标轴的厚度
chart.ValueAxis.AxisLine.Weight = WeightType.WideLine;
chart.ValueAxis.Title.Text = "y轴坐标";
chart.ValueAxis.MajorUnit =20000;//设置y轴的显示值间隔
chart.ValueAxis.MaxValue = 200000;//设置y轴开始最大值
chart.ValueAxis.MinValue = 0;//设置y轴的最小值

第二种:y周坐标以对数显示 chart.ValueAxis.IsLogarithmic = true; 以10 100 1000格式显示

//设置y坐标轴的厚度
chart.ValueAxis.AxisLine.Weight = WeightType.WideLine;
chart.ValueAxis.Title.Text = "y轴坐标";
chart.ValueAxis.MajorUnit =20000;//设置y轴的显示值间隔
chart.ValueAxis.MaxValue = 80000;//设置y轴开始最大值
chart.ValueAxis.MinValue = 0;//设置y轴的最小值

入口函数
|
1
2
3
4
5
6
7
8
9
10
11
12
13
14
15
16
17
|
public ActionResult excels() { WorkbookDesigner designer = new WorkbookDesigner(); string path = Server.MapPath("/Templete/11111.xls"); designer.Workbook.Open(path); Workbook workbook = designer.Workbook; CreateStaticData(workbook); CreateStaticReport(workbook); designer.Process(); //将流文件写到客户端流的形式写到客户端,名称是_report.xls designer.Save("_report.xls", SaveType.OpenInExcel, FileFormatType.Excel2003, System.Web.HttpContext.Current.Response); Response.Flush(); Response.Close(); designer = null; // Response.End(); return View("getexcel"); } |
设置数据源
|
1
2
3
4
5
6
7
8
9
10
11
12
13
14
15
16
17
18
19
20
21
22
23
24
25
26
27
28
29
30
31
32
33
34
35
36
37
38
39
|
private void CreateStaticData(Workbook workbook) { //Initialize Cells object Cells cells = workbook.Worksheets[0].Cells; //Put string into a cells of Column A cells["A1"].PutValue("class"); cells["A2"].PutValue("红萝卜"); cells["A3"].PutValue("白萝卜"); cells["A4"].PutValue("青萝卜"); //Put a value into a Row 1 cells["B1"].PutValue(2002); cells["C1"].PutValue(2003); cells["D1"].PutValue(2004); cells["E1"].PutValue(2005); cells["F1"].PutValue(2006); //Put a value into a Row 2 cells["B2"].PutValue(40000); cells["C2"].PutValue(45000); cells["D2"].PutValue(50000); cells["E2"].PutValue(55000); cells["F2"].PutValue(70000); //Put a value into a Row 3 cells["B3"].PutValue(10000); cells["C3"].PutValue(25000); cells["D3"].PutValue(40000); cells["E3"].PutValue(52000); cells["F3"].PutValue(60000); //Put a value into a Row 4 cells["B4"].PutValue(5000); cells["C4"].PutValue(15000); cells["D4"].PutValue(35000); cells["E4"].PutValue(30000); cells["F4"].PutValue(20000); } |
设置chart y轴的显示值
|
1
2
3
4
5
6
7
8
9
10
11
12
13
14
15
16
17
18
19
20
21
22
23
24
25
26
27
28
29
30
31
32
33
34
35
36
37
38
39
40
41
42
43
44
45
46
47
48
49
50
51
52
53
54
55
56
57
58
59
60
61
62
63
64
65
66
67
68
69
70
|
private void CreateStaticReport(Workbook workbook) { //初始化 Worksheet Worksheet sheet = workbook.Worksheets[0]; //设置 worksheet名称 sheet.Name = "Line"; //设置worksheet不显示 sheet.IsGridlinesVisible = false; //根据数据源 创建 chart int chartIndex = 0; chartIndex = sheet.Charts.Add(ChartType.Line, 5, 1, 29, 15); //初始化chart Chart chart = sheet.Charts[chartIndex]; //设置竖线不显示 chart.CategoryAxis.MajorGridLines.IsVisible = false; //设置Title样式 chart.Title.Text = "Sales By Class For Years"; chart.Title.TextFont.Color = Color.Black; chart.Title.TextFont.IsBold = true; chart.Title.TextFont.Size = 12; //设置chart的数据源 chart.NSeries.Add("B2:F4", false); chart.NSeries.CategoryData = "B1:F1"; //Set Nseries color varience to True chart.NSeries.IsColorVaried = true; //初始化 Cells Cells cells = workbook.Worksheets[0].Cells; //循环 cells for (int i = 0; i < chart.NSeries.Count; i++) { //设置系列的名称 chart.NSeries[i].Name = cells[i + 1, 0].Value.ToString(); chart.NSeries[i].MarkerStyle = ChartMarkerType.Circle; //设置系列的名称 Background 与ForeGround chart.NSeries[i].MarkerBackgroundColor = Color.Yellow; chart.NSeries[i].MarkerForegroundColor = Color.Gold; //设置系列标记 chart.NSeries[i].MarkerSize = 10; //设置Category的名称 chart.CategoryAxis.Title.Text = "Year(2002-2006)"; chart.CategoryAxis.Title.TextFont.Color = Color.Black; chart.CategoryAxis.Title.TextFont.IsBold = true; chart.CategoryAxis.Title.TextFont.Size = 10; //设置图例的位置 chart.Legend.Position = LegendPositionType.Top; } //设置y轴的样式 chart.ValueAxis.TickLabelPosition = TickLabelPositionType.NextToAxis; chart.ValueAxis.TickLabels.Font.Color = Color.Gray; chart.ValueAxis.AxisBetweenCategories = false; //chart.ValueAxis.TickLabels.Font.Size = 13; chart.ValueAxis.TickLabels.Font.IsBold = true; //Y坐标轴对数间隔展示 // chart.ValueAxis.IsLogarithmic = true; chart.ValueAxis.MajorGridLines.Color = Color.Red; chart.ValueAxis.AxisLine.Color = Color.DarkGreen; //设置y坐标轴的厚度 chart.ValueAxis.AxisLine.Weight = WeightType.WideLine; chart.ValueAxis.Title.Text = "y轴坐标"; chart.ValueAxis.MajorUnit = 20000;//MajorUnit =2000; chart.ValueAxis.MaxValue = 200000; chart.ValueAxis.MinValue = 0; //设置右边坐标轴显示 chart.SecondValueAxis.IsVisible = true; //设置y坐标轴间隔值字大小 chart.SecondValueAxis.TickLabels.Font.Size = 12; chart.SecondValueAxis.Title.Text = "y轴坐标2"; // chart.SecondValueAxis.MinorGridLines.IsVisible = true; } |
使用Aspose.Cells生成Excel的线型图表的更多相关文章
- EpPlus读取生成Excel帮助类+读取csv帮助类+Aspose.Cells生成Excel帮助类
大部分功能逻辑都在,少量自定义异常类和扩展方法 ,可用类似代码自己替换 //EpPlus读取生成Excel帮助类+读取csv帮助类,epplus只支持开放的Excel文件格式:xlsx,不支持 xls ...
- 使用Aspose.Cells生成Excel的方法详解(转)
using System; using System.Collections.Generic; using System.Linq; using System.Web; using System ...
- 使用Aspose.Cells读取Excel
最新更新请访问: http://denghejun.github.io Aspose.Cells读取Excel非常方便,以下是一个简单的实现读取和导出Excel的操作类: 以下是Aspose.Ce ...
- 报表中的Excel操作之Aspose.Cells(Excel模板)
原文:报表中的Excel操作之Aspose.Cells(Excel模板) 本篇中将简单记录下Aspose.Cells这个强大的Excel操作组件.这个组件的强大之处,就不多说,对于我们的报表总是会有导 ...
- Aspose.Cells导出Excel(1)
利用Aspose.Cells导出excel 注意的问题 1.DataTable的处理 2.进行编码,便于中文名文件下载 3.别忘了Aspose.Cells.dll(可以自己在网上搜索) public ...
- 怎么使用Aspose.Cells读取excel 转化为Datatable
说明:vs2012 asp.net mvc4 c# 使用Aspose.Cells 读取Excel 转化为Datatable 1.HTML前端代码 <%@ Page Language=" ...
- 怎么利用Aspose.Cells 获取excel 数据表中sheet的名称
说明:开发环境 vs2012 asp.net mvc4 c# 利用Aspose.Cells 获取Excel数据表的sheet的名称,并把获取的名称赋值给easyUI 的combobox 1.运行效果 ...
- Aspose.cells 读取Excel表中的图片问题
一.说明 本文主要是讲解,怎么使用aspose.cells读取Excel表中的图片,并把图片转换成流或是image对象. 二.开发环境说明 开发工具vs2012,c#语言, 三.Aspose.cell ...
- 使用 Aspose.Cells 实现 excel导入
using System; using System.Collections.Generic; using System.Linq; using System.Web; using System.We ...
随机推荐
- Delphi的idhttp报IOHandler value is not valid错误的原因[转]
出现这种问题的原因是由于访问的 URL地址为https或存在其跳转地址为https. 首先单纯使用idhttp是只能访问http,而https则需要搭配IdSSLIOHandlerSocketOpen ...
- netsh 转发 5000 端口到 80端口的命令和删除方法
归集整理一下 netsh 的几个简单命令. 实现端口转发等作用. 注意 命令. netsh connectaddress= listenaddress 的地址 目的 是 对外服务的 target 的 ...
- [日常工作] Inspur 服务器安装ESXi的简单过程
1. 公司里面使用虚拟化来进行功能测试 性能测试, 现阶段和之前主要是用虚拟机来搞. 前期用过hyperV 但是感觉 没有SystemCenter的VMM的授权比较难搞一些. 所以还是用ESXi的多了 ...
- MyBatis是如何解决Sql注入的
转:[转]mybatis如何防止sql注入 java中预处理PrepareStatement为什么能起到防止SQL注入的作用??!! 一.SQL注入 sql注入大家都不陌生,是一种常见的攻击方式,攻击 ...
- jquery stop()、callback、鏈接
stop(stopAll,goToEnd) stop適用於所有的效果,包括顯示隱藏.滑動.淡入淡出和動畫. stopAll默認值為false,清除當前動畫,可以向後執行下一動畫調用,黨改為true,清 ...
- NodeJs加载站点的所有页面不存在则404
演示 链接:https://pan.baidu.com/s/1TZ351m3wUWZpq46qGbejjg 密码:ijj5 代码: var http = require("http" ...
- P1306 斐波那契公约数
题目描述 对于Fibonacci数列:1,1,2,3,5,8,13......大家应该很熟悉吧~~~但是现在有一个很“简单”问题:第n项和第m项的最大公约数是多少? 输入输出格式 输入格式: 两个正整 ...
- 洛谷P3345 [ZJOI2015]幻想乡战略游戏(动态点分治,树的重心,二分查找,Tarjan-LCA,树上差分)
洛谷题目传送门 动态点分治小白,光是因为思路不清晰就耗费了不知道多少时间去gang这题,所以还是来理理思路吧. 一个树\(T\)里面\(\sum\limits_{v\in T} D_vdist(u,v ...
- 20 Zabbix 利用Scripts栏目对Hosts远程执行命令
点击返回:自学Zabbix之路 点击返回:自学Zabbix4.0之路 点击返回:自学zabbix集锦 20 Zabbix 利用Scripts栏目对Hosts远程执行命令 在Monitoring板块中, ...
- 如何同时修改SharePoint帐号和AD帐号的密码 - 批量修改SharePoint Managed Account
cls if ((Get-PSSnapin "Microsoft.SharePoint.PowerShell" -ErrorAction SilentlyContinue) -eq ...