
tensorflow读书笔记
TensorFlow 是一个用于研究和生产的开放源代码机器学习库。TensorFlow 提供了各种 API,可供初学者和专家在桌面、移动、网络和云端环境下进行开发。
TensorFlow是采用数据流图(data flow graphs)来计算,所以首先我们得创建一个数据流流图,然后再将我们的数据(数据以张量(tensor)的形式存在)放在数据流图中计算. 节点(Nodes)在图中表示数学操作,图中的边(edges)则表示在节点间相互联系的多维数据数组, 即张量(tensor)。训练模型时tensor会不断的从数据流图中的一个节点flow到另一节点, 这就是TensorFlow名字的由来。
TensorFlowd的特性:
1.灵活性
2.可移植性
3.多语言支持
4.高效性
Graph:要组装的结构,由许多操作组成,其中的每个连接点代表一种操作
op:接受(流入)零个或多个输入(液体),返回(流出)零个或多个输出
张量是tensorflow中的基本数据结构,张量有很多种,TensorFlow用张量这种数据结构来表示所有的数据.你可以把一个张量想象成一个n维的数组或列表.一个张量有一个静态类型和动态类型的维数.张量可以在图中的节点之间流通.其实张量更代表的就是一种多位数组。在tensorflow中,有很多操作张量的函数,有生成张量、创建随机张量、张量类型与形状变换和张量的切片与运算。
张量从流图的一端流动到另一端的计算过程。它生动形象地描述了复杂数据结构在人工神经网中的流动、传输、分析和处理模式
tensorflow程序应用统计:
import tensorflow as tf
from tensorflow import keras
# Helper libraries
import numpy as np
import matplotlib.pyplot as plt
print(tf.__version__)
fashion_mnist = keras.datasets.fashion_mnist
(train_images, train_labels), (test_images, test_labels) = fashion_mnist.load_data()
fashion_mnist = keras.datasets.fashion_mnist
class_names = ['T-shirt/top', 'Trouser', 'Pullover', 'Dress', 'Coat',
'Sandal', 'Shirt', 'Sneaker', 'Bag', 'Ankle boot']
len(train_labels)
len(test_labels)
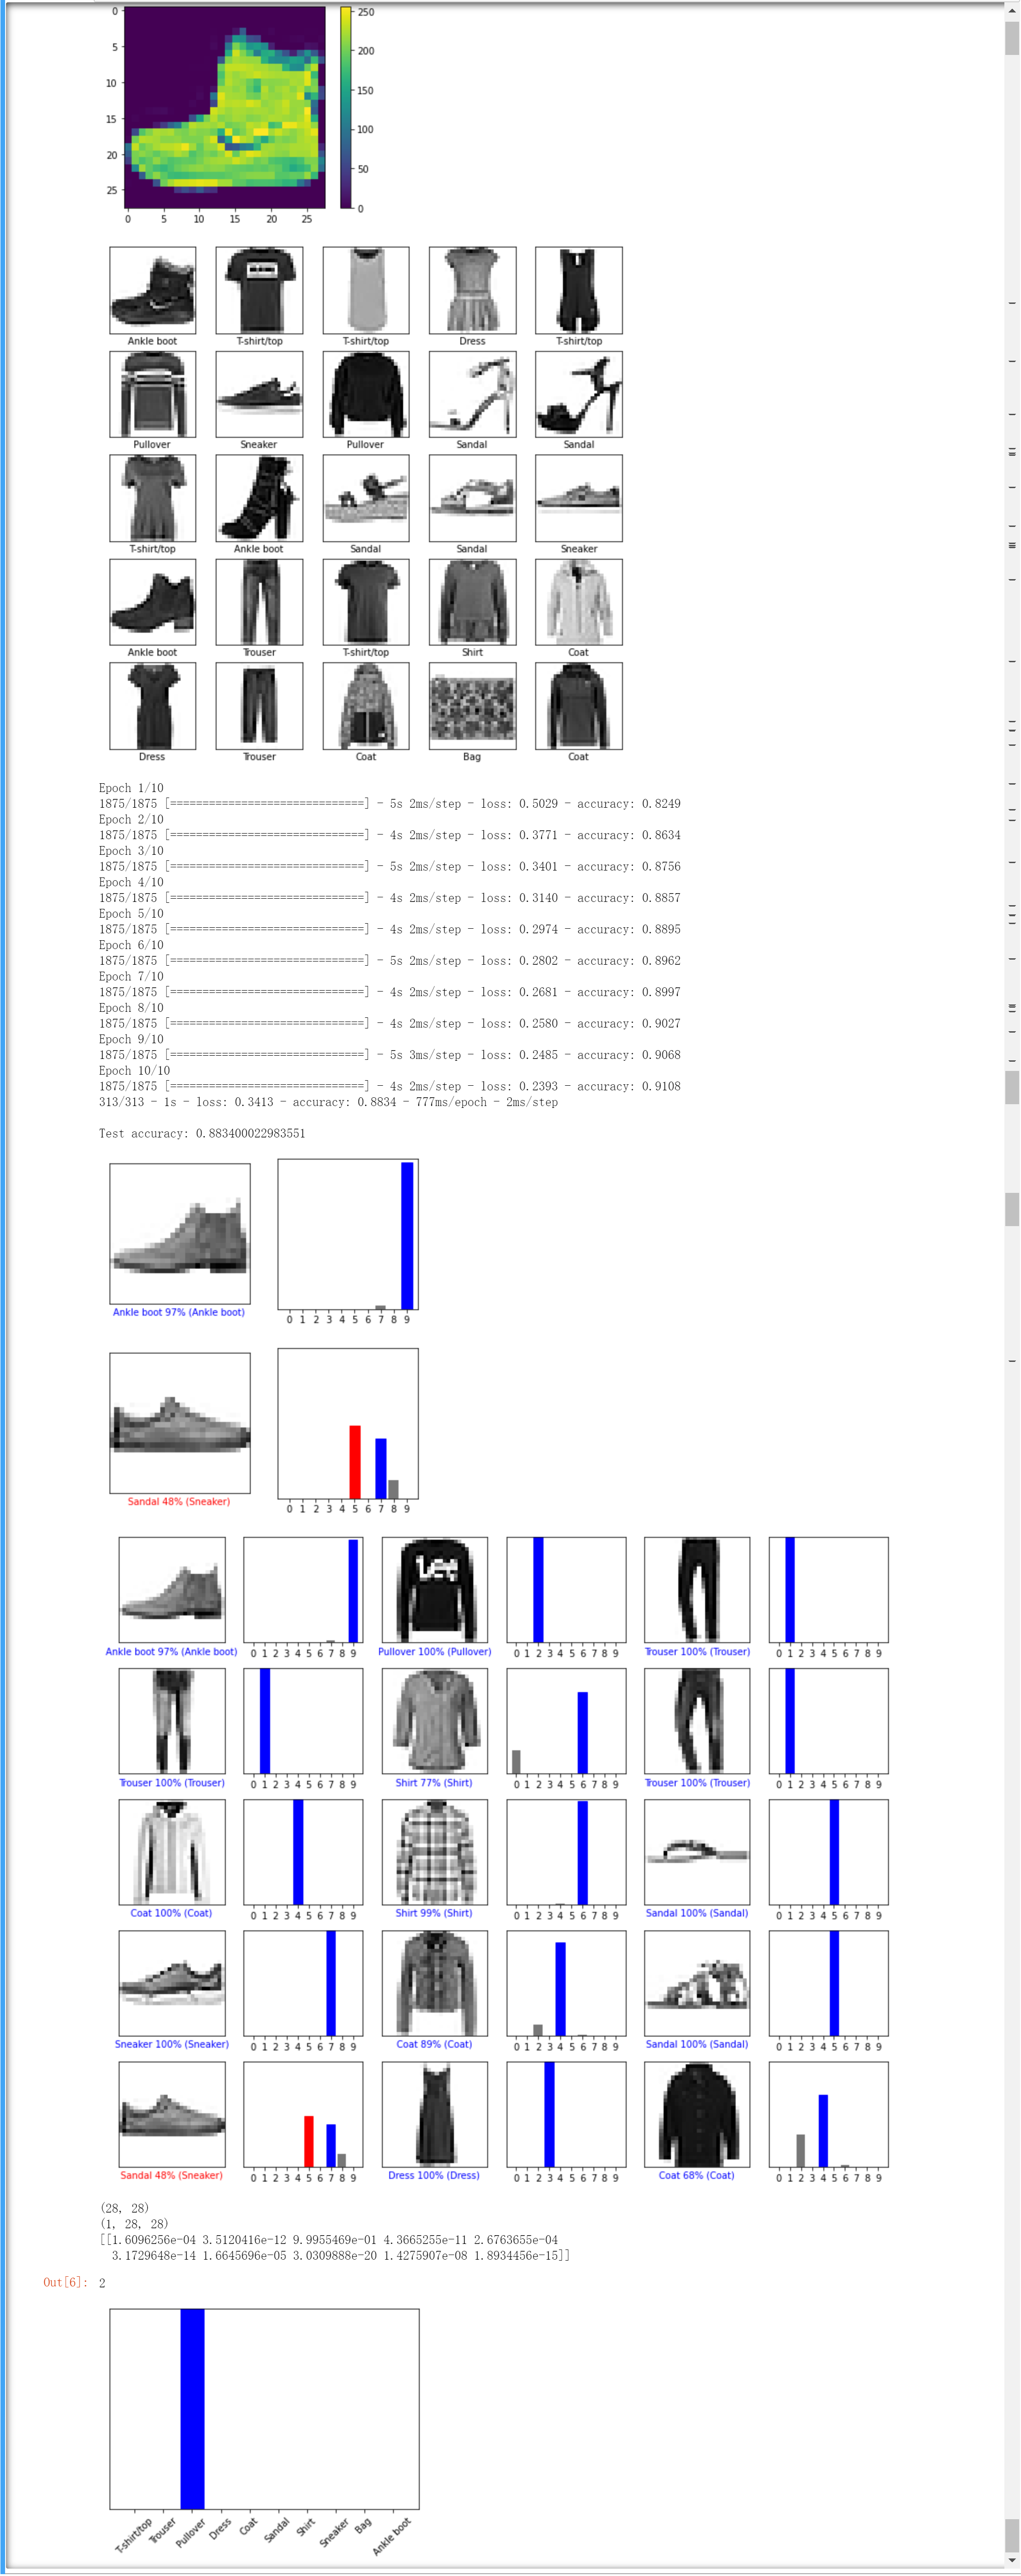
plt.figure()
plt.imshow(train_images[0])
plt.colorbar()
plt.grid(False)
plt.show()
train_images = train_images / 255.0
test_images = test_images / 255.0
plt.figure(figsize=(10,10))
for i in range(25):
plt.subplot(5,5,i+1)
plt.xticks([])
plt.yticks([])
plt.grid(False)
plt.imshow(train_images[i], cmap=plt.cm.binary)
plt.xlabel(class_names[train_labels[i]])
plt.show()
model = keras.Sequential([
keras.layers.Flatten(input_shape=(28, 28)),
keras.layers.Dense(128, activation='relu'),
keras.layers.Dense(10)
])
model.compile(optimizer='adam',
loss=tf.keras.losses.SparseCategoricalCrossentropy(from_logits=True),
metrics=['accuracy'])
model.fit(train_images, train_labels, epochs=10)
test_loss, test_acc = model.evaluate(test_images, test_labels, verbose=2)
print('\nTest accuracy:', test_acc)
probability_model = tf.keras.Sequential([model,
tf.keras.layers.Softmax()])
predictions = probability_model.predict(test_images)
np.argmax(predictions[0])
def plot_image(i, predictions_array, true_label, img):
predictions_array, true_label, img = predictions_array, true_label[i], img[i]
plt.grid(False)
plt.xticks([])
plt.yticks([])
plt.imshow(img, cmap=plt.cm.binary)
predicted_label = np.argmax(predictions_array)
if predicted_label == true_label:
color = 'blue'
else:
color = 'red'
plt.xlabel("{} {:2.0f}% ({})".format(class_names[predicted_label],
100*np.max(predictions_array),
class_names[true_label]),
color=color)
def plot_value_array(i, predictions_array, true_label):
predictions_array, true_label = predictions_array, true_label[i]
plt.grid(False)
plt.xticks(range(10))
plt.yticks([])
thisplot = plt.bar(range(10), predictions_array, color="#777777")
plt.ylim([0, 1])
predicted_label = np.argmax(predictions_array)
thisplot[predicted_label].set_color('red')
thisplot[true_label].set_color('blue')
i = 0
plt.figure(figsize=(6, 3))
plt.subplot(1, 2, 1)
plot_image(i, predictions[i], test_labels, test_images)
plt.subplot(1, 2, 2)
plot_value_array(i, predictions[i], test_labels)
plt.show()
i = 12
plt.figure(figsize=(6, 3))
plt.subplot(1, 2, 1)
plot_image(i, predictions[i], test_labels, test_images)
plt.subplot(1, 2, 2)
plot_value_array(i, predictions[i], test_labels)
plt.show()
# Plot the first X test images, their predicted labels, and the true labels.
# Color correct predictions in blue and incorrect predictions in red.
num_rows = 5
num_cols = 3
num_images = num_rows * num_cols
plt.figure(figsize=(2 * 2 * num_cols, 2 * num_rows))
for i in range(num_images):
plt.subplot(num_rows, 2 * num_cols, 2 * i + 1)
plot_image(i, predictions[i], test_labels, test_images)
plt.subplot(num_rows, 2 * num_cols, 2 * i + 2)
plot_value_array(i, predictions[i], test_labels)
plt.tight_layout()
plt.show()
# Grab an image from the test dataset.
img = test_images[1]
print(img.shape)
# Add the image to a batch where it's the only member.
img = (np.expand_dims(img, 0))
print(img.shape)
predictions_single = probability_model.predict(img)
print(predictions_single)
plot_value_array(1, predictions_single[0], test_labels)
_ = plt.xticks(range(10), class_names, rotation=45)
np.argmax(predictions_single[0])
tensorflow读书笔记的更多相关文章
- 机器学习实战_基于Scikit-Learn和Tensorflow读书笔记
第一部分 机器学习基础 第二部分 神经网络和深度学习 第9章 运行Tensorflow 分布式系统:分布式系统的定义是这个系统建立在网络的操作系统,具有高度的内聚性和透明性,它与网络的区别在于高层软件 ...
- 机器学习实战:基于Scikit-Learn和TensorFlow 读书笔记 第6章 决策树
数据挖掘作业,要实现决策树,现记录学习过程 win10系统,Python 3.7.0 构建一个决策树,在鸢尾花数据集上训练一个DecisionTreeClassifier: from sklearn. ...
- TensorFlow学习笔记1-入门
TensorFlow学习笔记1-入门 作者: YunYuan *** 写在前面 本笔记是我学习TensorFlow官方文档中文版的读书笔记,由于尚未搭建好Github的个人博客的评论功能,故尚不方便与 ...
- 读书笔记汇总 - SQL必知必会(第4版)
本系列记录并分享学习SQL的过程,主要内容为SQL的基础概念及练习过程. 书目信息 中文名:<SQL必知必会(第4版)> 英文名:<Sams Teach Yourself SQL i ...
- 读书笔记--SQL必知必会18--视图
读书笔记--SQL必知必会18--视图 18.1 视图 视图是虚拟的表,只包含使用时动态检索数据的查询. 也就是说作为视图,它不包含任何列和数据,包含的是一个查询. 18.1.1 为什么使用视图 重用 ...
- 《C#本质论》读书笔记(18)多线程处理
.NET Framework 4.0 看(本质论第3版) .NET Framework 4.5 看(本质论第4版) .NET 4.0为多线程引入了两组新API:TPL(Task Parallel Li ...
- C#温故知新:《C#图解教程》读书笔记系列
一.此书到底何方神圣? 本书是广受赞誉C#图解教程的最新版本.作者在本书中创造了一种全新的可视化叙述方式,以图文并茂的形式.朴实简洁的文字,并辅之以大量表格和代码示例,全面.直观地阐述了C#语言的各种 ...
- C#刨根究底:《你必须知道的.NET》读书笔记系列
一.此书到底何方神圣? <你必须知道的.NET>来自于微软MVP—王涛(网名:AnyTao,博客园大牛之一,其博客地址为:http://anytao.cnblogs.com/)的最新技术心 ...
- Web高级征程:《大型网站技术架构》读书笔记系列
一.此书到底何方神圣? <大型网站技术架构:核心原理与案例分析>通过梳理大型网站技术发展历程,剖析大型网站技术架构模式,深入讲述大型互联网架构设计的核心原理,并通过一组典型网站技术架构设计 ...
- LOMA280保险原理读书笔记
LOMA是国际金融保险管理学院(Life Office Management Association)的英文简称.国际金融保险管理学院是一个保险和金融服务机构的国际组织,它的创建目的是为了促进信息交流 ...
随机推荐
- 【2022-11-28】Docker部署搭建Gitlab
一.环境准备 1. 准备一台虚拟机\或者购买服务器 2. 虚拟机硬件要求 2.1 内存不得少于4G,否则启动会报502错误,可自行百度解决,将虚拟机的swap分区调整为2G大小即可 2.2 CPU2核 ...
- 深入浅出OSI七层参考
本篇博客是笔者阅读<图解TCP/IP>所记录下的笔记,有兴趣的朋友可以去看一看这本书. OSI七层参考模型 本小节以电子邮件通信为例,分别来阐述OSI七层模型的每一层是如果进行通信处理 ...
- SQLMap入门——获取表中的字段名
查询表名之后,查询表中的字段名 python sqlmap.py -u http://localhost/sqli-labs-master/Less-1/?id=1 -D xssplatform -T ...
- 搭建漏洞环境及实战——搭建DVWA漏洞环境
DVWA是一款开源的渗透测试漏洞练习平台,其中内涵XSS.SQL注入.文件上传.文件包含.CSRF和暴力破解等各个难度的测试环境. 1.在安装时需要在数据库里创建一个数据库名,进入MySQL管理中的p ...
- 开局一张图,构建神奇的 CSS 效果
假设,我们有这样一张 Gif 图: 利用 CSS,我们尝试来搞一些事情. 图片的 Glitch Art 风 在这篇文章中 --CSS 故障艺术,我们介绍了利用混合模式制作一种晕眩感觉的视觉效果.有点类 ...
- vue项目 h5上拉加载(分页功能)
<template> <div class="receivable"> <div class="application-header fle ...
- [机器学习] t-SNE聚类算法实践指南
转载于比PCA降维更高级--(R/Python)t-SNE聚类算法实践指南-阿里云开发者社区 作者介绍:Saurabh.jaju2 Saurabh是一名数据科学家和软件工程师,熟练分析各种数据集 ...
- 【集成开发环境 (IDE)】Dev-Cpp下载与安装 [ 图文教程 ]
版权声明 本文作者:main工作室 本文链接:https://www.cnblogs.com/main-studio/p/17037280.html 版权声明:本文为 博客园 博主「main工作室」的 ...
- 又一重要进展发布!OpenMMLab算法仓支持昇腾AI训练加速
摘要:上海人工智能实验室的浦视开源算法体系(OpenMMLab)团队基于昇腾AI发布了MMDeploy 0.10.0版本,该版本已支持OpenMMLab算法仓库在昇腾异构计算架构CANN上的推理部署. ...
- AIGC 很火,想微调个自己的模型试试看?(不是卖课的)
去年,我们发布过一篇关于 DreamBooth 编程马拉松的活动通知,获得了全球社区的广泛关注和参与,中国社区的成员们也对这个活动有非常高的热情.同时我们也收到了后台留言反馈说参与活动需要使用的 Go ...