
The story of one latency spike
转自:https://blog.cloudflare.com/the-story-of-one-latency-spike/
A customer reported an unusual problem with our CloudFlare CDN: our servers were responding to some HTTP requests slowly. Extremely slowly. 30 seconds slowly. This happened very rarely and wasn't easily reproducible. To make things worse all our usual monitoring hadn't caught the problem. At the application layer everything was fine: our NGINX servers were not reporting any long running requests.
Time to send in The Wolf.
He solves problems.
Following the evidence
First, we attempted to reproduce what the customer reported—long HTTP responses. Here is a chart of of test HTTP requests time measured against our CDN:
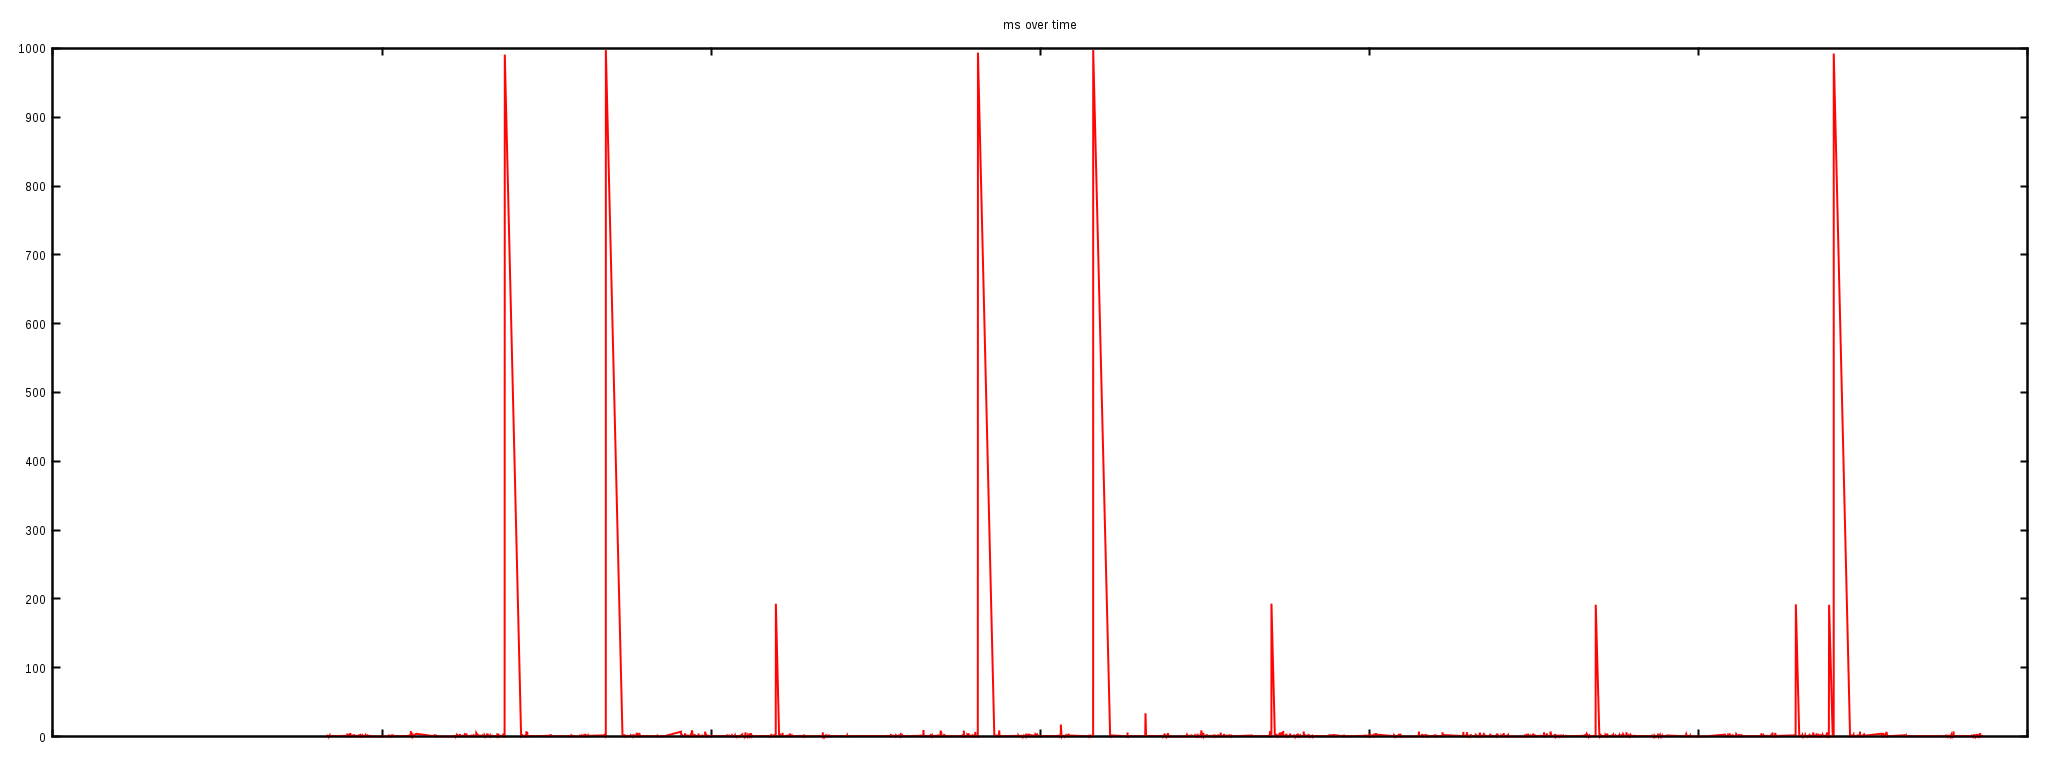
We ran thousands of HTTP queries against one server over a couple of hours. Almost all the requests finished in milliseconds, but, as you can clearly see, 5 requests out of thousands took as long as 1000ms to finish. When debugging network problems the delays of 1s, 30s are very characteristic. They may indicate packet loss since the SYN packets are usually retransmitted at times 1s, 3s, 7s, 15, 31s.
Blame the network
At first we thought the spikes in HTTP load times might indicate some sort of network problem. To be sure we ran ICMP pings against two IPs over many hours.
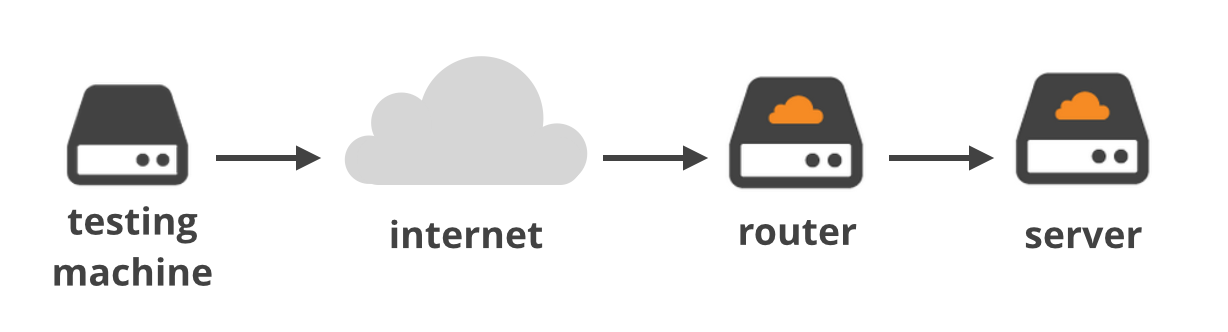
The first "ping" went from an external test machine to the router and showed a flat latency of about 20ms (with the exception of two peaks at about 120ms due to the slowness on the VPS being used to test from):
--- ping statistics ---

114890 packets transmitted, 114845 received, 0% packet loss

rtt min/avg/max/mdev = 10.432/11.025/122.768/4.114 ms
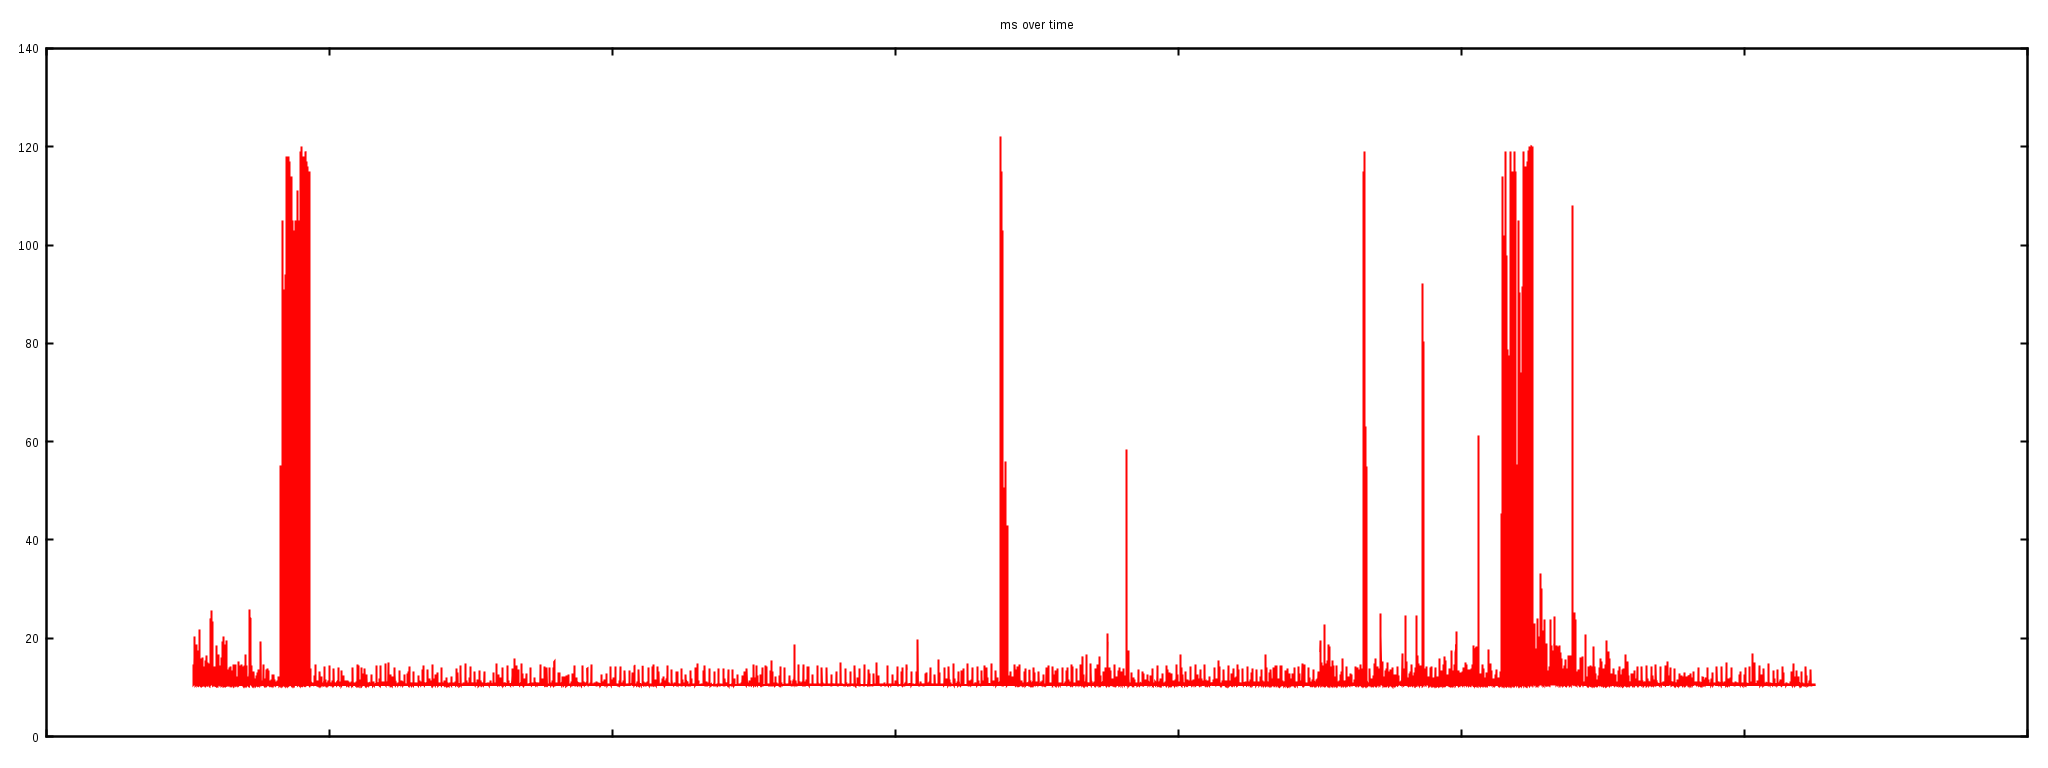
This ~20 ms is a decent round trip time (RTT) for that network and confirms the network connection was in fact stable.
The second "ping" session was launched from our external test machine against one of our Linux servers behind the router:
--- ping statistics ---

114931 packets transmitted, 114805 received, 0% packet loss

rtt min/avg/max/mdev = 10.434/11.607/1868.110/22.703 ms
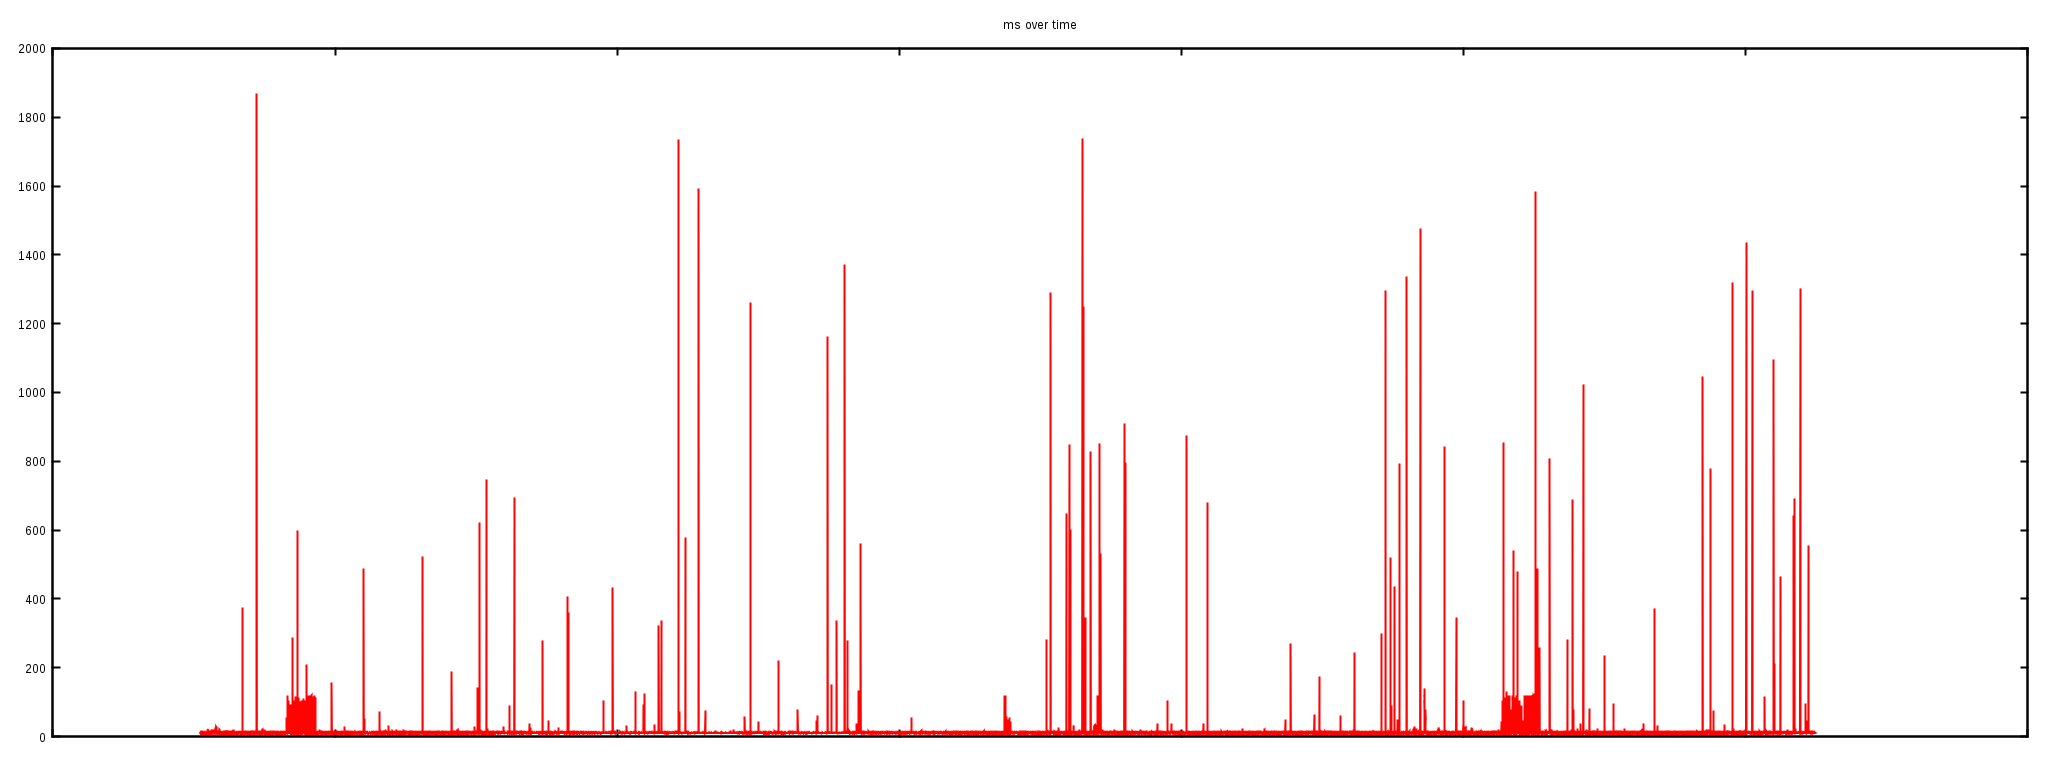
The "ping" output shows the max RTT being 1.8s. The gigantic latency spikes are also clearly visible on the graph.
The first experiment showed that the network between the external testing server and a router is not malfunctioning. But the second test, against a server just behind this router, revealed awful spikes. This indicates the problem is somewhere between the router and the server inside our datacenter.
tcpdump to the rescue
To verify the problem we ran a tcpdump on the affected server, trying to pinpoint the particular ICMP packets affected by a spike:
$ tcpdump -ttt -n -i eth2 icmp

00:00.000000 IP x.x.x.a > x.x.x.b: ICMP echo request, id 19283

00:01.296841 IP x.x.x.b > x.x.x.a: ICMP echo reply, id 19283
As you see from this tcpdump output, one particular ICMP packet was indeed received from the network at time 0, but for some reason the operating system waited 1.3s before answering it. On Linux network packets are handled promptly when the interrupt occurs; this delayed ICMP response indicates some serious kernel trouble.
Welcome the System Tap
To understand what's going on we had to look at the internals of operating system packet processing. Nowadays there are a plethora of debugging tools for Linux and, for no particular reason, we chose System Tap (stap). With a help of a flame graph we identified a function of interest: net_rx_action.
$ ./flame-kernel-global.sh

$ ./stackcollapse-stap.pl out.stap-stacks | ./flamegraph.pl > stap-kernel.svg
The flamegraph itself:
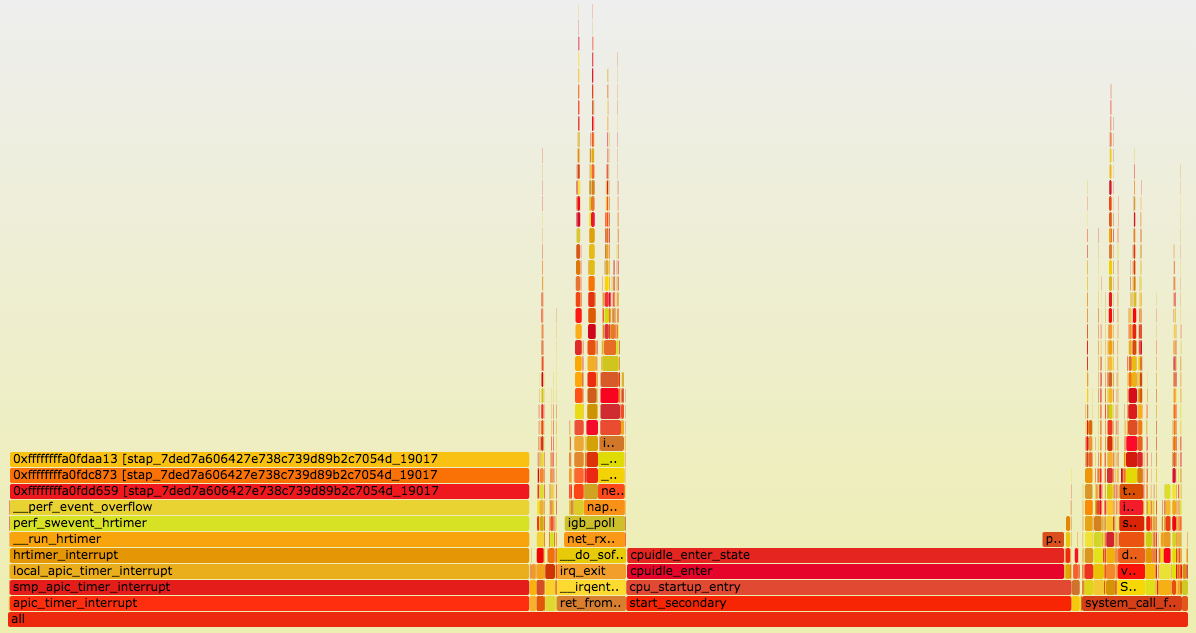
The net_rx_action function is responsible for handling packets in Soft IRQ mode. It will handle up to netdev_budget packets in one go:
$ sysctl net.core.netdev_budget

net.core.netdev_budget = 300
Here is a run of our stap script showing the latency distribution for this function:
$ stap -v histogram-kernel.stp 'kernel.function("net_rx_action)"' 30

Duration min:0ms avg:0ms max:23ms count:3685271

Duration (ms):

value |-------------------------------------------------- count

    0 |@@@@@@@@@@@@@@@@@@@@@@@@@@@@@@@@@@@@@@@@@@@@@  3685011

    1 |                                                   215

    2 |                                                    30

    4 |                                                     9

    8 |                                                     5

   16 |                                                     1

   32 |                                                     0
During a 30s run, we hit the net_rx_action function 3.6 million times. Out of these runs most finished in under 1ms, but there were some outliers. Most importantly one run took an astonishing 23ms.
Having a 23ms stall in low level packet handling is disastrous. It's totally possible to run out of buffer space and start dropping packets if a couple of such events get accumulated. No wonder the ICMP packets weren't handled in time!
Deeper into the rabbit hole
We repeated the procedure a couple more times. That is:
- We made a flame graph source.
- By trial and error figured out which descendant of
net_rx_actioncaused the latency spike source.
This procedure was pretty effective, and after a couple of runs we identified the culprit: the tcp_collapse function. Here's a summary of the latency measurements:
$ stap -v histogram-kernel.stp 'kernel.function("tcp_collapse")' 300

Duration min:0ms avg:3ms max:21ms count:1552
Over 300 seconds there were just about 1,500 executions of the tcp_collapse function. Out of these executions half finished in under 3ms, but the max time was 21ms.
Let's collapse the TCP
The tcp_collapse function is interesting. It turns out to be deeply intermixed with how the BSD sockets API works. To fully understand it let's start with a pub question:
If you set a "receive buffer size" on a TCP socket, what does it actually mean?
Go on, read the man page, dust off your Stevens. I'll wait.
The naive answer would go something along the lines of: the TCP receive buffer setting indicates the maximum number of bytes a read() syscall could retrieve without blocking.
While this is the intention, this is not exactly how it works. In fact, the receive buffer size value on a socket is a hint to the operating system of how much total memory it could use to handle the received data. Most importantly, this includes not only the payload bytes that could be delivered to the application, but also the metadata around it.
Under normal circumstances, a TCP socket structure contains a doubly-linked list of packets—the sk_buff structures. Each packet contains not only the data, but also the sk_buffmetadata (sk_buff is said to take 240 bytes). The metadata size does count against the receive buffer size counter. In a pessimistic case—when the packets are very short—it is possible the receive buffer memory is almost entirely used by the metadata.
Using a large chunk of receive buffer space for the metadata is not really what the programmer wants. To counter that, when the socket is under memory pressure complex logic is run with the intention of freeing some space. One of the operations is tcp_collapse and it will merge adjacent TCP packets into one larger sk_buff. This behavior is pretty much a garbage collection (GC)—and as everyone knows, when the garbage collection kicks in, the latency must spike.
Tuning the rmem
There are two ways to control the TCP socket receive buffer on Linux:
- You can set
setsockopt(SO_RCVBUF)explicitly. - Or you can leave it to the operating system and allow it to auto-tune it, using the
tcp_rmemsysctl as a hint.
At CloudFlare we use the latter approach and the receive buffer sizes are controlled by a sysctl:
$ sysctl net.ipv4.tcp_rmem

net.ipv4.tcp_rmem = 4096 5242880 33554432
This setting tells Linux to autotune socket receive buffers, and allocate between 4KiB and 32MiB, with a default start buffer of 5MiB.
Since the receive buffer sizes are fairly large, garbage collection could take a long time. To test this we reduced the max rmem size to 2MiB and repeated the latency measurements:
$ sysctl net.ipv4.tcp_rmem

net.ipv4.tcp_rmem = 4096 1048576 2097152

$ stap -v histogram-kernel.stp 'kernel.function("tcp_collapse")' 300

Duration min:0ms avg:0ms max:3ms count:592
Now, these numbers are so much better. With the changed settings the tcp_collapsenever took more than 3ms!
We verified that the net_rx_action latency also improved:
$ stap -v histogram-kernel.stp 'kernel.function("net_rx_action")'

Duration min:0ms avg:0ms max:3ms count:3567235

Duration (ms):

value |-------------------------------------------------- count

    0 |@@@@@@@@@@@@@@@@@@@@@@@@@@@@@@@@@@@@@@@@@@@@@  3567196

    1 |                                                    36

    2 |                                                     3

    4 |                                                     0
With the rmem changes the max latency of observed net_rx_action times dropped from 23ms to just 3ms.
Summary
Setting the rmem sysctl to only 2MiB is not recommended as it could affect the performance of high throughput, high latency connections. On the other hand reducing rmem definitely helps to alleviate the observed latency issue. We settled with 4MiB max rmem value which offers a compromise of reasonable GC times and shouldn't affect the throughput on the TCP layer.
But most importantly, we showed how to use System Tap to debug latency issues. Use our scripts to measure the net_rx_action latency on your system!
Our simple Stap scripts are available on GitHub.
The fixes mentioned in this article have already been rolled out. All our customers should feel just a tiny bit faster :)
If it sounds interesting to work on this type of debugging... we're hiring in London, Singapore and San Francisco!
The story of one latency spike的更多相关文章
- [译] OpenStack Liberty 版本中的53个新变化
一个新的秋季,一个新的OpenStack 版本.OpenStack 的第12个版本,Liberty,在10月15日如期交付,而且目前发行版本已经备好了.那么我们期望能从过去六个月时间的开发中获得些什么 ...
- SYN 和 RTO
转自:https://huoding.com/2017/08/13/628 前两天,我在微博上推荐了一篇朝花夕拾的文章:The story of one latency spike,文章中介绍了 cl ...
- Lock-less and zero copy messaging scheme for telecommunication network applications
A computer-implemented system and method for a lock-less, zero data copy messaging mechanism in a mu ...
- Lock-less buffer management scheme for telecommunication network applications
A buffer management mechanism in a multi-core processor for use on a modem in a telecommunications n ...
- Redis6通信协议升级至RESP3,一口气看完13种新数据类型
原创:微信公众号 码农参上,欢迎分享,转载请保留出处. 在前面的文章 Redis:我是如何与客户端进行通信的 中,我们介绍过RESP V2版本协议的规范,RESP的全程是Redis Serializa ...
- FPGA中的delay与latency
delay和latency都有延迟的意义,在FPGA中二者又有具体的区别. latency出现在时序逻辑电路中,表示数据从输入到输出有效经过的时间,通常以时钟周期为单位. delay出现在组合逻辑电路 ...
- 网络设计中需要考虑的时延latency差异
Jeff Dean提到不同数据访问方式latency差异 Numbers Everyone Should Know L1 cache reference 0.5 ns Branch mispredic ...
- Latency
1)在网络,延迟时间(latency),同义词为延迟,是表示从特定点得到一个数据包(packet)所花的时间.在一些情况下(例如,AT&T),延迟时间用发送出包到回到发送端这个运行一周的时间就 ...
- 【虚拟化实战】存储设计之六latency
在[虚拟化实战]存储设计之五IOPS中我们讲了评估存储性能的三个关键指标.也就是Throughput,IOPs和latency.以及三者之间的关系.本文深入介绍Latency过高的原因和一些建议. L ...
随机推荐
- Android LaunchAnyWhere (Google Bug 7699048)漏洞具体解释及防御措施
開始 近日,Google修复一个组件安全的漏洞LaunchAnyWhere(Google Bug 7699048). 这个漏洞属于Intend Based提取漏洞,攻击者利用这个漏洞,能够突破了应用间 ...
- [ACM] POJ 1942 Paths on a Grid (组合)
Paths on a Grid Time Limit: 1000MS Memory Limit: 30000K Total Submissions: 21297 Accepted: 5212 ...
- Codeforces Round #388 (Div. 2) C. Voting
题意:有n个人,每个人要么是属于D派要么就是R派的.从编号1开始按顺序,每个人都有一次机会可以剔除其他任何一个人(被剔除的人就不在序列中也就失去了剔除其他人的机会了):当轮完一遍后就再次从头从仅存的人 ...
- WCF学习笔记——不支持内容类型 text/xml; charset=utf-8
我在使用WCF的时候,客户端运行报错: 不支持内容类型 text/xml; charset=utf-8 原因是WCF服务做了修改.刷新客户端的服务引用,问题消失 =================== ...
- 海思3518e mpp2/sample/venc makefile简析
http://blog.csdn.net/u011003120/article/details/51324567
- git 拉取和获取 pull 和 fetch 区别【转】
本文转载自:http://blog.csdn.net/u010094934/article/details/52775653 使用git 直接提交的话 直接 push 获取最新版本 有两种 ...
- Android系统Recovery工作原理之使用update.zip升级过程分析(六)---Recovery服务流程细节【转】
本文转载自:http://blog.csdn.net/mu0206mu/article/details/7465439 Android系统Recovery工作原理之使用update.zip升级过程分 ...
- 98.Ext.form.Label组件的基本用法
转自:https://www.cnblogs.com/kelly/archive/2009/06/05/1496897.html 本篇介绍Ext.form.Label组件的基本用法: 这里通过上一篇介 ...
- 纯CSS 实现关闭图标 icon
本文介绍关闭 icon 的实现.具体如下 1.html部分 <span id="close"></span> 2.css部分 #close { displa ...
- lowbit( )运算
--------开始-------- lowbit (n) 定义为非负整数n在二进制表示下“最低位的1及其后面所有的0构成的数值. 比如: n = 10 的二进制下为1010,则lowbit (n) ...