Graph Visualization
1. 什么是graph visualization?
Graph visualization is a way of representing structural information as diagrams of abstract graphs and networks. It has important applications in networking, bioinformatics, software engineering, database and web design, machine learning, and in visual interfaces for other technical domains.
Graphviz is open source graph visualization software. It has several main layout programs. See the gallery for sample layouts.
2. 怎样安装graph visualization?
我的测试系统安装:sudo apt-get install graphviz
3. graph visulzation 的layout?
dot − filter for drawing directed graphs
neato − filter for drawing undirected graphs
twopi − filter for radial layouts of graphs
circo − filter for circular layout of graphs
fdp − filter for drawing undirected graphs
sfdp − filter for drawing large undirected graphs
patchwork − filter for squarified tree maps
osage − filter for array-based layouts
graphviz是贝尔实验室开发的一个开源的工具包,它使用一个特定的DSL(领域特定语言)——Dot作为脚本语言,然后使用布局引擎解析脚本并完成自动布局。Graphviz的设计初衷是对图进行自动布局(有向图、无向图、),可以使用dot脚本来定义图形元素,选择一定的算法进行布局,通过对输入脚本的解析,分析出其中的点,边以及子图,然后根据属性进行绘制,继而将结果以自己需要的格式导出来。
dot语言的定义:(http://www.graphviz.org/content/dot-language)
这里我只介绍一下常用的:
1. dot---基本语法
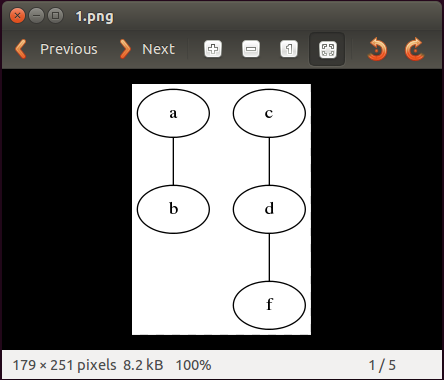
graph(无向图)表示图,然后{}中的内容是对图的描述,注释风格和C类似(“//”用于单行注释,/**/用于多行注释)。如一个无向图
graph graph1

{

	a -- b

	c -- d

	d -- f

}
执行 dot -Tpng -o 1.png 1.dot 后 xdg-open 1.png 显示图片
2.dot---节点
DOT中,节点可以不用声明直接使用。每个节点首次出现的名称做为该节点的唯一标识。
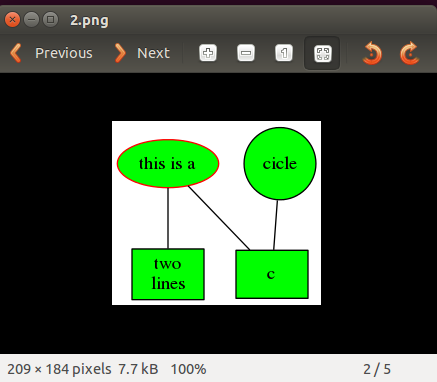
属性设置:对节点可以设置的常见通用属性有shape、label、style、color、fillcolor、rank等,对于不同的形状,可能还有不同的属性可以设置,如对于多边形可以设置边数等。节点属性设置时,node用于设置默认属性(对设置位置之后的点有效),在点后面用[]设置单独一个点的属性。
 graph node_setting{

     node [shape = "box", style = "filled", color = "black", fillcolor = "green"]//设置节点的默认形状,类型,颜色,填充颜色

     a [shape = "ellipse", color = "red", label = "this is a"]//设置节点a的颜色,注意默认节点类型是filled,所以这里的color只是设置a的边框颜色

     b [label = "two\nlines"]   //label支持'\n'换行

     a -- b

     a -- c     //如果不需要设置c的属性,可以不用声明c而直接使用

     node [shape = "circle"]

     d [label = "cicle"]

     c -- d      //d使用之前最后出现的node设置,形状为circle

     {rank = same a, d}     //设置a和d在同一层

 }
执行 dot -Tpng -o 2.png 2.dot 后 xdg-open 2.png 显示图片
3.dot --- 边
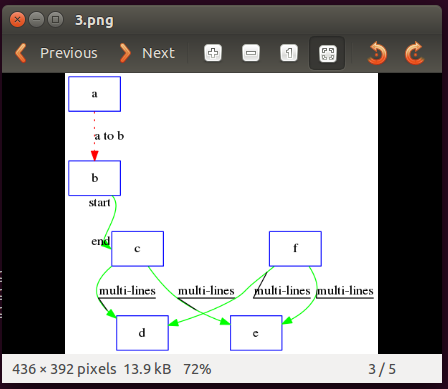
边有有向边和无向边两种,无向边用于无向图,有向边用于有向图,不可混用。
属性设置:边的常见设置有style、color、weight、label、labelfontcolor、headlabel、taillabel、decorate等,对于有向边,还可以设置边的起点位置等(用n、e、s、w和相邻字母的组合表示位置)。和节点类似的,边属性设置时,用edge[]设置默认属性,在边之后用[]设置单独一条边的属性。
 digraph edge_settings{

     edge [color = "green", decorate = false]        //设置边的默认属性

     node [shape = "polygon", sides = , color = "blue"]

     a -> b [style = "dotted", color = "red", label = "a to b"]  //设置style、color、label

     b: se -> c: w [headlabel = "end",  taillabel = "start"]     //设置边从b的“东南方”出发,从c的“西方”结束,设置有向边起点和重点的label

     edge [style = "bond", decorate = true]      //设置之后的边加粗并且标签和连线之间有线标注

     //c -> d

     {c, f} -> {d, e} [label = "multi-lines"]    //可以用这种方式同时画多条边

 }
执行 dot -Tpng -o 3.png 3.dot 后 xdg-open 3.png 显示图片
4.dot ---有向图
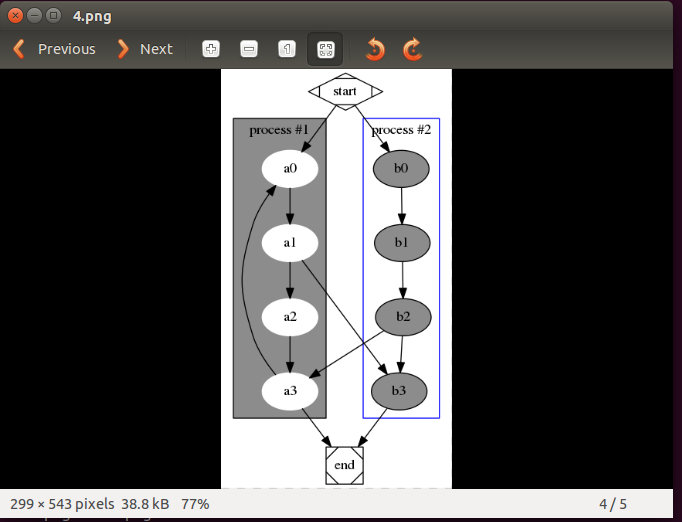
从前面的例子中已经可以看出,DOT语言可以描述无向图和有向图两种图,graph标识无向图,digraph标识有向图。
属性设置:在一个图的开头写入属性即可设置图形的属性,常用的图形属性有size、label、labelloc、labeljust、bgcolor、rankdir等。
子图,可以进行和“父图”类似的设置,唯一注意的是子图必须以"cluster"做为名称的开始。
 digraph graph_settings {

     start [shape = "Mdiamond"]

         end [shape = "Msquare"]

         subgraph cluster_sub1 {

             label = "process #1"

                 labelloc = "t"

                 bgcolor = "gray55"

                 node [style = "filled", color = "white"]

                 a0 -> a1 -> a2 -> a3 -> a0

         }

     subgraph cluster_sub2 {

         label = "process #2"

             labelloc = "t"

             color = "blue"

             node [style = "filled", color = "black", fillcolor = "gray55"]

             b0 -> b1 -> b2 -> b3

     }

     start -> {a0, b0}

     a1 -> b3

         b2 -> a3

         {a3, b3} -> end

 }
执行 dot -Tpng -o 4.png 4.dot 后 xdg-open 4.png 显示图片
上面的4个例子中都是写完.dot脚本后,执行dot命令才生成图片显示。
那么,有没有工具能让写脚本的同时就能看到图形呢?of course!!!
vimdot
其实graph visualization 官网中介绍了很多的工具,就需要自己一个去试着玩玩,找到适合自己咯
Graph Visualization的更多相关文章
- 流程图 Graphviz - Graph Visualization Software
0.目录 1.参考 https://www.processon.com/ 应该值得一试 知乎 用什么软件画流程图? 9款国内外垂直领域的在线作图工具[可代替visio] 程序员必知的七个图形工具 说 ...
- Graphviz - Graph Visualization Software 开源可视化绘图工具(visio 类)
http://www.graphviz.org/Download_windows.php Welcome to Graphviz Available translations: Romanian, ...
- 边捆绑: Content Importance Based Edge Bundling for Graph Visualization
Problem 当图所要表达的信息较多时, 图中可能会充满交叉的线[1-2], 甚至整个显示空间都被点.线所覆盖, 这时想通过观察来获取图中的重要信息将会变得非常困难, 这种现象称为图的视觉混乱. K ...
- 40 JavaScript Chart and Graph Libraries for Developers--reference
reference:http://www.egrappler.com/javascript-chart-and-graph-libraries-for-developers/ BY TEAMEGRAP ...
- Visualizing MNIST with t-SNE, MDS, Sammon’s Mapping and Nearest neighbor graph
MNIST 可视化 Visualizing MNIST: An Exploration of Dimensionality Reduction At some fundamental level, n ...
- python函数调用关系图(python call graph)
由于要重构项目的部分代码,要整理好主要的函数调用关系,不想自己看代码慢慢画出结构,想找出一种通用的,节省人力的方法得出函数间的调用关系图,于是发现以下几个工具.(内网没装好graphviz,还没真正用 ...
- Tensorflow 之 TensorBoard可视化Graph和Embeddings
windows下使用tensorboard tensorflow 官网上的例子程序都是针对Linux下的:文件路径需要更改 tensorflow1.1和1.3的启动方式不一样 :参考:Running ...
- ElasticSearch 5学习(2)——Kibana+X-Pack介绍使用(全)
Kibana是一个为 ElasticSearch 提供的数据分析的 Web 接口.可使用它对日志进行高效的搜索.可视化.分析等各种操作.Kibana目前最新的版本5.0.2,回顾一下Kibana 3和 ...
- JavaScript资源大全中文版(Awesome最新版)
Awesome系列的JavaScript资源整理.awesome-javascript是sorrycc发起维护的 JS 资源列表,内容包括:包管理器.加载器.测试框架.运行器.QA.MVC框架和库.模 ...
随机推荐
- 【线性基】【贪心】【独立环】bzoj2115 [Wc2011] Xor
网上到处都是题解,自己画个图也很好理解.虽然环的个数很多,但是都可以通过独立环之间异或出来,不用管. 独立环求法:生成树之后,每次向图里添加非树边(u,v),则这个独立环的异或和为sum[u]^sum ...
- 通过UIImagePickerController选取的图片名称信息
- (void)imagePickerController:(UIImagePickerController *)picker didFinishPickingMediaWithInfo:(NSDic ...
- Linux批量管理工具Ansible
Ansible-批量linux管理工具:https://github.com/ansible/ansible Ansible有如下优点: 1.轻量级,他不需要去客户端安装agent,更新时,只需要在操 ...
- 【spring mvc】spring mvc POST方式接收单个字符串参数,不加注解,接收到的值为null,加上@RequestBody,接收到{"uid":"品牌分类大”},加上@RequestParam报错 ---- GET方式接收单个参数的方法
spring mvc POST方式 接收单个参数,不加任何注解,参数名对应,接收到的值为null spring mvc POST方式 接收单个参数,加上@RequestBody,接收到参数格式:{&q ...
- Shader and Program编程基本概念 - 转
原地址:http://blog.csdn.net/myarrow/article/details/7737313 一.本文关注的问题: • Shader and program 对象介绍• 创建并编译 ...
- 重新学习vue基础
1.创建vue实例 var vm = new Vue({ el: '#example', //选择元素 data: {a:1} //基本数据 }) 2.模板语法 (一)基本语法 <span> ...
- jenkins结合docker
参考:https://m.aliyun.com/yunqi/articles/80459?spm=5176.mtagdetail.0.0.vJJ8Gj 上面这篇文章讲述了一种工作思路:CICD(持续集 ...
- C#之Hello World(入门 )
C#是一种简单.现代.面向对象和类型安全的编程语言. C#由C和C++发展而来.C#(英文发音C sharp)牢固地植根于C和C++语言族谱中,是Microsoft专门为使用.NET平台而创建的. • ...
- pandas判断缺失值的办法
参考这篇文章: https://blog.csdn.net/u012387178/article/details/52571725 python pandas判断缺失值一般采用 isnull(),然而 ...
- 【重点突破】—— Vue2.0 transition 动画Demo实践填坑
前言:vue1.0版本和2.0版本的过渡系统改变是很大的,具体请详看文档介绍.本文转载自郭锦荣的博客,一共列举了四种transition的使用实践,分别是css过渡.css动画.javascript钩 ...