
R语言低级绘图函数-arrows
arrows 函数用来在一张图表上添加箭头,只需要分别指定起始坐标和终止坐标,就可以添加箭头了,还可以通过一些属性对箭头的形状,大小进行调整
基本用法:
xo, yo 指定起始点的x和y坐标,x1, y1 指定终止点的x和y坐标, 代码示例如下:
plot(1:5, 1:5, xlim = c(0,6), ylim = c (0,6), type = "n")

arrows(x0 = 1, y0 = 1, x1 = 4, y1 = 4)
效果如下:

x0, y0,x1,y1 支持一次设置多个值,同时画多个箭头,示例代码如下:
plot(1:5, 1:5, xlim = c(0,6), ylim = c (0,6), type = "n")

arrows(x0 = c(1, 1),  y0 = c(1, 2),  x1 = c(4, 4), y1 = c(4, 5))
效果如下:

参数调整:
length : 该参数一次只能设置一个值,默认值为0.25, 为了调整不同箭头的大小,建议分别设置,用法如下:
par(mfrow = c(1,3))

plot(1:5, 1:5, xlim = c(0,6), ylim = c (0,6), type = "n", main = "length = 0.1")

arrows(x0 = 1, y0 = 1, x1 = 4, y1 = 4, length = 0.1)

plot(1:5, 1:5, xlim = c(0,6), ylim = c (0,6), type = "n", main = "length = 0.5")

arrows(x0 = 1, y0 = 1, x1 = 4, y1 = 4, length = 0.5)

plot(1:5, 1:5, xlim = c(0,6), ylim = c (0,6), type = "n", main = "length = 1")

arrows(x0 = 1, y0 = 1, x1 = 4, y1 = 4, length = 1)
效果如下:
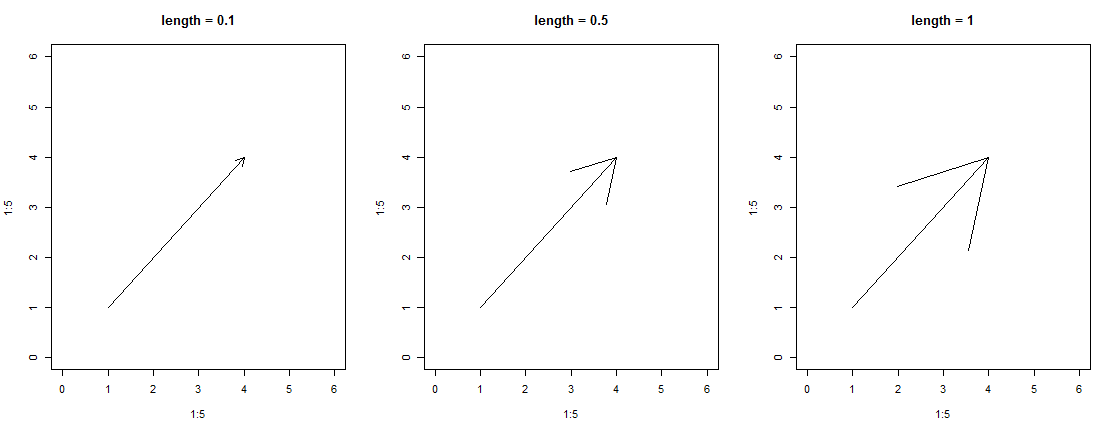
code : 调整箭头的类型,一共有1,2,3,4 共四种类型,该参数一次只能设置一个值,四种类型具体可以看下面的效果图
代码如下:
par(mfrow = c(1,3))

plot(1:5, 1:5, xlim = c(0,6), ylim = c (0,6), type = "n", main = "code = 1")

arrows(x0 = 1, y0 = 1, x1 = 4, y1 = 4, code = 1)

plot(1:5, 1:5, xlim = c(0,6), ylim = c (0,6), type = "n", main = "code = 2")

arrows(x0 = 1, y0 = 1, x1 = 4, y1 = 4, code = 2)

plot(1:5, 1:5, xlim = c(0,6), ylim = c (0,6), type = "n", main = "code = 3")

arrows(x0 = 1, y0 = 1, x1 = 4, y1 = 4, code = 3)
效果图如下:

code = 1 代表箭头由终止点指向起始点
code = 2 是默认值,箭头由起始点指向终止点
code = 3 代表在起始点和终止点两端都标上箭头
angle : 设置箭头的角度,默认值是45,该参数一次只能设置一个值,代码如下:
par(mfrow = c(1,3))

plot(1:5, 1:5, xlim = c(0,6), ylim = c (0,6), type = "n", main = "angle = 15")

arrows(x0 = 1, y0 = 1, x1 = 4, y1 = 4, length = 0.5, angle = 15)

plot(1:5, 1:5, xlim = c(0,6), ylim = c (0,6), type = "n", main = "angle = 45")

arrows(x0 = 1, y0 = 1, x1 = 4, y1 = 4, length = 0.5, angle = 45)

plot(1:5, 1:5, xlim = c(0,6), ylim = c (0,6), type = "n", main = "angle = 60")

arrows(x0 = 1, y0 = 1, x1 = 4, y1 = 4, length = 0.5, angle = 60)
效果图如下:

除了上面的针对arrows 的特殊参数之外,也支持一些通用的参数,col , lty ,lwd 等
代码如下:
plot(1:5, 1:5, xlim = c(0,6), ylim = c (0,6), type = "n")

arrows(x0 = 1, y0 = 1, x1 = 4, y1 = 4, col = "red", lwd = 2, lty = 3)
效果图如下:

R语言低级绘图函数-arrows的更多相关文章
- R语言低级绘图函数-symbols
严格意义上将symbols 并不能算是一个低级的绘图函数,因为它不仅可以在一幅已经存在的图标上添加元素,还可以创建一张新的图表 鉴于它绘图时的灵活性,我把它归入到低级绘图函数中 symbols 可以创 ...
- R语言低级绘图函数-abline 转载
abline 函数的作用是在一张图表上添加直线, 可以是一条斜线,通过x或y轴的交点和斜率来确定位置:也可以是一条水平或者垂直的线,只需要指定与x轴或y轴交点的位置就可以了 常见用法: 1)添加直线 ...
- R语言低级绘图函数-grid
grid 函数用来在一张图表上添加网格线, 基本用法:默认在添加刻度线的地方添加网格线 plot(1:5, 1:5, xlim = c(0,6), ylim = c (0,6), type = &qu ...
- R语言低级绘图函数-axis
axis函数用来在一张图表上添加轴线,区别于传统的x轴和y轴,axis 允许在上,下,左, 右4个方向添加轴线 以x轴为例,一条轴线包含3个元素,水平的一条横线,叫做axis line , 刻度线, ...
- R语言低级绘图函数-title
title 函数用来在一张图表上添加标题 基本用法: main 表示主标题,通常位于图像的上方, sub 表示副标题,位于图像的下方, xlab 表示x轴的标签,ylab 表示y轴的标签 par(om ...
- R语言低级绘图函数-text
text函数用来在一张图表上添加文字,只需要指定对应的x和y坐标,以及需要添加的文字内容就可以了 基本用法: plot(1:5, 1:5, xlim = c(0,6), ylim = c (0,6), ...
- R语言低级绘图函数-rect
rect 函数用来在一张图上添加矩形,只需要指定左下角和右上角的坐标的位置,就可以画出一个矩形 基本用法: plot(1:5, 1:5, xlim = c(0,6), ylim = c (0,6), ...
- R语言低级绘图函数-abline
abline 函数的作用是在一张图表上添加直线, 可以是一条斜线,通过x或y轴的交点和斜率来确定位置:也可以是一条水平或者垂直的线,只需要指定与x轴或y轴交点的位置就可以了 常见用法: 1)添加直线 ...
- R语言低级绘图函数画个温度计
x <- 1:2 y <- runif(2,0,100) par(mar=c(4,6,2,6)) plot(x,y,type="n",xlim=c(0.5,2.5),y ...
随机推荐
- 使用国内镜像composer安装laravel
1.安装 Laravel,创建blog项目 首先先说一下直接安装的方法,要想使用这个方法,首先要FQ(这是我们的基本国情决定的).这样的安装方式有两种: ①.全局安装 使用命令Laravel Inst ...
- env命令详解
env命令时gnu的coreutils包内的一个软件,它的功能是:在一个修改后的环境里执行命令. 通俗的讲:一个linux软件可能被安装在好几个地方,举个例子:在最新的centos中perl的版本为5 ...
- 写个关于使用cocostudio Armature实现动画自由切换的小demo
这是一个关于使用cocostudio实现动画自由切换的小demo auto sprite =Sprite::create("background.png"); sprite-> ...
- Jquery获得子页面中某个元素
本页面中有子框架iframe1.获取iframe1中元素 $("input[name$='svNo']", window.frames["iframe1"].d ...
- TransitiveClosure
http://acm.nudt.edu.cn/~twcourse/TransitiveClosure.html https://en.wikipedia.org/wiki/Closure_(mathe ...
- ny236 心急的C小加 hdoj1051 Wooden Sticks
心急的C小加 时间限制:1000 ms | 内存限制:65535 KB 难度:4 描述 C小加有一些木棒,它们的长度和质量都已经知道,需要一个机器处理这些木棒,机器开启的时候需要耗费一个单位的时间 ...
- $.cookie is not a function;原因及解决办法
一.没有引入jQuery库文件 二.jQuery库文件和jquery.cookie.js文件的顺序问题.须先引入jQuery库文件再引入cookie插件文件 三.页面的加载顺序所导致 大家的问题大多出 ...
- 三、为什么String在Java中是不可更改的
String在Java中是个不可更改的类.一个不可更改的类简单来说就是这个类的所有实例是不可以更改的.所有的实例信息在创建的时候被初始化而且信息是不可以更改的.不可更改的类有很多好处.这篇文章总结了为 ...
- tab栏切换fengz
<!DOCTYPE html> <html lang="en"> <head> <meta charset="UTF-8&quo ...
- C#中模拟用户登陆SharePoint网站
自动化测试一个SharePoint网站,首先要登陆,我们今天就模拟一下用户登陆SharePoint网站的过程,这一过程可以通过其他方式完成模拟,比如通过Coded UI Test录制脚本会更方便,但是 ...