
R语言低级绘图函数-axis
axis函数用来在一张图表上添加轴线,区别于传统的x轴和y轴,axis 允许在上,下,左, 右4个方向添加轴线
以x轴为例,一条轴线包含3个元素,水平的一条横线,叫做axis line , 刻度线, 叫做tick line, 对应的标签 labels
基本用法:
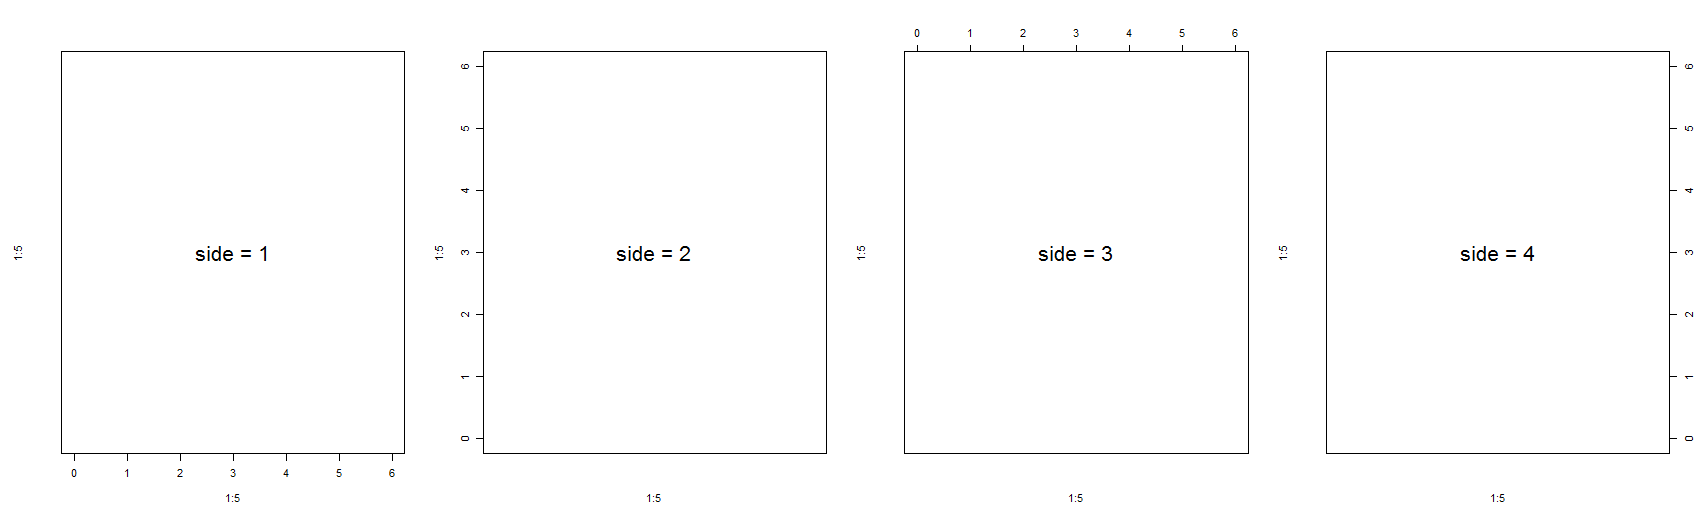
通过side 参数设置需要添加的轴线的方向,从下边开始,沿逆时针方向,数字为1到4
代码示例:
par(oma = c(1, 1, 1, 1), mfrow = c(1, 4))

plot(1:5, 1:5, xlim = c(0,6), ylim = c (0,6), type = "n", axes = F)

text(x = 3, y = 3, labels = "side = 1", cex = 2)

box()

axis(side = 1)

plot(1:5, 1:5, xlim = c(0,6), ylim = c (0,6), type = "n", axes = F)

text(x = 3, y = 3, labels = "side = 2", cex = 2)

box()

axis(side = 2)

plot(1:5, 1:5, xlim = c(0,6), ylim = c (0,6), type = "n", axes = F)

text(x = 3, y = 3, labels = "side = 3", cex = 2)

box()

axis(side = 3)

plot(1:5, 1:5, xlim = c(0,6), ylim = c (0,6), type = "n", axes = F)

text(x = 3, y = 3, labels = "side = 4", cex = 2)

box()

axis(side = 4)
效果图如下:
参数设置:
at : 需要添加刻度的数值,默认会根据变量的取值范围计算几个合适的刻度,也可以手工指定
代码示例:
plot(1:5, 1:5, xlim = c(0,6), ylim = c (0,6), type = "n", axes = F)

box()

axis(side = 1, at = c(0, 2, 4, 6))
效果图如下:

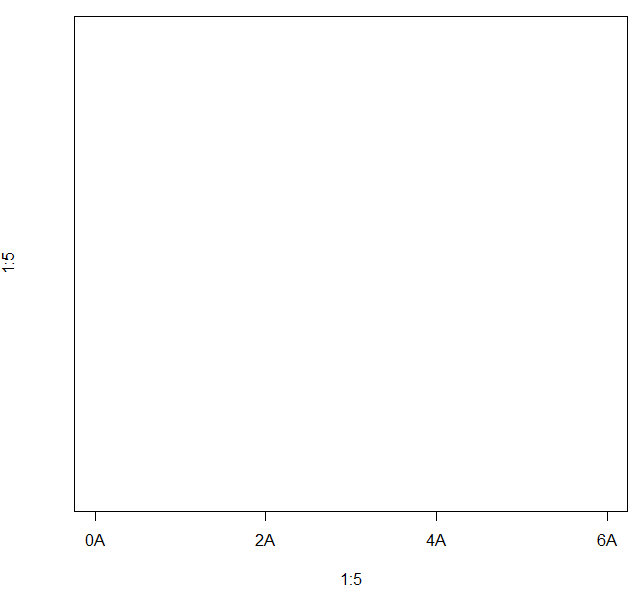
lables : 指定在刻度上需要标记的内容,默认就是刻度对应的值
代码示例:
plot(1:5, 1:5, xlim = c(0,6), ylim = c (0,6), type = "n", axes = F)

box()

axis(side = 1, at = c(0, 2, 4, 6), labels = paste(c(0, 2, 4, 6), "A", sep = ""))
效果图如下:
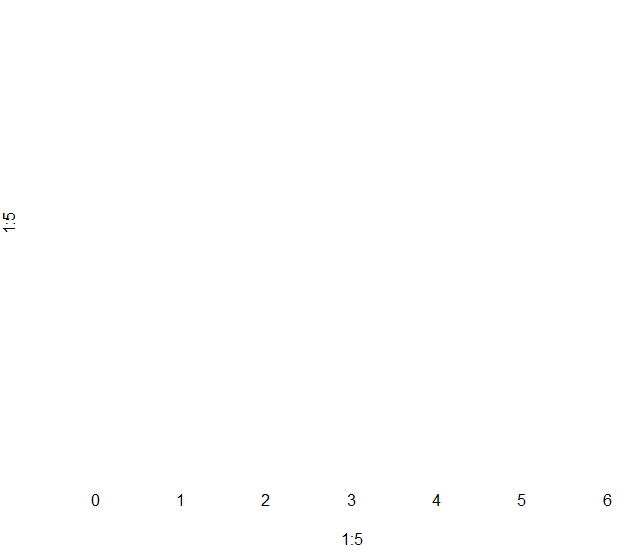
tick : 逻辑值,是否显示轴线,包括刻度线和对应的轴线, FALSE 表示不显示
代码示例:
plot(1:5, 1:5, xlim = c(0,6), ylim = c (0,6), type = "n", axes = F)

axis(side = 1, tick = F)
效果图:
line : 轴线的位置
代码示例:
plot(1:5, 1:5, xlim = c(0,6), ylim = c (0,6), type = "n", axes = F)

box()

axis(side = 1, line = 1)
效果图如下:

lwd : 设置 axis line 和 tick line 的宽度
代码示例:
plot(1:5, 1:5, xlim = c(0,6), ylim = c (0,6), type = "n", axes = F)

box()

axis(side = 1, line = 1, lwd = 2)
效果图如下:

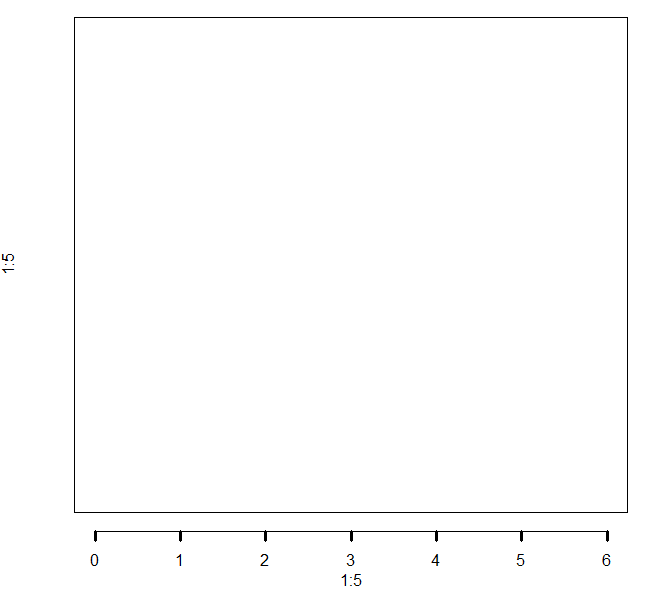
lwd.tick : 设置tick line的宽度
代码示例:
plot(1:5, 1:5, xlim = c(0,6), ylim = c (0,6), type = "n", axes = F)

box()

axis(side = 1, line = 1, lwd = 1, lwd.tick = 2)
效果图如下:
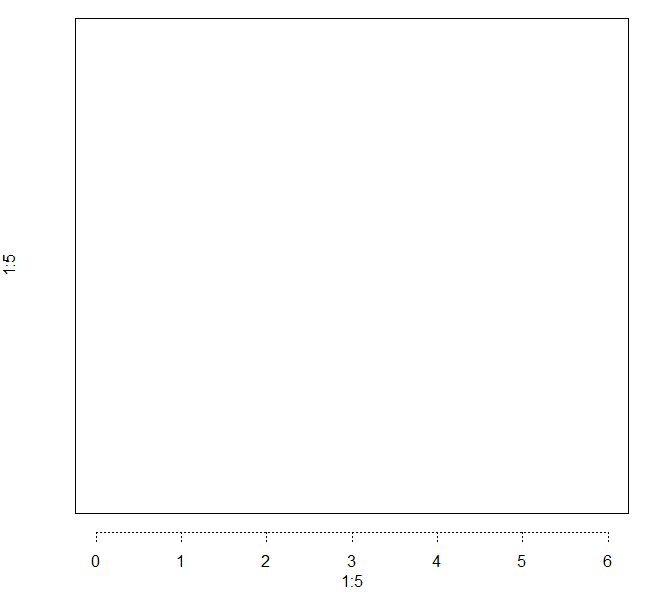
lty : 设置axis line 和tick line的线条类型
代码示例:
plot(1:5, 1:5, xlim = c(0,6), ylim = c (0,6), type = "n", axes = F)

box()

axis(side = 1, line = 1, lty = 3)
效果图如下:
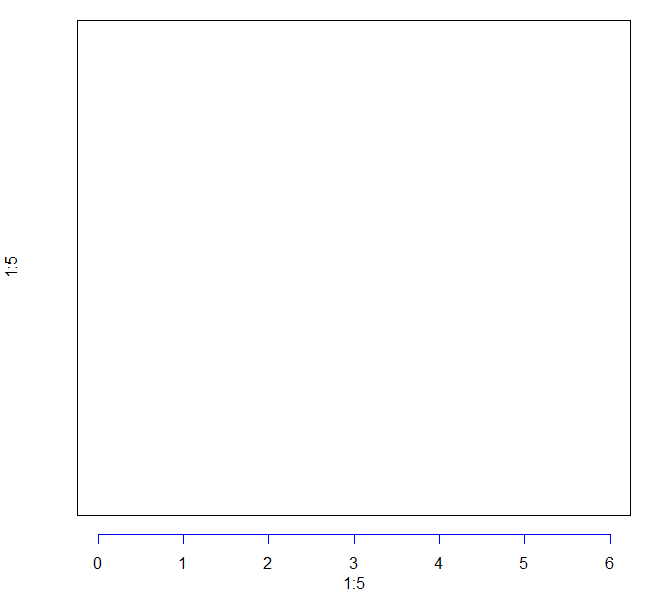
col : 设置axis line 和 tick.line 的线条颜色
代码示例:
plot(1:5, 1:5, xlim = c(0,6), ylim = c (0,6), type = "n", axes = F)

box()

axis(side = 1, line = 1, col = "blue")
效果图如下:
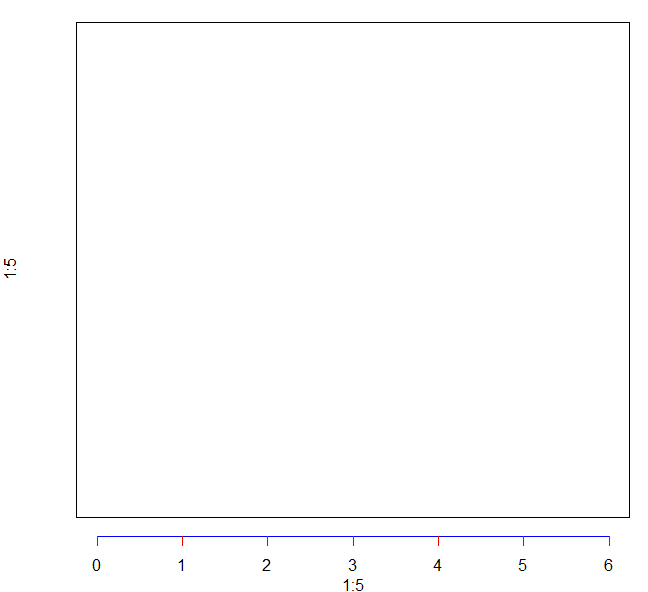
col.ticks : 设置tick line的颜色
代码示例:
plot(1:5, 1:5, xlim = c(0,6), ylim = c (0,6), type = "n", axes = F)

box()

axis(side = 1, line = 1, col = "blue", col.ticks = "red")
效果图如下:
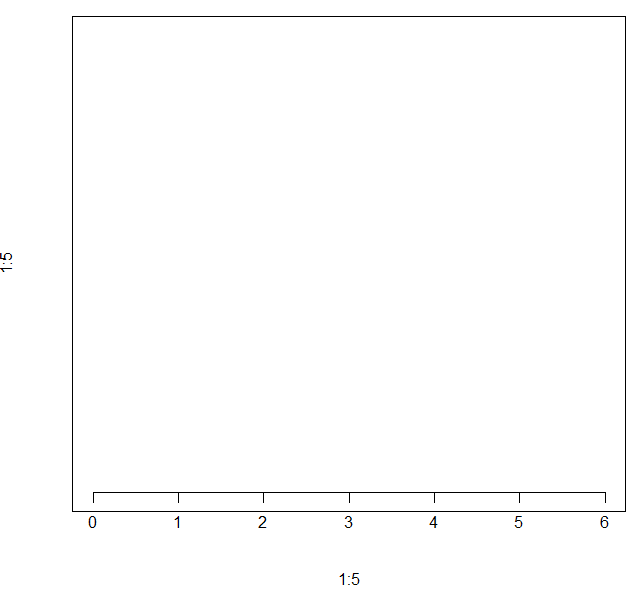
pos : 对轴线的位置进行调整,当pos 设置了对应的值之后会覆盖line 参数的值
代码示例:
plot(1:5, 1:5, xlim = c(0,6), ylim = c (0,6), type = "n", axes = F)

box()

axis(side = 1, pos = 1)
效果图如下:
R语言低级绘图函数-axis的更多相关文章
- R语言低级绘图函数-symbols
严格意义上将symbols 并不能算是一个低级的绘图函数,因为它不仅可以在一幅已经存在的图标上添加元素,还可以创建一张新的图表 鉴于它绘图时的灵活性,我把它归入到低级绘图函数中 symbols 可以创 ...
- R语言低级绘图函数画个温度计
x <- 1:2 y <- runif(2,0,100) par(mar=c(4,6,2,6)) plot(x,y,type="n",xlim=c(0.5,2.5),y ...
- R语言低级绘图函数-abline 转载
abline 函数的作用是在一张图表上添加直线, 可以是一条斜线,通过x或y轴的交点和斜率来确定位置:也可以是一条水平或者垂直的线,只需要指定与x轴或y轴交点的位置就可以了 常见用法: 1)添加直线 ...
- R语言低级绘图函数-grid
grid 函数用来在一张图表上添加网格线, 基本用法:默认在添加刻度线的地方添加网格线 plot(1:5, 1:5, xlim = c(0,6), ylim = c (0,6), type = &qu ...
- R语言低级绘图函数-title
title 函数用来在一张图表上添加标题 基本用法: main 表示主标题,通常位于图像的上方, sub 表示副标题,位于图像的下方, xlab 表示x轴的标签,ylab 表示y轴的标签 par(om ...
- R语言低级绘图函数-text
text函数用来在一张图表上添加文字,只需要指定对应的x和y坐标,以及需要添加的文字内容就可以了 基本用法: plot(1:5, 1:5, xlim = c(0,6), ylim = c (0,6), ...
- R语言低级绘图函数-rect
rect 函数用来在一张图上添加矩形,只需要指定左下角和右上角的坐标的位置,就可以画出一个矩形 基本用法: plot(1:5, 1:5, xlim = c(0,6), ylim = c (0,6), ...
- R语言低级绘图函数-arrows
arrows 函数用来在一张图表上添加箭头,只需要分别指定起始坐标和终止坐标,就可以添加箭头了,还可以通过一些属性对箭头的形状,大小进行调整 基本用法: xo, yo 指定起始点的x和y坐标,x1, ...
- R语言低级绘图函数-abline
abline 函数的作用是在一张图表上添加直线, 可以是一条斜线,通过x或y轴的交点和斜率来确定位置:也可以是一条水平或者垂直的线,只需要指定与x轴或y轴交点的位置就可以了 常见用法: 1)添加直线 ...
随机推荐
- [hihoCoder] #1096 : Divided Product
时间限制:10000ms 单点时限:1000ms 内存限制:256MB 描述 Given two positive integers N and M, please divide N into sev ...
- Linux下nagios网络监控与/proc/net/tcp文件详解
问题描述:nagios自带的check_antp太过简约,除了状态统计输出外,什么参数都不提供.在面对不同应用服务器时,报警就成了很大问题. 问题描述:nagios自带的check_antp太过简约, ...
- Android UI视图效果篇之仿QQ好友列表分组悬浮PinnedHeaderExpandableListView
楼主是在平板上測试的.图片略微有点大,大家看看效果就好 接下来贴源代码: PinnedHeaderExpandableListView.java 要注意的是 在 onGroupClick方法中pare ...
- mysqldump 备份某张表 Warning: A partial dump from a server that has GTIDs will by default include the GTIDs of all transactions,
[root@NB ok]# mysqldump -uemove -h xx.xx.xx.xx -P9906 DBname t_name -p >2t_tname.sqlWarning: A pa ...
- angular学习笔记(十九)-指令修改dom
本篇主要介绍angular使用指令修改DOM: 使用angular指令可以自己扩展html语法,还可以做很多自定义的事情.在后面会专门讲解这一块的知识,这一篇只是起到了解入门的作用. 与控制器,过滤器 ...
- jquery+asp.net 调用百度geocoder手机浏览器定位--Api介绍及Html定位方法
原文来自:***/projecteactual/jqueryaspnetbaidugeocodermobilebrowserposition.html 在做一个社区项目中,支持移动浏览器进行选择地区和 ...
- python3和2的区别
1.print函数 python2中的print语句,被python3中的print()函数取代.print 'hello world'运行结果: python2中同时输出多个对象时,会创建一个元组, ...
- JS模块的写法
该文章转自阮一峰个人网站,仅做学习之用: 一.原始写法 模块就是实现特定功能的一组方法. 只要把不同的函数(以及记录状态的变量)简单地放在一起,就算是一个模块. function m1(){ //.. ...
- LeetCode: Rotate Image 解题报告
Rotate ImageYou are given an n x n 2D matrix representing an image. Rotate the image by 90 degrees ( ...
- interactive_timeout wait_timeout
官方解释: interactive_timeout The number of seconds the server waits for activity on an i ...