
一种新型聚类算法(Clustering by fast search and find of density peaksd)
最近在学习论文的时候发现了在science上发表的关于新型的基于密度的聚类算法
Kmean算法有很多不足的地方,比如k值的确定,初始结点选择,而且还不能检测费球面类别的数据分布,对于第二个问题,提出了Kmean++,而其他不足还没有解决,dbscan虽然可以对任意形状分布的进行聚类,但是必须指定一个密度阈值,从而去除低于此密度阈值的噪音点,这篇文章解决了这些不足。
本文提出的聚类算法的核心思想在于,对聚类中心的刻画上,而且认为聚类中心同时具有以下两种特点:
- 本身的密度大,即它被密度均不超过它的邻居包围
- 与其他密度更大的数据点之间的“距离”相对更大

通俗的理解为:给一个节点求与其距离小于一个值的节点的个数,用这个个数表示节点的密度,此时求出来的就是节点的局部密度,

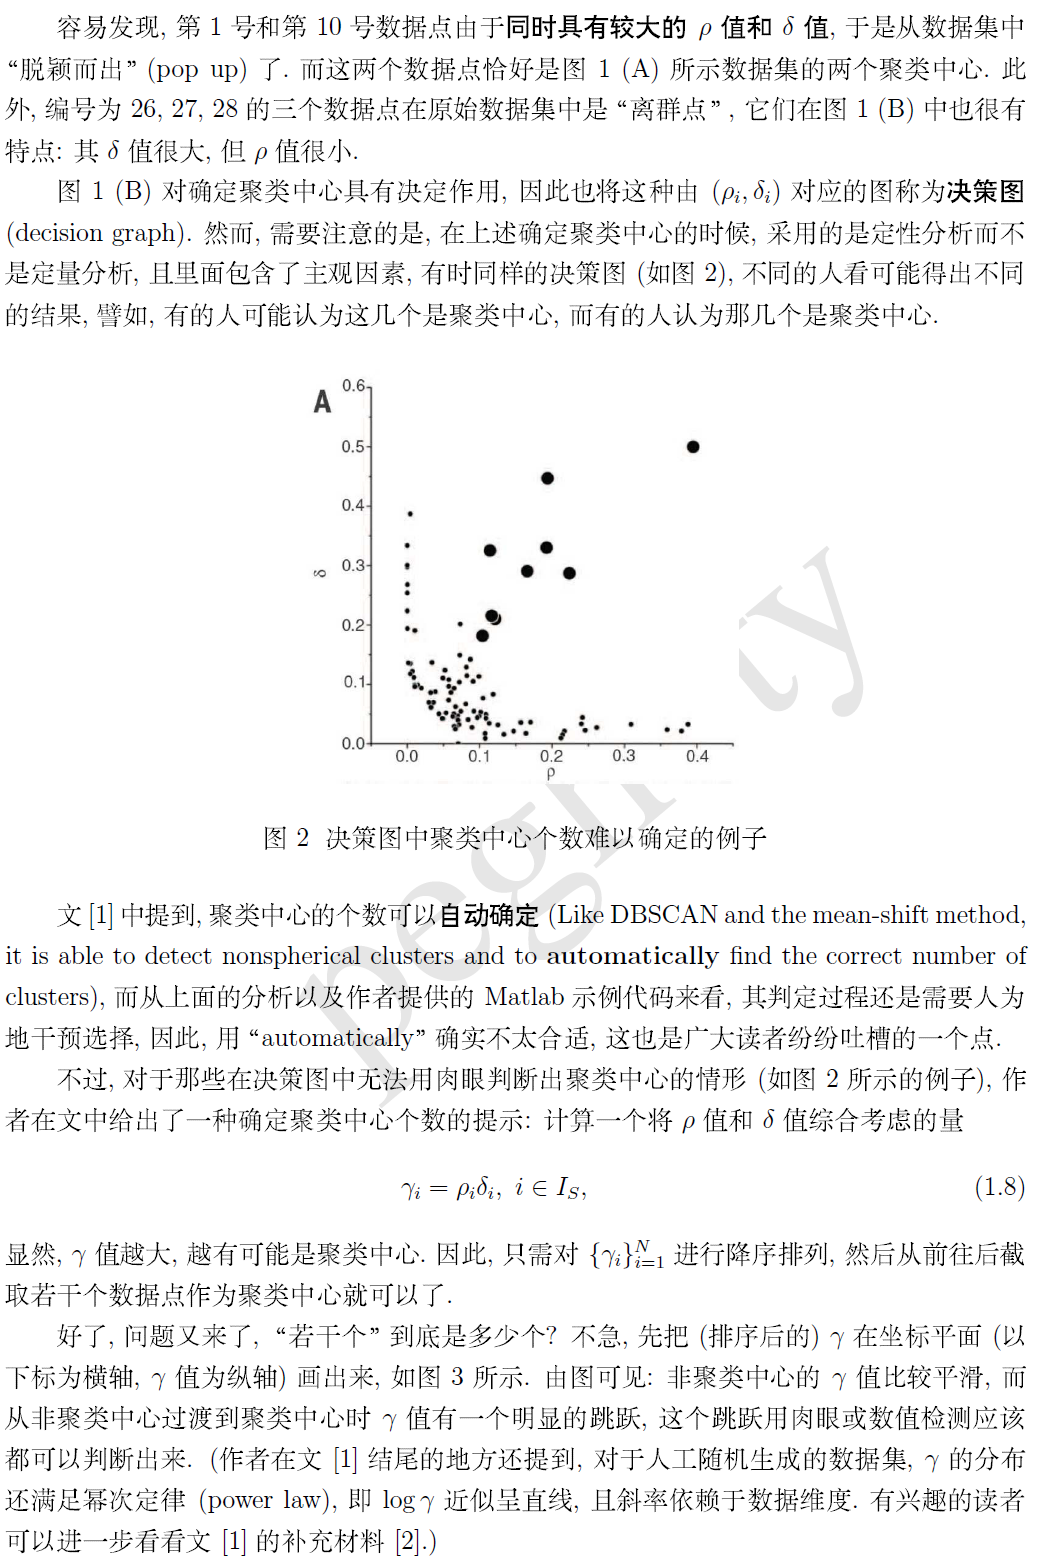
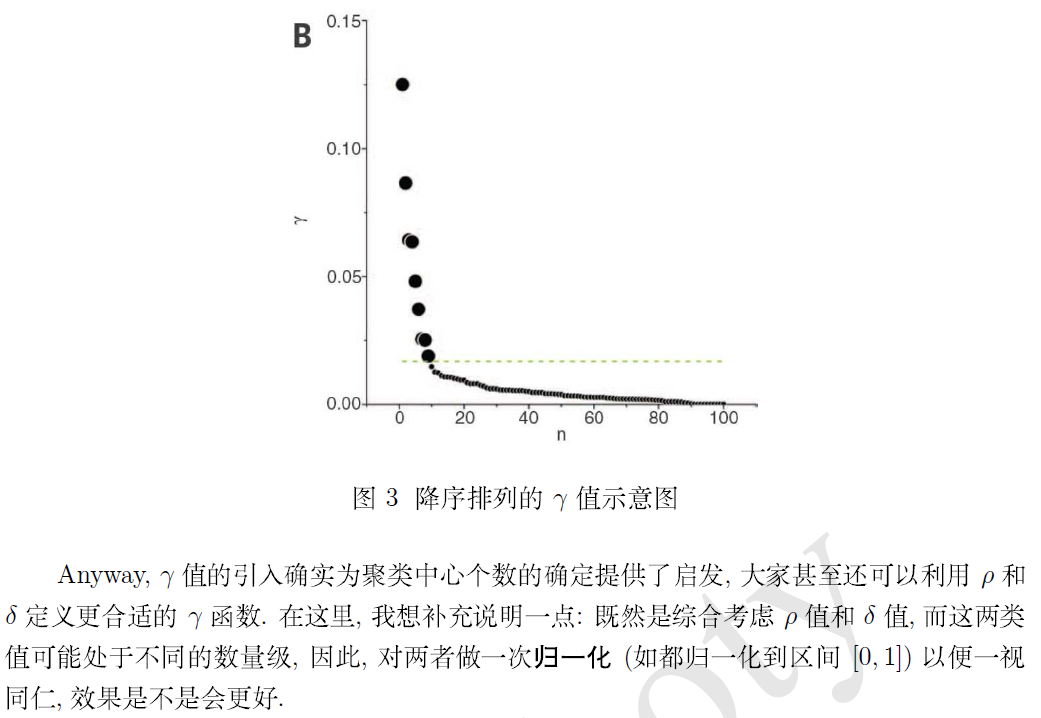
经过上边的过程,每个点都可以找到两个距离与之对应,然后建立一个二维坐标轴,在坐标轴上把图形画出来,如下图



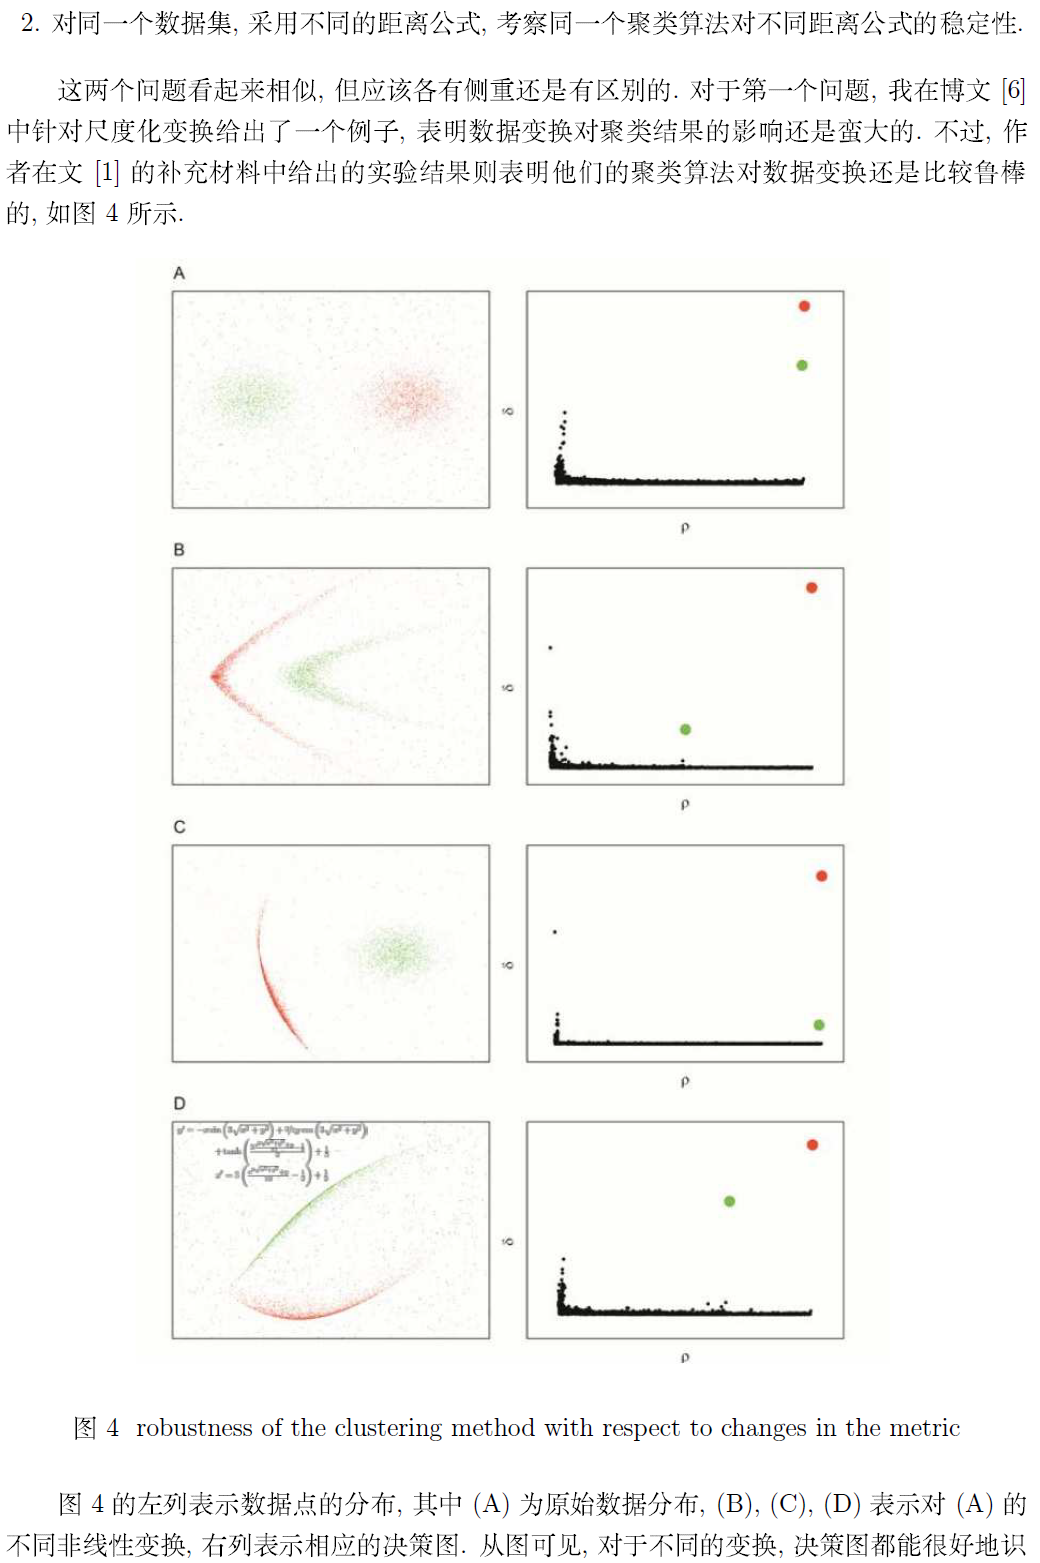


最后,附上作者在补充材料里提供的 Matlab 示例程序 (加了适当的代码注释)
clear all

close all

disp('The only input needed is a distance matrix file')

disp('The format of this file should be: ')

disp('Column 1: id of element i')

disp('Column 2: id of element j')

disp('Column 3: dist(i,j)')

%% 从文件中读取数据

mdist=input('name of the distance matrix file (with single quotes)?\n');

disp('Reading input distance matrix')

xx=load(mdist);

ND=max(xx(:,));

NL=max(xx(:,));

if (NL>ND)

  ND=NL;  %% 确保 DN 取为第一二列最大值中的较大者,并将其作为数据点总数

end

N=size(xx,); %% xx 第一个维度的长度,相当于文件的行数(即距离的总个数)

%% 初始化为零

for i=:ND

  for j=:ND

    dist(i,j)=;

  end

end

%% 利用 xx 为 dist 数组赋值,注意输入只存了 0.5*DN(DN-) 个值,这里将其补成了满矩阵

%% 这里不考虑对角线元素

for i=:N

  ii=xx(i,);

  jj=xx(i,);

  dist(ii,jj)=xx(i,);

  dist(jj,ii)=xx(i,);

end

%% 确定 dc

percent=2.0;

fprintf('average percentage of neighbours (hard coded): %5.6f\n', percent);

position=round(N*percent/); %% round 是一个四舍五入函数

sda=sort(xx(:,)); %% 对所有距离值作升序排列

dc=sda(position);

%% 计算局部密度 rho (利用 Gaussian 核)

fprintf('Computing Rho with gaussian kernel of radius: %12.6f\n', dc);

%% 将每个数据点的 rho 值初始化为零

for i=:ND

  rho(i)=.;

end

% Gaussian kernel

for i=:ND-

  for j=i+:ND

     rho(i)=rho(i)+exp(-(dist(i,j)/dc)*(dist(i,j)/dc));

     rho(j)=rho(j)+exp(-(dist(i,j)/dc)*(dist(i,j)/dc));

  end

end

% "Cut off" kernel

%for i=:ND-

%  for j=i+:ND

%    if (dist(i,j)<dc)

%       rho(i)=rho(i)+.;

%       rho(j)=rho(j)+.;

%    end

%  end

%end

%% 先求矩阵列最大值,再求最大值,最后得到所有距离值中的最大值

maxd=max(max(dist));

%% 将 rho 按降序排列,ordrho 保持序

[rho_sorted,ordrho]=sort(rho,'descend');

%% 处理 rho 值最大的数据点

delta(ordrho())=-.;

nneigh(ordrho())=;

%% 生成 delta 和 nneigh 数组

for ii=:ND

   delta(ordrho(ii))=maxd;

   for jj=:ii-

     if(dist(ordrho(ii),ordrho(jj))<delta(ordrho(ii)))

        delta(ordrho(ii))=dist(ordrho(ii),ordrho(jj));

        nneigh(ordrho(ii))=ordrho(jj);

        %% 记录 rho 值更大的数据点中与 ordrho(ii) 距离最近的点的编号 ordrho(jj)

     end

   end

end

%% 生成 rho 值最大数据点的 delta 值

delta(ordrho())=max(delta(:));

%% 决策图

disp('Generated file:DECISION GRAPH')

disp('column 1:Density')

disp('column 2:Delta')

fid = fopen('DECISION_GRAPH', 'w');

for i=:ND

   fprintf(fid, '%6.2f %6.2f\n', rho(i),delta(i));

end

%% 选择一个围住类中心的矩形

disp('Select a rectangle enclosing cluster centers')

%% 每台计算机,句柄的根对象只有一个,就是屏幕,它的句柄总是

%% >> scrsz = get(,'ScreenSize')

%% scrsz =

%%

%%  和  就是你设置的计算机的分辨率,scrsz() 就是 ,scrsz() 就是

scrsz = get(,'ScreenSize');

%% 人为指定一个位置,感觉就没有那么 auto 了 :-)

figure('Position',[  scrsz()/. scrsz()/1.3]);

%% ind 和 gamma 在后面并没有用到

for i=:ND

  ind(i)=i;

  gamma(i)=rho(i)*delta(i);

end

%% 利用 rho 和 delta 画出一个所谓的“决策图”

subplot(,,)

tt=plot(rho(:),delta(:),'o','MarkerSize',,'MarkerFaceColor','k','MarkerEdgeColor','k');

title ('Decision Graph','FontSize',15.0)

xlabel ('\rho')

ylabel ('\delta')

subplot(,,)

rect = getrect();

%% getrect 从图中用鼠标截取一个矩形区域, rect 中存放的是

%% 矩形左下角的坐标 (x,y) 以及所截矩形的宽度和高度

rhomin=rect();

deltamin=rect(); %% 作者承认这是个 error,已由  改为  了!

%% 初始化 cluster 个数

NCLUST=;

%% cl 为归属标志数组,cl(i)=j 表示第 i 号数据点归属于第 j 个 cluster

%% 先统一将 cl 初始化为 -

for i=:ND

  cl(i)=-;

end

%% 在矩形区域内统计数据点(即聚类中心)的个数

for i=:ND

  if ( (rho(i)>rhomin) && (delta(i)>deltamin))

     NCLUST=NCLUST+;

     cl(i)=NCLUST; %% 第 i 号数据点属于第 NCLUST 个 cluster

     icl(NCLUST)=i;%% 逆映射,第 NCLUST 个 cluster 的中心为第 i 号数据点

  end

end

fprintf('NUMBER OF CLUSTERS: %i \n', NCLUST);

disp('Performing assignation')

%% 将其他数据点归类 (assignation)

for i=:ND

  if (cl(ordrho(i))==-)

    cl(ordrho(i))=cl(nneigh(ordrho(i)));

  end

end

%% 由于是按照 rho 值从大到小的顺序遍历,循环结束后, cl 应该都变成正的值了.

%% 处理光晕点,halo这段代码应该移到 if (NCLUST>) 内去比较好吧

for i=:ND

  halo(i)=cl(i);

end

if (NCLUST>)

  % 初始化数组 bord_rho 为 ,每个 cluster 定义一个 bord_rho 值

  for i=:NCLUST

    bord_rho(i)=.;

  end

  % 获取每一个 cluster 中平均密度的一个界 bord_rho

  for i=:ND-

    for j=i+:ND

      %% 距离足够小但不属于同一个 cluster 的 i 和 j

      if ((cl(i)~=cl(j))&& (dist(i,j)<=dc))

        rho_aver=(rho(i)+rho(j))/.; %% 取 i,j 两点的平均局部密度

        if (rho_aver>bord_rho(cl(i)))

          bord_rho(cl(i))=rho_aver;

        end

        if (rho_aver>bord_rho(cl(j)))

          bord_rho(cl(j))=rho_aver;

        end

      end

    end

  end

  %% halo 值为  表示为 outlier

  for i=:ND

    if (rho(i)<bord_rho(cl(i)))

      halo(i)=;

    end

  end

end

%% 逐一处理每个 cluster

for i=:NCLUST

  nc=; %% 用于累计当前 cluster 中数据点的个数

  nh=; %% 用于累计当前 cluster 中核心数据点的个数

  for j=:ND

    if (cl(j)==i)

      nc=nc+;

    end

    if (halo(j)==i)

      nh=nh+;

    end

  end

  fprintf('CLUSTER: %i CENTER: %i ELEMENTS: %i CORE: %i HALO: %i \n', i,icl(i),nc,nh,nc-nh);

end

cmap=colormap;

for i=:NCLUST

   ic=int8((i*.)/(NCLUST*.));

   subplot(,,)

   hold on

   plot(rho(icl(i)),delta(icl(i)),'o','MarkerSize',,'MarkerFaceColor',cmap(ic,:),'MarkerEdgeColor',cmap(ic,:));

end

subplot(,,)

disp('Performing 2D nonclassical multidimensional scaling')

Y1 = mdscale(dist, , 'criterion','metricstress');

plot(Y1(:,),Y1(:,),'o','MarkerSize',,'MarkerFaceColor','k','MarkerEdgeColor','k');

title ('2D Nonclassical multidimensional scaling','FontSize',15.0)

xlabel ('X')

ylabel ('Y')

for i=:ND

 A(i,)=.;

 A(i,)=.;

end

for i=:NCLUST

  nn=;

  ic=int8((i*.)/(NCLUST*.));

  for j=:ND

    if (halo(j)==i)

      nn=nn+;

      A(nn,)=Y1(j,);

      A(nn,)=Y1(j,);

    end

  end

  hold on

  plot(A(:nn,),A(:nn,),'o','MarkerSize',,'MarkerFaceColor',cmap(ic,:),'MarkerEdgeColor',cmap(ic,:));

end

%for i=:ND

%   if (halo(i)>)

%      ic=int8((halo(i)*.)/(NCLUST*.));

%      hold on

%      plot(Y1(i,),Y1(i,),'o','MarkerSize',,'MarkerFaceColor',cmap(ic,:),'MarkerEdgeColor',cmap(ic,:));

%   end

%end

faa = fopen('CLUSTER_ASSIGNATION', 'w');

disp('Generated file:CLUSTER_ASSIGNATION')

disp('column 1:element id')

disp('column 2:cluster assignation without halo control')

disp('column 3:cluster assignation with halo control')

for i=:ND

   fprintf(faa, '%i %i %i\n',i,cl(i),halo(i));

end
参考:http://blog.csdn.net/aimatfuture/article/details/39405261
http://blog.csdn.net/zxdxyz/article/details/40655231
一种新型聚类算法(Clustering by fast search and find of density peaksd)的更多相关文章
- Science14年的聚类论文——Clustering by fast search and find of density peaks
欢迎转载,转载请注明:本文出自Bin的专栏blog.csdn.net/xbinworld. 这是一个比较新的聚类方法(文章中没看见作者对其取名,在这里我姑且称该方法为local density clu ...
- Science论文"Clustering by fast search and find of density peaks"学习笔记
"Clustering by fast search and find of density peaks"是今年6月份在<Science>期刊上发表的的一篇论文,论文中 ...
- 处理输入为非对角阵的Clustering by fast search and find of density peak代码
Clustering by fast search and find of density peak. Alex Rodriguez, Alessandro Laio 是发表在Science上的一篇很 ...
- Clustering by fast search and find of density peaks
参考:http://www.52ml.net/16296.html 这个算法的优点就在于,它首先一步就能找到聚类中心,然后划分类别.而其他算法需要反复迭代才能找到中心聚类. 就是不知道代码该怎么写.. ...
- 发表在 Science 上的一种新聚类算法
今年 6 月份,Alex Rodriguez 和 Alessandro Laio 在 Science 上发表了一篇名为<Clustering by fast search and find of ...
- 密度峰值聚类算法(DPC)
密度峰值聚类算法(DPC) 凯鲁嘎吉 - 博客园 http://www.cnblogs.com/kailugaji/ 1. 简介 基于密度峰值的聚类算法全称为基于快速搜索和发现密度峰值的聚类算法(cl ...
- 各类聚类(clustering)算法初探
1. 聚类简介 0x1:聚类是什么? 聚类是一种运用广泛的探索性数据分析技术,人们对数据产生的第一直觉往往是通过对数据进行有意义的分组.很自然,首先要弄清楚聚类是什么? 直观上讲,聚类是将对象进行分组 ...
- Science上发表的超赞聚类算法
本博客已经迁往http://www.kemaswill.com/, 博客园这边也会继续更新, 欢迎关注~ 作者(Alex Rodriguez, Alessandro Laio)提出了一种很简洁优美的聚 ...
- Science上发表的超赞聚类算法(转)
作者(Alex Rodriguez, Alessandro Laio)提出了一种很简洁优美的聚类算法, 可以识别各种形状的类簇, 并且其超参数很容易确定. 算法思想 该算法的假设是类簇的中心由一些局部 ...
随机推荐
- swing包含了各种组件的类
javax.swing 最常用的pachage,包含了各种swing组件的类 javax.swing.border 包含与swing组件外框有关的类 javax..swing.colorchooser ...
- Xianfeng轻量级Java中间件平台:权限管理
权限管理:是通过系统对用户的行为进行控制的一套业务规则,可以做得很简单,比如通过硬编码的方式进行控制,也可以做得很复杂,比如通过一些复杂的权限模型去实现一些复杂的权限控制,比如菜单访问权限.按钮操作权 ...
- How to suppress 'Maybe this is program method' warnings from ProGuard
11down votefavorite 2 I'm using ProGuard with my Android application and I'm running getting the war ...
- PHI 数据库简介
PHI是一个致病菌的数据库,截止到2017年8月1号为止,最新的版本是4.3,数据库中收录了实验验证过的致病菌的信息,其中有176个来自动物的致病菌,227个来自植物的致病菌,3个来自真菌的致病菌; ...
- MyBatis之one2one与one2many
<!--顾客信息表,其中一个顾客对应一个国家,一个顾客对应多个订单--> <resultMap id="customerResultMap" type=" ...
- 前端不容错过的jQuery图片滑块插件
作为前端开发者,我们会碰到很到各种各样的jQuery插件,但老实说,很少有自己写的.今天要分享的几款jQuery图片滑块插件,也就是jQuery焦点图插件,基本上会在每个网站都有应用,可以下载看看,也 ...
- linux中crontab命令
一.crond简介 crond是linux下用来周期性的执行某种任务或等待处理某些事件的一个守护进程,与windows下的计划任务类似,当安装完成操作系统后,默认会安装此服务工具,并且会自动启动cro ...
- Yii2 中cookie的用法(1)
Yii使用 yii\web\Cookie对象来代表每个cookie,yii\web\Request 和 yii\web\Response 通过名为’cookies’的属性维护一个cookie集合, 前 ...
- 10.6 监控io性能 10.7 free命令 10.8 ps命令 10.9 查看网络状态 10.10 linux下抓包
iostat sysstat 包里面包括 sar 和 iostat [root@centos7 ~]# iostat Linux 3.10.0-693.2.2.el7.x86_64 (centos7. ...
- SharePoint 2013 隐藏左边快速启动菜单栏(Hiding the Quick Launch Bar)
在SharePoint 2013默认网站页面中,很多时候,我们需要隐藏左边快速启动菜单栏,这时我们可以通过下面的样式来实现隐藏它. 和SharePoint 2010不太一样,方法改了,不过性质是一样的 ...