Spring Boot Actuator 整合 Prometheus
简介
Spring Boot 自带监控功能 Actuator,可以帮助实现对程序内部运行情况监控,比如监控状况、Bean加载情况、环境变量、日志信息、线程信息等。这一节结合 Prometheus 、Grafana 来更加直观的展示这些信息。
实验
说明
| 服务名 | 地址 | 端口 |
|---|---|---|
| Prometheus | 172.16.2.101 | 9090 |
| Grafana | 172.16.2.101 | 3000 |
| Spring Boot Demo | 172.16.2.204 | 8080 |
创建项目
创建用于测试的 Spring Boot 项目,主要代码如下。
pom.xml
<dependency>

    <groupId>org.springframework.boot</groupId>

    <artifactId>spring-boot-starter-actuator</artifactId>

</dependency>

<dependency>

    <groupId>org.springframework.boot</groupId>

    <artifactId>spring-boot-starter-web</artifactId>

</dependency>

<dependency>

    <groupId>io.micrometer</groupId>

    <artifactId>micrometer-registry-prometheus</artifactId>

</dependency>

<dependency>

    <groupId>org.springframework.boot</groupId>

    <artifactId>spring-boot-starter-test</artifactId>

    <scope>test</scope>

</dependency>
application.yml
management:

  endpoints:

    web:

      exposure:

        include: '*'

  endpoint:

    health:

      show-details: always

  metrics:

    tags:

      application: actuator-demo
- management.endpoints.web.exposure.include:大多数actuator的端口都不会通过http公开,* 代表公开所有这些端点。对于生产环境,应该仔细选择要公开的端点。
- management.metrics.tags.application:为应用设置 tag ,方便区分不同的应用。
启动类
@SpringBootApplication

@RestController

public class SpringbootActuatorPrometheusDemoApplication {

    public static void main(String[] args) {

        SpringApplication.run(SpringbootActuatorPrometheusDemoApplication.class, args);

    }

    @RequestMapping(value = "/hello")

    public String  sayHello() {

        for (int i = 1 ; i <= 10 ; i++) {

            Thread t = new Thread(() -> {

                try {

                    Thread.sleep(5000);

                } catch (InterruptedException e) {

                    e.printStackTrace();

                }

            } , "HelloThread - " + i);

            t.start();

        }

        return "ok";

    }

    /**

    @Bean

    MeterRegistryCustomizer<MeterRegistry> metricsCommonTags() {

        return registry -> registry.config().commonTags("application", "springboot-actuator-prometheus-demo");

    }

    */

}
配置 Prometheus 和 Grafana
在 prometheus.yml 中添加针对该 Spring Boot 应用 的监控 job
- job_name: 'actuator-demo'

    metrics_path: '/prometheus'

    static_configs:

    - targets: ['172.16.2.204:8080']
运行 Prometheus 和 Grafana:
docker start prometheus grafana
访问 Prometheus UI http://172.16.2.101:9090 ,查看 targets ,可以看到 job 处于 UP 状态,说明配置成功了。

Grafana UI http://172.16.2.101:3000,通过Grafana的 + 图标导入(Import) JVM (Micrometer) dashboard:
- grafana id = 4701
- 注意选中prometheus数据源
查看JVM (Micormeter) dashboard:
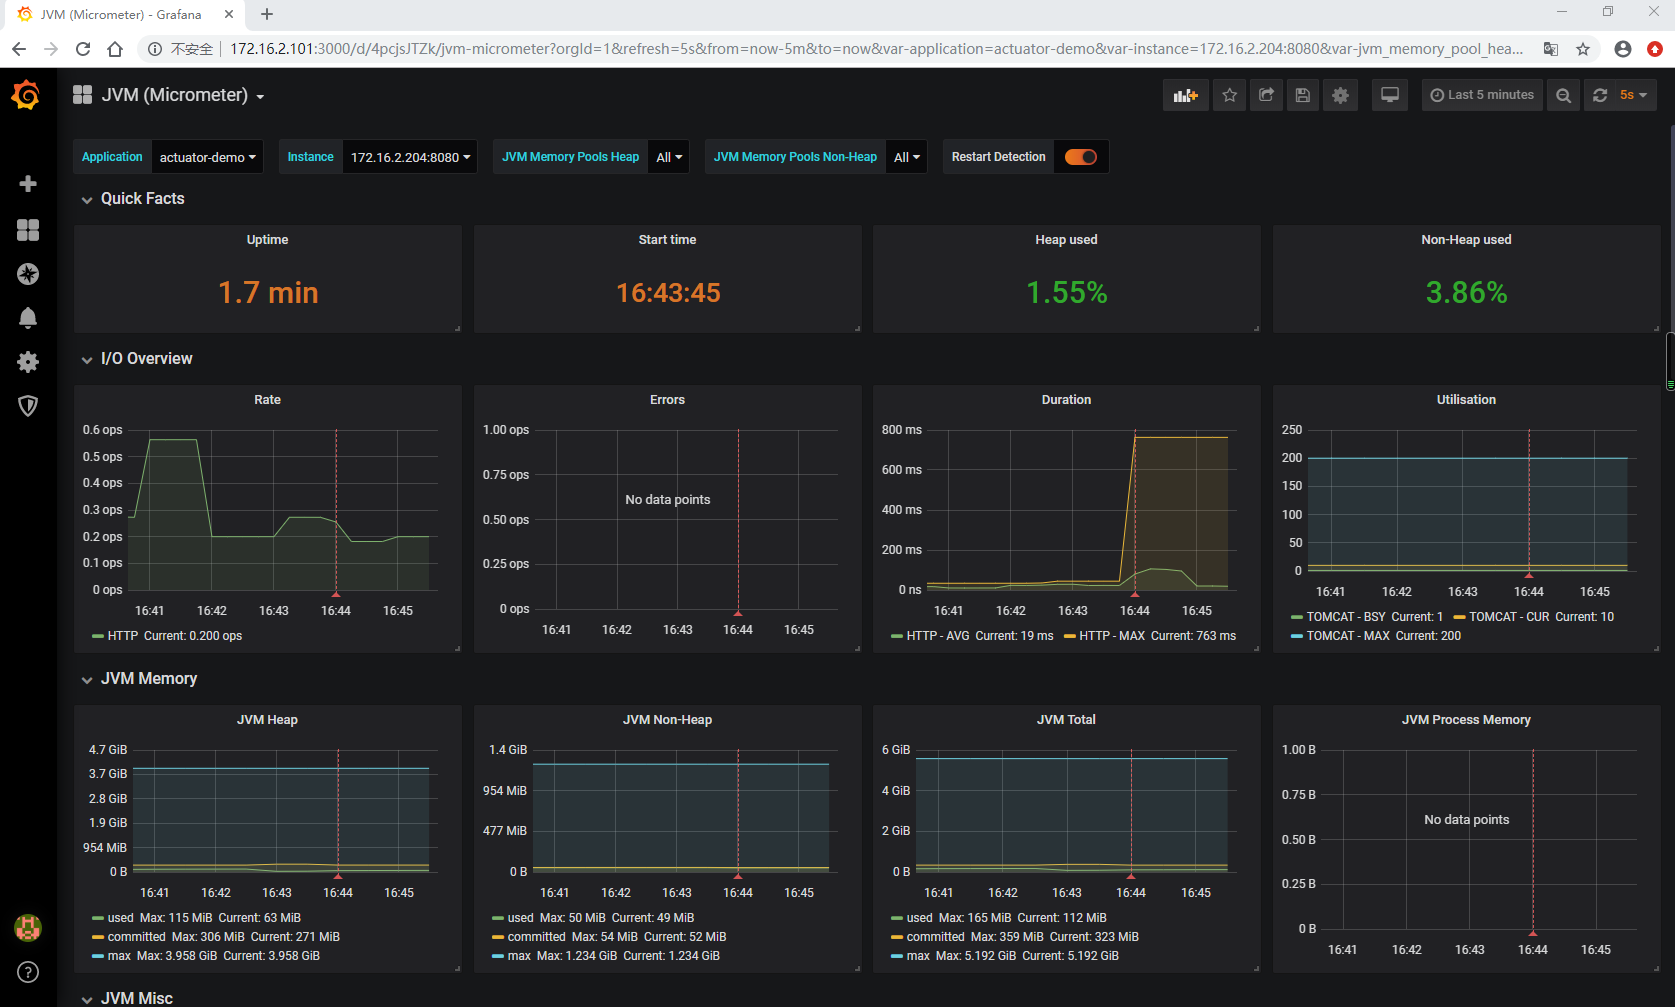
可以看到应用的 JVM 的 堆栈、 线程、 IO 等等信息。
源码
https://github.com/gf-huanchupk/SpringBootLearning/tree/master/springboot-actuator-prometheus
参考
https://micrometer.io/docs/registry/prometheus
https://prometheus.io/docs/prometheus
往期内容
欢迎扫码或微信搜索公众号《程序员果果》关注我,关注有惊喜~

Spring Boot Actuator 整合 Prometheus的更多相关文章
- 使用Spring Boot Actuator将指标导出到InfluxDB和Prometheus
使用Spring Boot Actuator将指标导出到InfluxDB和Prometheus Spring Boot Actuator是Spring Boot 2发布后修改最多的项目之一.它经过 ...
- 使用Spring Boot Actuator、Jolokia和Grafana实现准实时监控
由于最近在做监控方面的工作,因此也读了不少相关的经验分享.其中有这样一篇文章总结了一些基于Spring Boot的监控方案,因此翻译了一下,希望可以对大家有所帮助. 原文:Near real-time ...
- 朱晔和你聊Spring系列S1E7:简单好用的Spring Boot Actuator
阅读PDF版本 本文会来看一下Spring Boot Actuator提供给我们的监控端点Endpoint.健康检查Health和打点指标Metrics等所谓的Production-ready(生产环 ...
- 使用Spring Boot Actuator、Jolokia和Grafana实现准实时监控--转
原文地址:http://mp.weixin.qq.com/s?__biz=MzAxODcyNjEzNQ==&mid=2247483789&idx=1&sn=ae11f04780 ...
- Spring Boot Actuator:健康检查、审计、统计和监控(转)
Spring Boot Actuator可以帮助你监控和管理Spring Boot应用,比如健康检查.审计.统计和HTTP追踪等.所有的这些特性可以通过JMX或者HTTP endpoints来获得. ...
- Spring Boot Actuator:健康检查、审计、统计和监控
Spring Boot Actuator可以帮助你监控和管理Spring Boot应用,比如健康检查.审计.统计和HTTP追踪等.所有的这些特性可以通过JMX或者HTTP endpoints来获得. ...
- spring boot actuator专题
spring-boot-starter-actuator模块的实现对于实施微服务的中小团队来说,可以有效地减少监控系统在采集应用指标时的开发量.当然,它也并不是万能的,有时候我们也需要对其做一些简单的 ...
- Spring Boot (九): 微服务应用监控 Spring Boot Actuator 详解
1. 引言 在当前的微服务架构方式下,我们会有很多的服务部署在不同的机器上,相互是通过服务调用的方式进行交互,一个完整的业务流程中间会经过很多个微服务的处理和传递,那么,如何能知道每个服务的健康状况就 ...
- Spring Boot 2.X(十六):应用监控之 Spring Boot Actuator 使用及配置
Actuator 简介 Actuator 是 Spring Boot 提供的对应用系统的自省和监控功能.通过 Actuator,可以使用数据化的指标去度量应用的运行情况,比如查看服务器的磁盘.内存.C ...
随机推荐
- .Net基础篇_学习笔记_第五天_流程控制while循环003
using System; using System.Collections.Generic; using System.Linq; using System.Text; using System.T ...
- 疑难杂症----Windows10
现在大多数个人电脑所用的操作系统都是win10,而我们使用win10时总是会碰上各种各样的问题,所以专门写一篇博客来记录我碰上的各种问题,便于以后更快的解决问题. 一.小娜搜索不到应用问题解决方案 小 ...
- charles 禁用缓存
本文参考:charles 禁用缓存 No caching Settings/无缓存工具的用法 弹窗面板上一句话概括了他的工作原理:通过修改请求和响应头来防止缓存; 无缓存工具 无缓存工具阻止客户端应用 ...
- Java8虚拟机(JVM)内存溢出实战
前言 相信很多JAVA中高级的同学在面试的时候会经常碰到一个面试题 你是如何在工作中对JVM调优和排查定位问题的? 事实上,如果用户量不大的情况下,在你的代码还算正常的情况下,在工作中除非真正碰到与J ...
- 12 (OC)* AFNetworking
AFNetworking主要是对NSURLSession和NSURLConnection(iOS9.0废弃)的封装,其中主要有以下类:1). AFHTTPRequestOperationManager ...
- php 循环从数据库分页取数据批量修改数据
//批量修改email重复 public function getEmail() { $this->model = app::get('shop')->model('manage'); / ...
- 目标检测中常提到的IoU和mAP究竟是什么?
看完这篇就懂了. IoU intersect over union,中文:交并比.指目标预测框和真实框的交集和并集的比例. mAP mean average precision.是指每个类别的平均查准 ...
- selenium-03-02操作元素-等待
1.最直接普通的方式:这个是设置固定的等待时间 Thread.sleep(1000); 2.隐式等待方式(implicitlyWait):设置脚本在查找元素时的最大等待时间: driv ...
- 基于操作系统原理的Red Hat Linux的基本操作
一.实验目的 1.了解Linux操作系统的启动与登录方法. 2.掌握Red Hat Linux图形用户界面下的基本操作. 3.学会Red Hat Linux基本设置. 二.实验内容 1. 登录 2. ...
- Hadoop源代码点滴-基础概念
大数据特征:volume(数量).variety(多样性).velocity(产生的速度) 大数据特征:多.乱.快.杂 数据的来源:业务数据.日志.管理文档(OCR).互联网.物联网.外购