ELKStack入门篇(二)之Nginx、Tomcat、Java日志收集以及TCP收集日志使用
1、收集Nginx的json格式日志
1.1、Nginx安装
[root@linux-node1 ~]# yum install nginx -y
[root@linux-node1 ~]# vim /etc/nginx/nginx.conf
#修改日志格式为json格式,并创建一个nginxweb的网站目录
log_format access_json '{"@timestamp":"$time_iso8601",'
'"host":"$server_addr",'
'"clientip":"$remote_addr",'
'"size":$body_bytes_sent,'
'"responsetime":$request_time,'
'"upstreamtime":"$upstream_response_time",'
'"upstreamhost":"$upstream_addr",'
'"http_host":"$host",'
'"url":"$uri",'
'"domain":"$host",'
'"xff":"$http_x_forwarded_for",'
'"referer":"$http_referer",'
'"status":"$status"}';
access_log /var/log/nginx/access.log access_json; location /nginxweb {
root html;
index index.html index.htm;
}
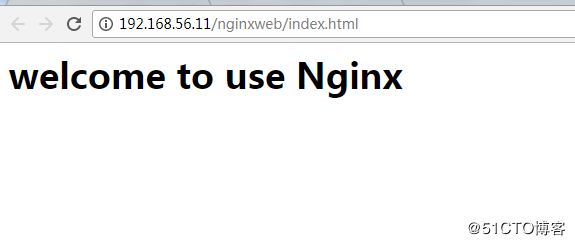
[root@linux-node1 ~]# mkdir /usr/share/nginx/html/nginxweb
[root@linux-node1 ~]# echo "<h1> welcome to use Nginx" > /usr/share/nginx/html/nginxweb/index.html
[root@linux-node1 ~]# nginx -t
nginx: the configuration file /etc/nginx/nginx.conf syntax is ok
nginx: configuration file /etc/nginx/nginx.conf test is successful
[root@linux-node1 ~]# systemctl start nginx
1.2、配置logstash
[root@linux-node1 ~]# vim /etc/logstash/conf.d/nginx-accesslog.conf

input{

    file {

        path => "/var/log/nginx/access.log"

        type => "nginx-access-log"

        start_position => "beginning"

        stat_interval => ""

    }

}

output{

   elasticsearch {

        hosts => ["192.168.56.11:9200"]

        index => "logstash-nginx-access-log-%{+YYYY.MM.dd}"

   }

   file {

        path => "/tmp/logstash-nginx-access-log-%{+YYYY.MM.dd}"

   }

}

[root@linux-node1 ~]# /usr/share/logstash/bin/logstash -f /etc/logstash/conf.d/nginx_access.conf -t

[root@linux-node1 ~]# systemctl restart logstash
1.3、配置Kibana展示
[root@linux-node1 ~]# ab -n1000 -c  http://192.168.56.11/nginxweb/index.html    #对页面压测

[root@linux-node1 ~]# tailf /var/log/nginx/access.log    #nginx的访问日志变成了json格式

{"@timestamp":"2017-12-27T16:38:17+08:00","host":"192.168.56.11","clientip":"192.168.56.11","size":,"responsetime":0.000,"upstreamtime":"-","upstreamhost":"-","http_host":"192.168.56.11","url":"/nginxweb/index.html","domain":"192.168.56.11","xff":"-","referer":"-","status":""}

{"@timestamp":"2017-12-27T16:38:17+08:00","host":"192.168.56.11","clientip":"192.168.56.11","size":,"responsetime":0.000,"upstreamtime":"-","upstreamhost":"-","http_host":"192.168.56.11","url":"/nginxweb/index.html","domain":"192.168.56.11","xff":"-","referer":"-","status":""}

{"@timestamp":"2017-12-27T16:38:17+08:00","host":"192.168.56.11","clientip":"192.168.56.11","size":,"responsetime":0.000,"upstreamtime":"-","upstreamhost":"-","http_host":"192.168.56.11","url":"/nginxweb/index.html","domain":"192.168.56.11","xff":"-","referer":"-","status":""}

{"@timestamp":"2017-12-27T16:38:17+08:00","host":"192.168.56.11","clientip":"192.168.56.11","size":,"responsetime":0.000,"upstreamtime":"-","upstreamhost":"-","http_host":"192.168.56.11","url":"/nginxweb/index.html","domain":"192.168.56.11","xff":"-","referer":"-","status":""}

{"@timestamp":"2017-12-27T16:38:17+08:00","host":"192.168.56.11","clientip":"192.168.56.11","size":,"responsetime":0.000,"upstreamtime":"-","upstreamhost":"-","http_host":"192.168.56.11","url":"/nginxweb/index.html","domain":"192.168.56.11","xff":"-","referer":"-","status":""}

{"@timestamp":"2017-12-27T16:38:17+08:00","host":"192.168.56.11","clientip":"192.168.56.11","size":,"responsetime":0.000,"upstreamtime":"-","upstreamhost":"-","http_host":"192.168.56.11","url":"/nginxweb/index.html","domain":"192.168.56.11","xff":"-","referer":"-","status":""}

{"@timestamp":"2017-12-27T16:38:17+08:00","host":"192.168.56.11","clientip":"192.168.56.11","size":,"responsetime":0.000,"upstreamtime":"-","upstreamhost":"-","http_host":"192.168.56.11","url":"/nginxweb/index.html","domain":"192.168.56.11","xff":"-","referer":"-","status":""}

{"@timestamp":"2017-12-27T16:38:17+08:00","host":"192.168.56.11","clientip":"192.168.56.11","size":,"responsetime":0.000,"upstreamtime":"-","upstreamhost":"-","http_host":"192.168.56.11","url":"/nginxweb/index.html","domain":"192.168.56.11","xff":"-","referer":"-","status":""}

{"@timestamp":"2017-12-27T16:38:17+08:00","host":"192.168.56.11","clientip":"192.168.56.11","size":,"responsetime":0.000,"upstreamtime":"-","upstreamhost":"-","http_host":"192.168.56.11","url":"/nginxweb/index.html","domain":"192.168.56.11","xff":"-","referer":"-","status":""}

{"@timestamp":"2017-12-27T16:38:17+08:00","host":"192.168.56.11","clientip":"192.168.56.11","size":,"responsetime":0.000,"upstreamtime":"-","upstreamhost":"-","http_host":"192.168.56.11","url":"/nginxweb/index.html","domain":"192.168.56.11","xff":"-","referer":"-","status":""}
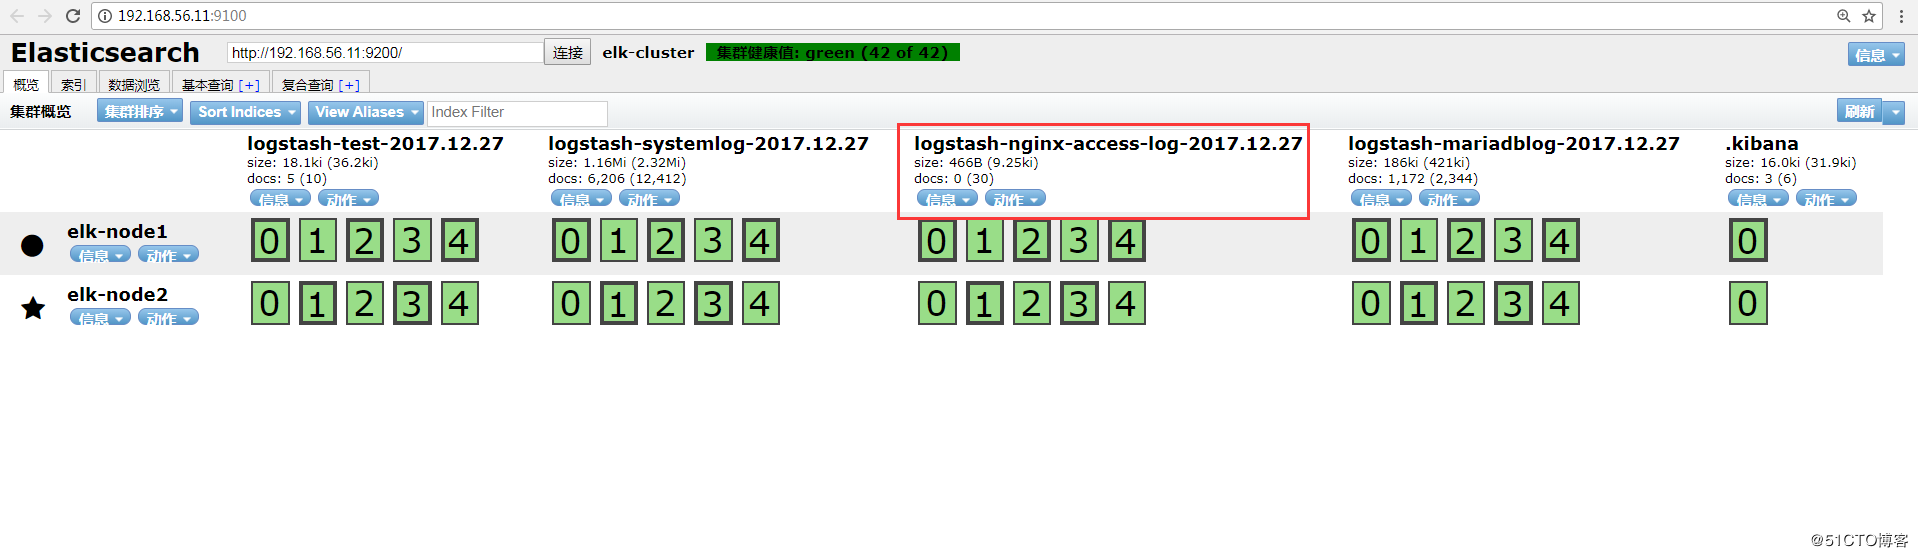
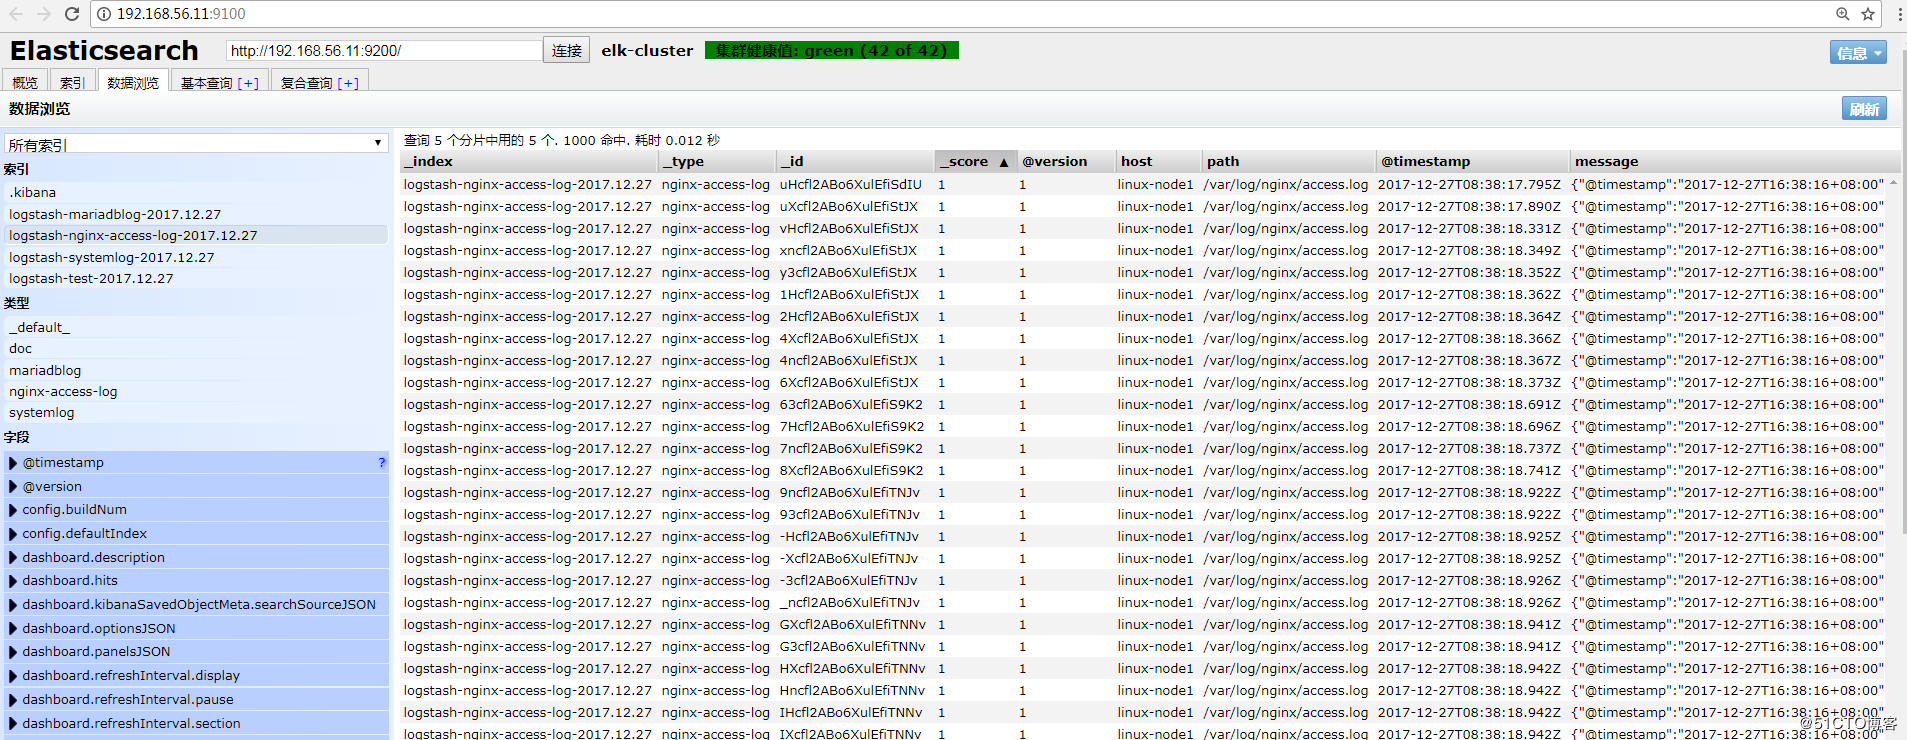
Head插件查看:
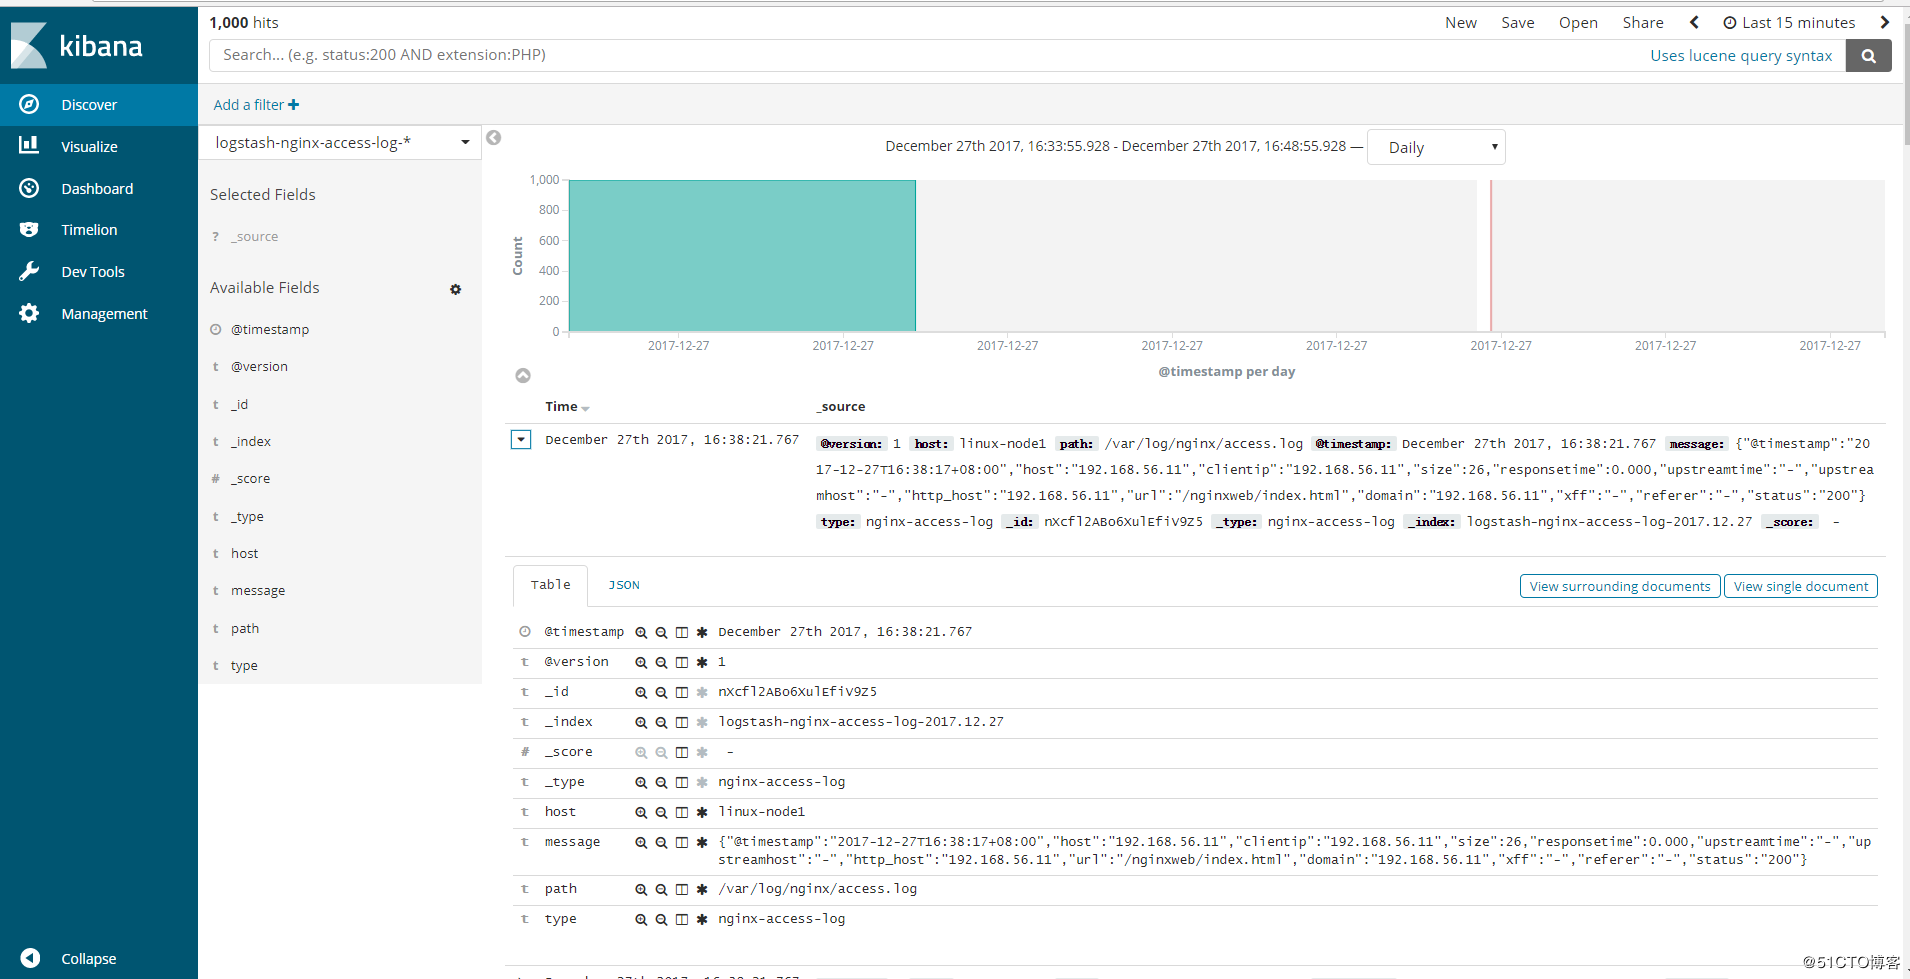
Kibana查看:
2、Tomcat的json日志收集
2.1、下载tomcat
[root@linux-node2 ~]# wget http://apache.fayea.com/tomcat/tomcat-8/v8.5.20/bin/apache-tomcat-8.5.20.tar.gz

[root@linux-node2 ~]# tar -zxf apache-tomcat-8.5..tar.gz

[root@linux-node2 ~]# mv apache-tomcat-8.5. /usr/local/tomcat
2.2、修改tomcat日志格式
[root@linux-node2 ~]# cd /usr/local/tomcat/conf

[root@linux-node2 conf ]# cp server.xml{,.bak}

[root@linux-node2 conf ]# vim server.xml

<Valve className="org.apache.catalina.valves.AccessLogValve" directory="logs"

               prefix="tomcat_access_log" suffix=".log"

               pattern="{"clientip":"%h","ClientUser":"%l","authenticated":"%u","AccessTime":"%t","method":"%r","status":"%s","SendBytes":"%b","Query?string":"%q","partner":"%{Referer}i","AgentVersion":"%{User-Agent}i"}"/>
2.3、增加tomcat网页
[root@linux-node2 conf ]# cd ../webapps/

[root@linux-node2 webapps ]# mkdir webdir && cd webdir

[root@linux-node2 webdir ]# echo "<h1>welcome to use tomcat</h1>" > index.html

[root@linux-node2 conf ]# ../bin/catalina.sh start

[root@linux-node2 conf ]# netstat -tulnp |grep

tcp6              :::                 :::*                    LISTEN      /java
2.4、压测页面,生成tomcat的访问日志
[root@linux-node2 conf ]# ab -n1000 -c100 http://192.168.56.12:8080/webdir/index.html

[root@linux-node2 ~]# tailf /usr/local/tomcat/logs/tomcat_access_log.--.log

{"clientip":"192.168.56.12","ClientUser":"-","authenticated":"-","AccessTime":"[28/Dec/2017:09:52:57 +0800]","method":"GET /webdir2/index.html HTTP/1.0","status":"","SendBytes":"","Query?string":"","partner":"-","AgentVersion":"ApacheBench/2.3"}

{"clientip":"192.168.56.12","ClientUser":"-","authenticated":"-","AccessTime":"[28/Dec/2017:09:52:57 +0800]","method":"GET /webdir2/index.html HTTP/1.0","status":"","SendBytes":"","Query?string":"","partner":"-","AgentVersion":"ApacheBench/2.3"}

{"clientip":"192.168.56.12","ClientUser":"-","authenticated":"-","AccessTime":"[28/Dec/2017:09:52:57 +0800]","method":"GET /webdir2/index.html HTTP/1.0","status":"","SendBytes":"","Query?string":"","partner":"-","AgentVersion":"ApacheBench/2.3"}

{"clientip":"192.168.56.12","ClientUser":"-","authenticated":"-","AccessTime":"[28/Dec/2017:09:52:57 +0800]","method":"GET /webdir2/index.html HTTP/1.0","status":"","SendBytes":"","Query?string":"","partner":"-","AgentVersion":"ApacheBench/2.3"}

{"clientip":"192.168.56.12","ClientUser":"-","authenticated":"-","AccessTime":"[28/Dec/2017:09:52:57 +0800]","method":"GET /webdir2/index.html HTTP/1.0","status":"","SendBytes":"","Query?string":"","partner":"-","AgentVersion":"ApacheBench/2.3"}

{"clientip":"192.168.56.12","ClientUser":"-","authenticated":"-","AccessTime":"[28/Dec/2017:09:52:57 +0800]","method":"GET /webdir2/index.html HTTP/1.0","status":"","SendBytes":"","Query?string":"","partner":"-","AgentVersion":"ApacheBench/2.3"}

{"clientip":"192.168.56.12","ClientUser":"-","authenticated":"-","AccessTime":"[28/Dec/2017:09:52:57 +0800]","method":"GET /webdir2/index.html HTTP/1.0","status":"","SendBytes":"","Query?string":"","partner":"-","AgentVersion":"ApacheBench/2.3"}

{"clientip":"192.168.56.12","ClientUser":"-","authenticated":"-","AccessTime":"[28/Dec/2017:09:52:56 +0800]","method":"GET /webdir2/index.html HTTP/1.0","status":"","SendBytes":"","Query?string":"","partner":"-","AgentVersion":"ApacheBench/2.3"}

{"clientip":"192.168.56.12","ClientUser":"-","authenticated":"-","AccessTime":"[28/Dec/2017:09:52:57 +0800]","method":"GET /webdir2/index.html HTTP/1.0","status":"","SendBytes":"","Query?string":"","partner":"-","AgentVersion":"ApacheBench/2.3"}

{"clientip":"192.168.56.12","ClientUser":"-","authenticated":"-","AccessTime":"[28/Dec/2017:09:52:57 +0800]","method":"GET /webdir2/index.html HTTP/1.0","status":"","SendBytes":"","Query?string":"","partner":"-","AgentVersion":"ApacheBench/2.3"}
2.5、配置logstash
[root@linux-node2 ~]# vim /etc/logstash/conf.d/tomcat_accesslog.conf

input {

        file {

                path => "/usr/local/tomcat/logs/tomcat_access_log.*.log"

                type => "tomcat-accesslog"

                start_position => "beginning"

                stat_interval => ""

        }

}

output {

        elasticsearch {

                hosts => ["192.168.56.11:9200"]

                index => "logstash-tomcat5612-accesslog-%{+YYYY.MM.dd}"

        }

        file {

                path => "/tmp/logstash-tomcat5612-accesslog-%{+YYYY.MM.dd}"

        }

}
2.6、检查logstash的配置语法并重启logstash
[root@linux-node2 tomcat]# /usr/share/logstash/bin/logstash -f /etc/logstash/conf.d/tomcat_accesslog.conf -t

OpenJDK -Bit Server VM warning: If the number of processors is expected to increase from one, then you should configure the number of parallel GC threads appropriately using -XX:ParallelGCThreads=N

WARNING: Could not find logstash.yml which is typically located in $LS_HOME/config or /etc/logstash. You can specify the path using --path.settings. Continuing using the defaults

Could not find log4j2 configuration at path /usr/share/logstash/config/log4j2.properties. Using default config which logs errors to the console

Configuration OK

[root@linux-node2 tomcat]# systemctl restart logstash

[root@linux-node2 tomcat]# ps -ef |grep logstash

logstash         : ?        :: /bin/java -XX:+UseParNewGC -XX:+UseConcMarkSweepGC -XX:CMSInitiatingOccupancyFraction= -XX:+UseCMSInitiatingOccupancyOnly -XX:+DisableExplicitGC -Djava.awt.headless=true -Dfile.encoding=UTF- -XX:+HeapDumpOnOutOfMemoryError -Xmx1g -Xms256m -Xss2048k -Djffi.boot.library.path=/usr/share/logstash/vendor/jruby/lib/jni -Xbootclasspath/a:/usr/share/logstash/vendor/jruby/lib/jruby.jar -classpath : -Djruby.home=/usr/share/logstash/vendor/jruby -Djruby.lib=/usr/share/logstash/vendor/jruby/lib -Djruby.script=jruby -Djruby.shell=/bin/sh org.jruby.Main /usr/share/logstash/lib/bootstrap/environment.rb logstash/runner.rb --path.settings /etc/logstash

root          : pts/    :: grep --color=auto logstash
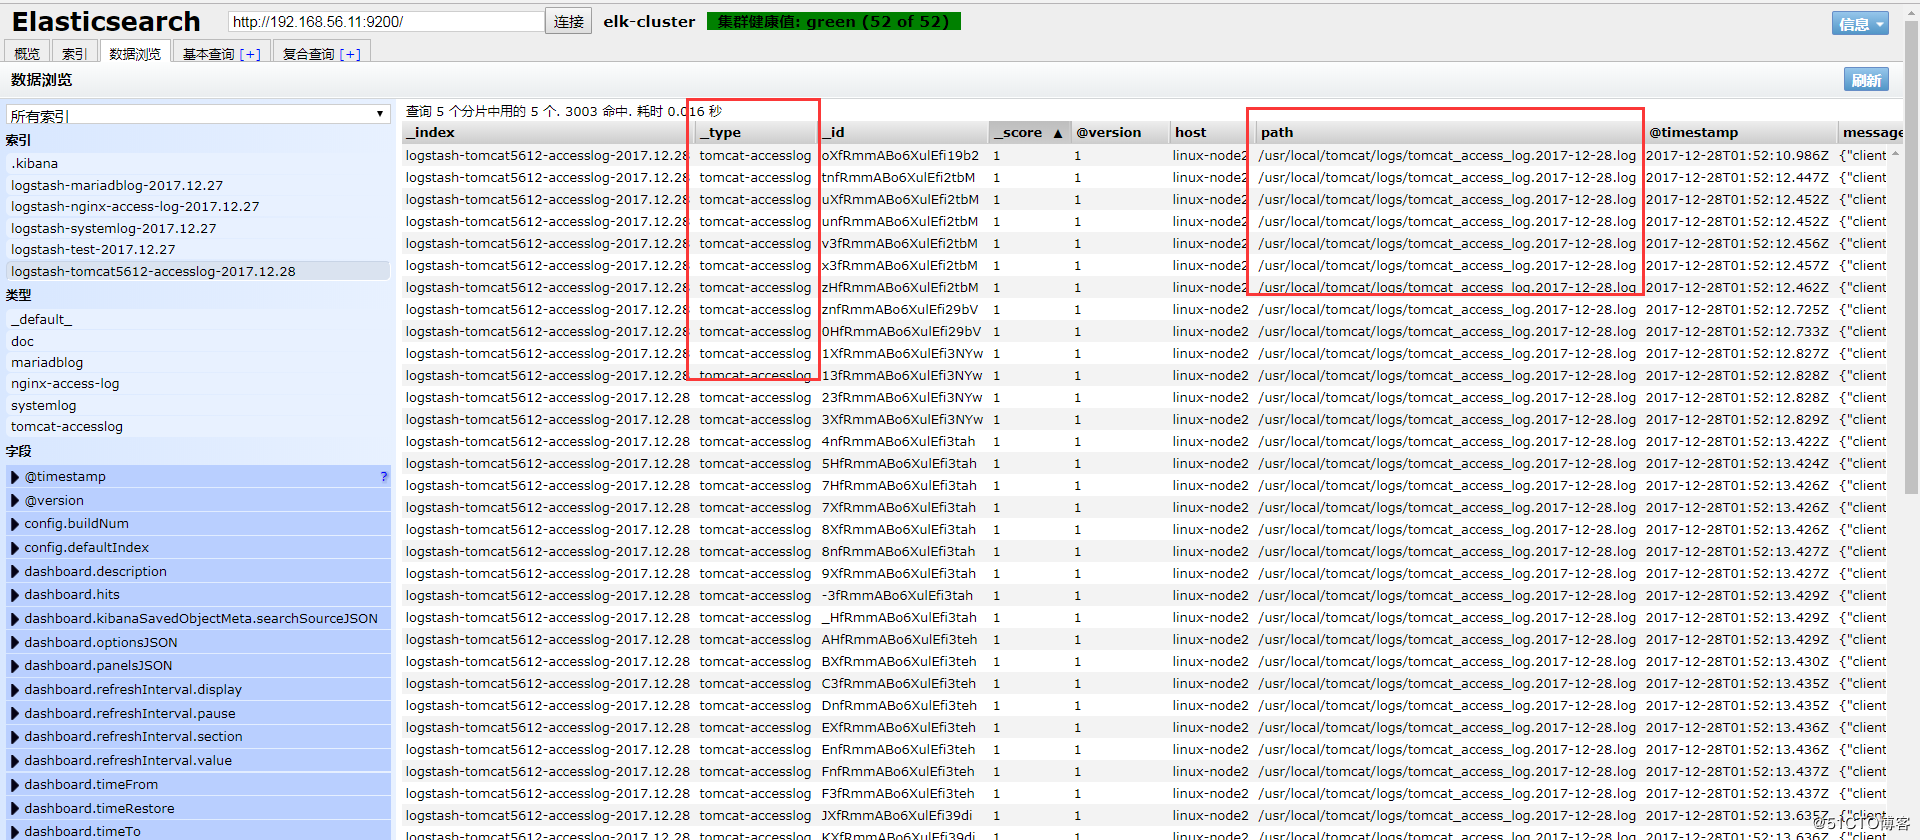
2.7、elasticsearch的head插件查看
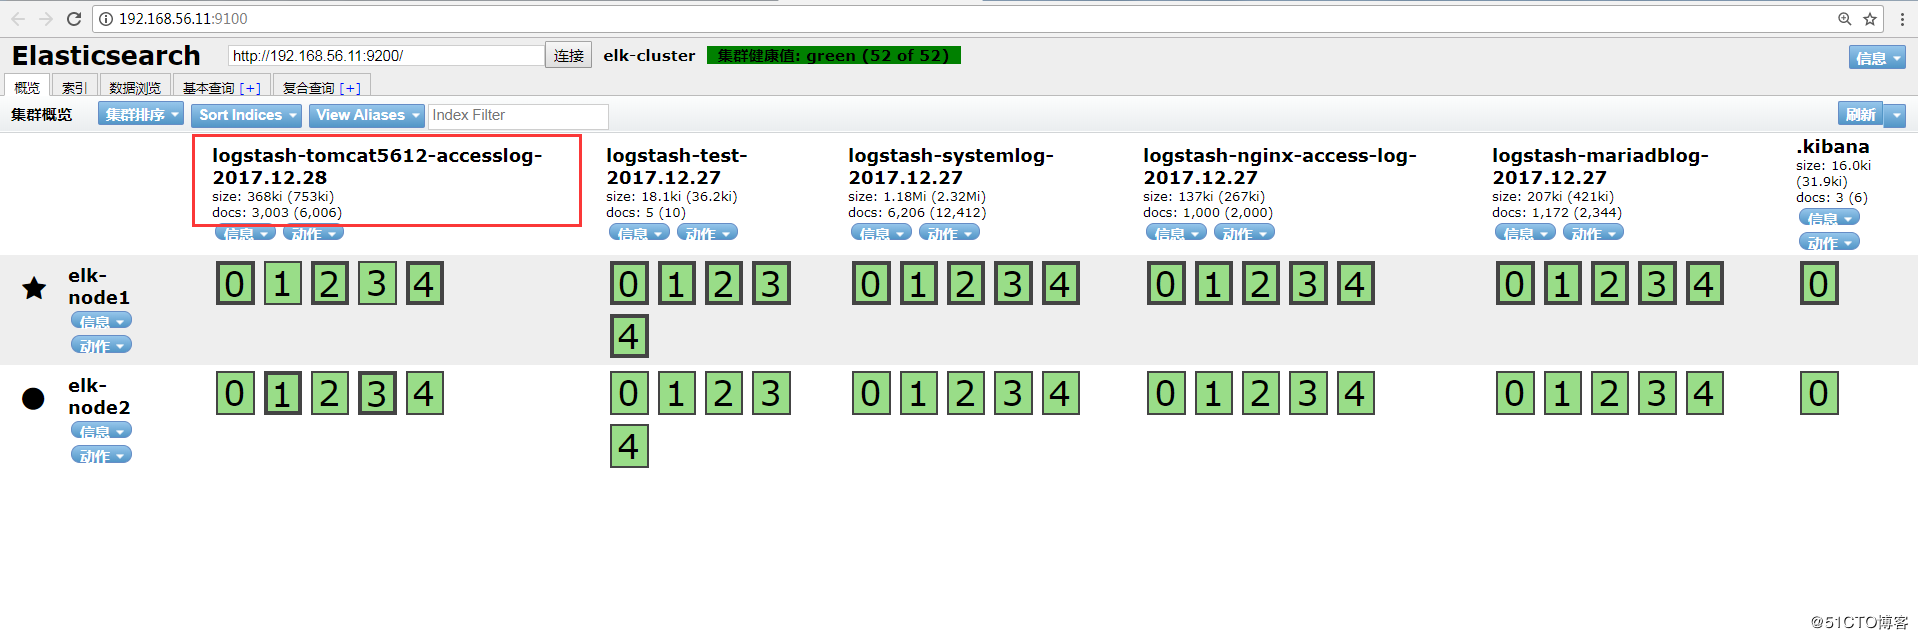
数据浏览:
注:此处如果无法出现tomcat的数据索引,查看一下是否有权限访问日志。
[root@linux-node2 logs]# ll /usr/local/tomcat/logs/ -d

drwxr-x---  root root  12月  : /usr/local/tomcat/logs/

[root@linux-node2 logs]# chmod  /usr/local/tomcat/logs

[root@linux-node2 logs]# ll /usr/local/tomcat/logs/

总用量

-rw-r-----  root root    12月  : catalina.--.log

-rw-r-----  root root    12月  : catalina.out

-rw-r-----  root root       12月  : host-manager.--.log

-rw-r-----  root root     12月  : localhost.--.log

-rw-r-----  root root       12月  : manager.--.log

-rw-r-----  root root  12月  : tomcat_access_log.--.log

[root@linux-node2 logs]# chmod  /usr/local/tomcat/logs/
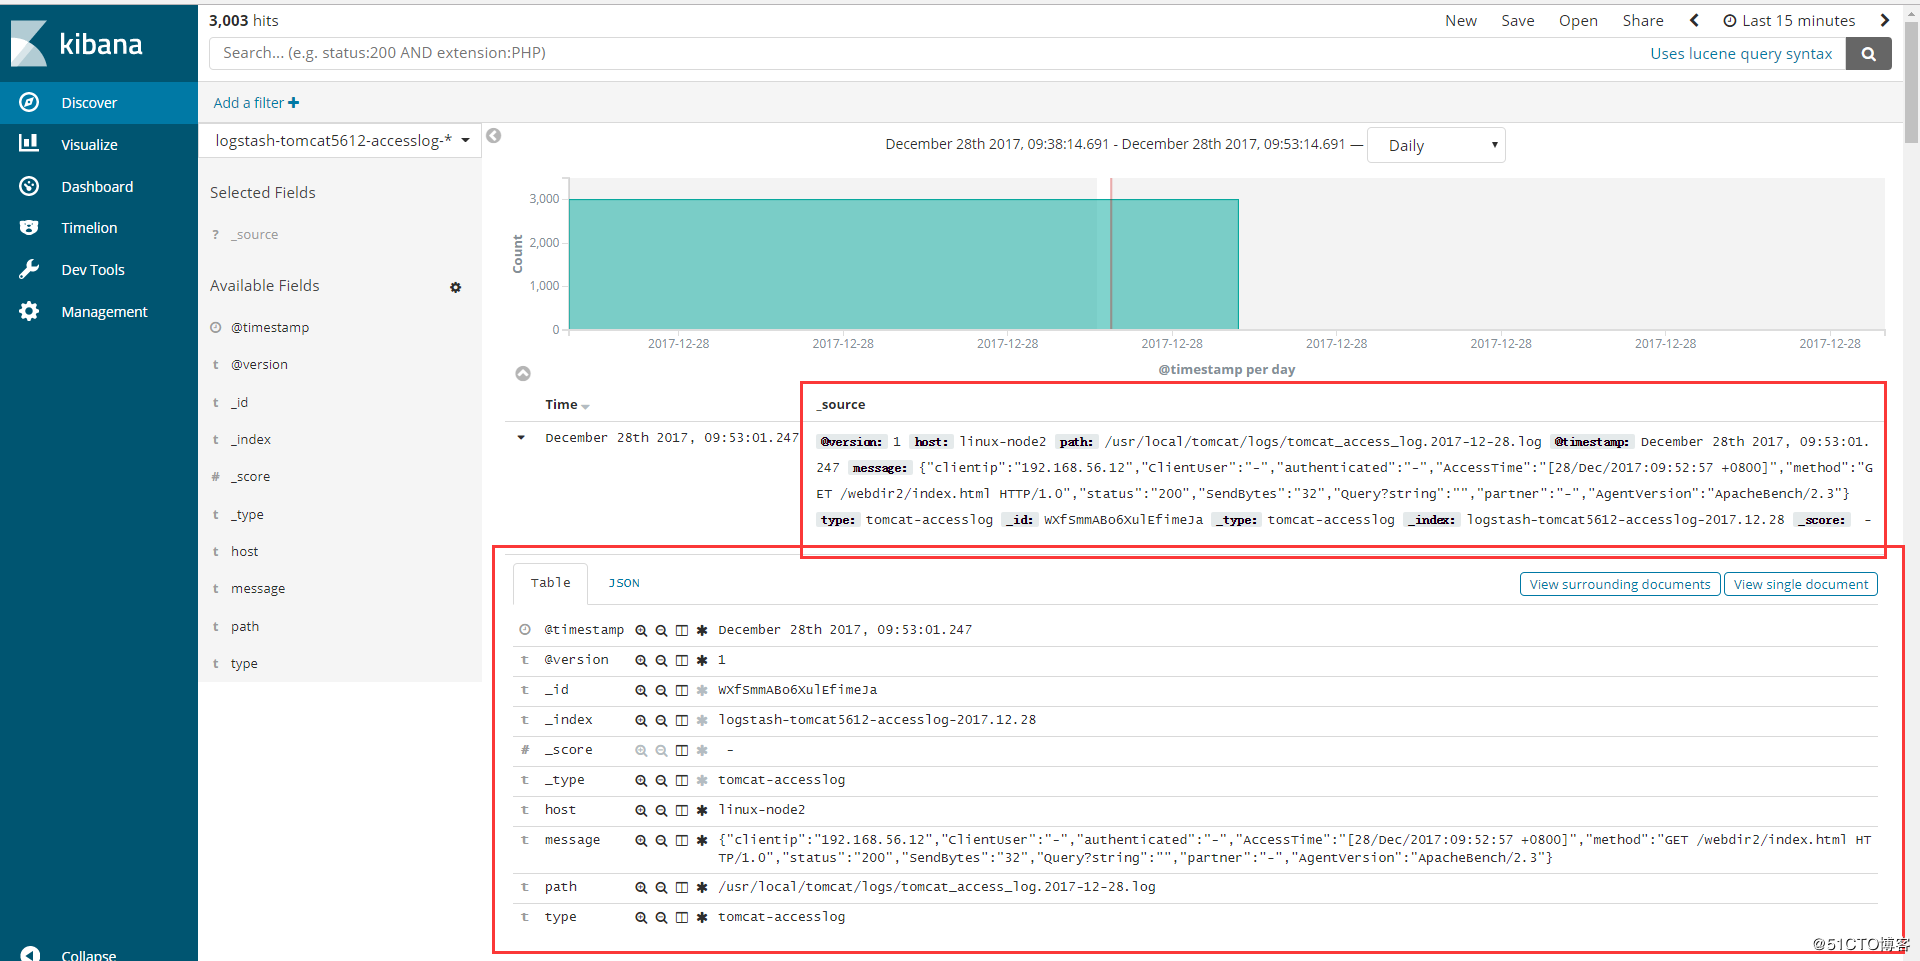
2.8、添加到Kibana
3、Java日志收集
使用codec的multiline插件实现多行匹配,这是一个可以将多行进行合并的插件,而且可以使用what指定将匹配到的行与前面的行合并还是和后面的行合并。
https://www.elastic.co/guide/en/logstash/6.0/plugins-codecs-multiline.html
语法例子:

input {

  stdin {

    codec => multiline {    #使用multiline插件

      pattern => "pattern, a regexp"   #正则匹配

      negate => "true" or "false"     #匹配是否成功

      what => "previous" or "next"   #和上面的还是和下面的内容合并

    }

  }

}

命令行测试输入输出

[root@linux-node1 ~]# /usr/share/logstash/bin/logstash -e 'input { stdin {codec => multiline { pattern => "^\[" negate => "true" what => "previous"} }} output { stdout {codec => rubydebug}}'

OpenJDK -Bit Server VM warning: If the number of processors is expected to increase from one, then you should configure the number of parallel GC threads appropriately using -XX:ParallelGCThreads=N

WARNING: Could not find logstash.yml which is typically located in $LS_HOME/config or /etc/logstash. You can specify the path using --path.settings. Continuing using the defaults

Could not find log4j2 configuration at path /usr/share/logstash/config/log4j2.properties. Using default config which logs errors to the console

The stdin plugin is now waiting for input:

[

{

      "@version" => "",

          "host" => "linux-node1",

    "@timestamp" => --28T03::.663Z,

       "message" => "111111111\n22222222222\n333333333",   #会将[开头前面的进行合并

          "tags" => [

        [] "multiline"

    ]

}

[

{

      "@version" => "",

          "host" => "linux-node1",

    "@timestamp" => --28T03::.326Z,

       "message" => "[5555555555\n666666666666666666\n77777777777777777\n8888888888",

          "tags" => [

        [] "multiline"

    ]

}
3.1、举例
(1)查看elk集群日志
elk集群日志上都是以”[“开头并且每一个信息都是如此,寻找规律
[root@linux-node1 ~]# tailf /data/logs/elk-cluster.log

[--28T09::,][INFO ][o.e.c.s.MasterService    ] [elk-node1] zen-disco-node-join[{elk-node2}{CcF5fl9sRqCAGYYpT3scuw}{ncgZ1UsPRq-iz6zWHPl7PQ}{192.168.56.12}{192.168.56.12:}], reason: added {{elk-node2}{CcF5fl9sRqCAGYYpT3scuw}{ncgZ1UsPRq-iz6zWHPl7PQ}{192.168.56.12}{192.168.56.12:},}

[--28T09::,][INFO ][o.e.c.s.ClusterApplierService] [elk-node1] added {{elk-node2}{CcF5fl9sRqCAGYYpT3scuw}{ncgZ1UsPRq-iz6zWHPl7PQ}{192.168.56.12}{192.168.56.12:},}, reason: apply cluster state (from master [master {elk-node1}{Ulw9eIPlS06sl8Z6zQ_z4g}{HgJRMEAcQcqFOTn5ehHPdw}{192.168.56.11}{192.168.56.11:} committed version [] source [zen-disco-node-join[{elk-node2}{CcF5fl9sRqCAGYYpT3scuw}{ncgZ1UsPRq-iz6zWHPl7PQ}{192.168.56.12}{192.168.56.12:}]]])

[--28T09::,][WARN ][o.e.d.z.ElectMasterService] [elk-node1] value for setting "discovery.zen.minimum_master_nodes" is too low. This can result in data loss! Please set it to at least a quorum of master-eligible nodes (current value: [-], total number of master-eligible nodes used for publishing in this round: [])

[--28T09::,][INFO ][o.e.c.r.a.AllocationService] [elk-node1] Cluster health status changed from [YELLOW] to [GREEN] (reason: [shards started [[.kibana][]] ...]).

[--28T09::,][INFO ][o.e.c.m.MetaDataCreateIndexService] [elk-node1] [logstash-tomcat5612-accesslog-2017.12.] creating index, cause [auto(bulk api)], templates [logstash], shards []/[], mappings [_default_]

[--28T09::,][INFO ][o.e.c.m.MetaDataMappingService] [elk-node1] [logstash-tomcat5612-accesslog-2017.12./YY4yqUQJRHa2mRUwmd2Y8g] create_mapping [tomcat-accesslog]

[--28T09::,][INFO ][o.e.c.r.a.AllocationService] [elk-node1] Cluster health status changed from [YELLOW] to [GREEN] (reason: [shards started [[logstash-tomcat5612-accesslog-2017.12.][]] ...]).
(2)配置logstash
[root@linux-node1 ~]# vim /etc/logstash/conf.d/java.conf

input {

        file{

                path => "/data/logs/elk-cluster.log"

                type => "elasticsearch-java-log"

                start_position => "beginning"

                stat_interval => ""

                code => multiline {

                        pattern => "^\["    #以"["开头进行正则匹配,匹配规则

                        negate => "true"  #正则匹配成功,false匹配不成功

                        what => "previous"  #和前面的内容进行合并,如果是和下面的合并就是next

                }

        }

}

output {

        if [type] == "elasticsearch-java-log" {

                elasticsearch {

                        hosts => ["192.168.56.11:9200"]

                        index => "elasticsearch-jva-log-%{+YYYY.MM.dd}"

                }

        }

}

[root@linux-node1 ~]# /usr/share/logstash/bin/logstash -f /etc/logstash/conf.d/java.conf -t

OpenJDK -Bit Server VM warning: If the number of processors is expected to increase from one, then you should configure the number of parallel GC threads appropriately using -XX:ParallelGCThreads=N

WARNING: Could not find logstash.yml which is typically located in $LS_HOME/config or /etc/logstash. You can specify the path using --path.settings. Continuing using the defaults

Could not find log4j2 configuration at path /usr/share/logstash/config/log4j2.properties. Using default config which logs errors to the console

Configuration OK

[root@linux-node1 ~]# systemctl restart logstash
(3)elasticsearch的head插件查看
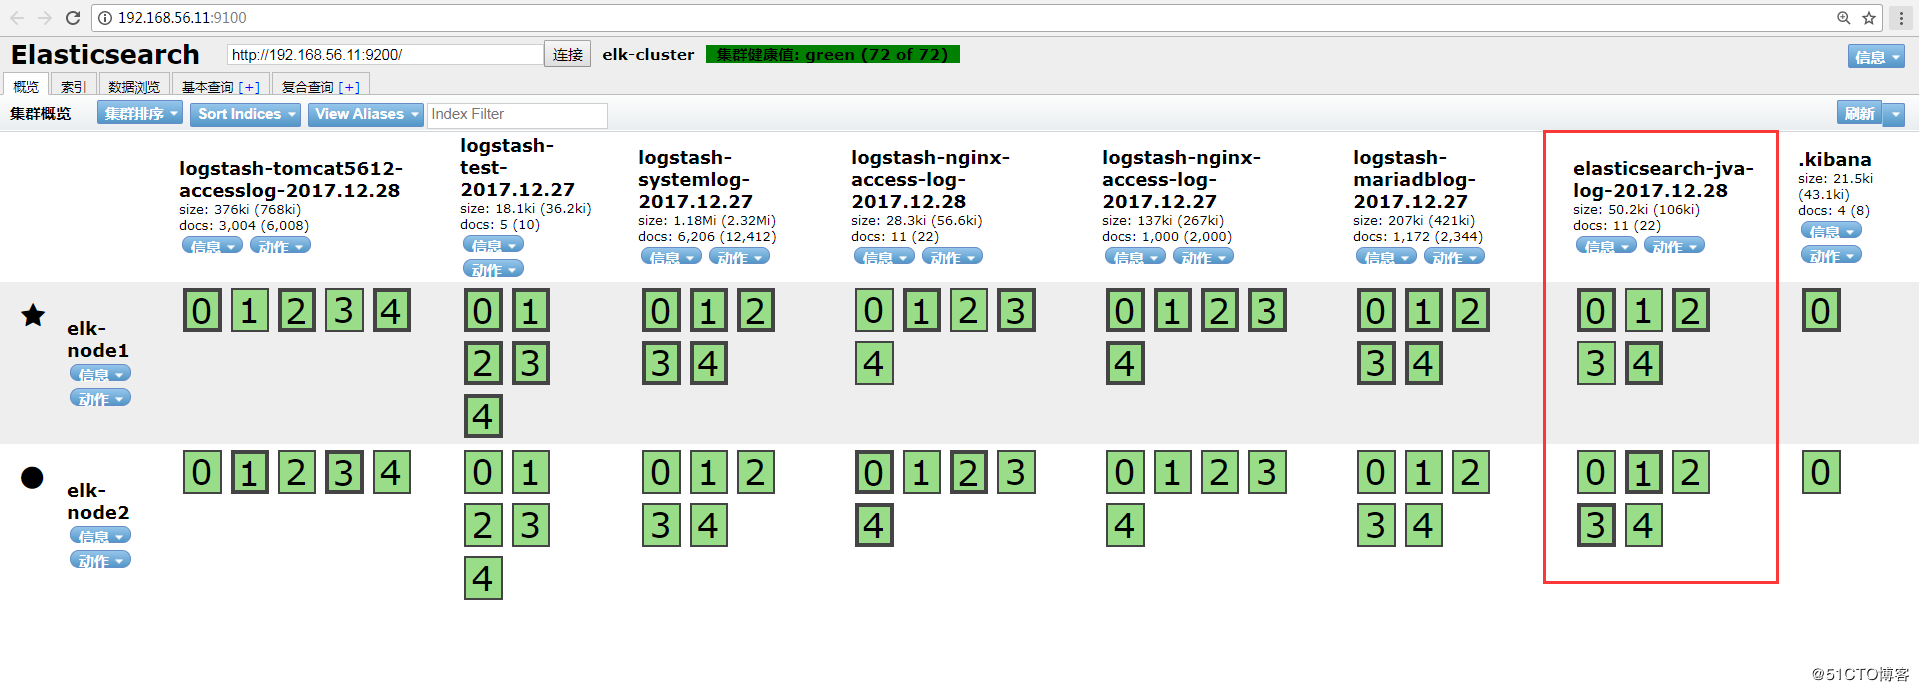
数据浏览:
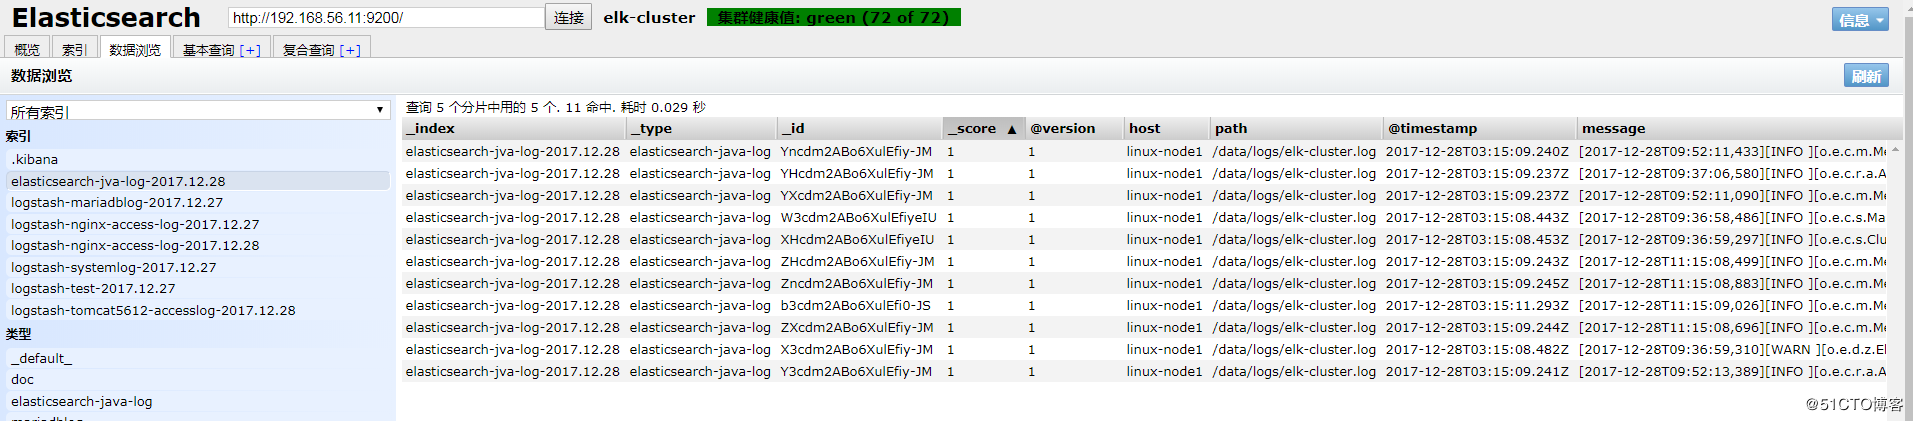
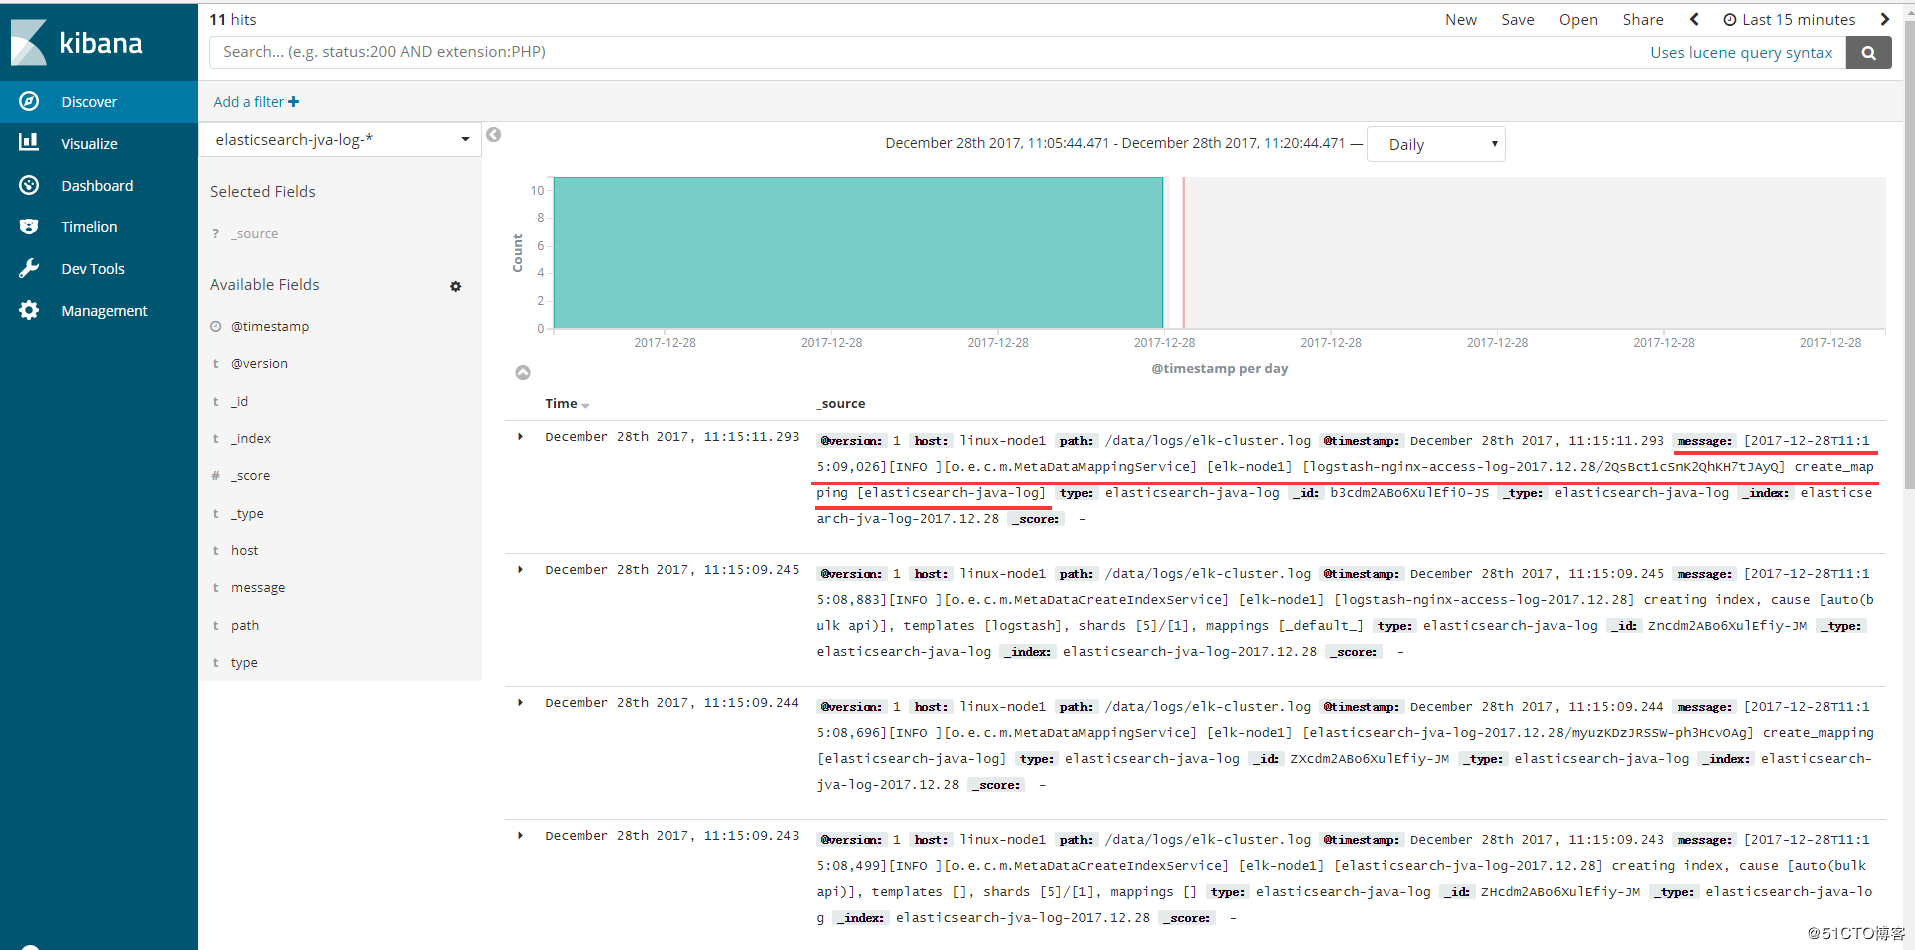
(4)添加到Kibana

可以看到以“[”开头的信息都合并了,如图:
4、TCP收集日志使用场景
tcp模块的使用场景如下: 有一台服务器A只需要收集一个日志,那么我们就可以不需要在这服务器上安装logstash,我们通过在其他logstash上启用tcp模块,监听某个端口,然后我们在这个服务器A把日志通过nc发送到logstash上即可。
4.1、标准输出测试TCP模块
[root@linux-node2 ~]# cat /etc/logstash/conf.d/tcp.conf

input {

    tcp{

        port => ""    #监听5600端口

        mode => "server"   #模式为server

        type => "tcplog"     #类型为tcplog

    }

}

output {

    stdout {

        codec => rubydebug

    }

}

#检测配置文件语法:

[root@linux-node2 conf.d]# /usr/share/logstash/bin/logstash -f /etc/logstash/conf.d/tcp.conf -t

OpenJDK -Bit Server VM warning: If the number of processors is expected to increase from one, then you should configure the number of parallel GC threads appropriately using -XX:ParallelGCThreads=N

WARNING: Could not find logstash.yml which is typically located in $LS_HOME/config or /etc/logstash. You can specify the path using --path.settings. Continuing using the defaults

Could not find log4j2 configuration at path /usr/share/logstash/config/log4j2.properties. Using default config which logs errors to the console

Configuration OK

#node1节点上安装nc命令,并发送日志到node2。Netcat简称nc,在网络工具中具有“瑞士×××”美誉,其功能实用,是一个简单,可靠的网络工具,可通过TCP或UDP协议传输读写数据,另外还具有很多其他功能。

[root@linux-node1 ~]# yum install -y nc

#通过nc来发送日志

[root@linux-node1 ~]# echo "hello world" | nc 192.168.56.12

#linux-node2终端上查看日志输出信息:

[root@linux-node2 conf.d]# /usr/share/logstash/bin/logstash -f /etc/logstash/conf.d/tcp.conf

OpenJDK -Bit Server VM warning: If the number of processors is expected to increase from one, then you should configure the number of parallel GC threads appropriately using -XX:ParallelGCThreads=N

WARNING: Could not find logstash.yml which is typically located in $LS_HOME/config or /etc/logstash. You can specify the path using --path.settings. Continuing using the defaults

Could not find log4j2 configuration at path /usr/share/logstash/config/log4j2.properties. Using default config which logs errors to the console

{

    "@timestamp" => --02T00::.356Z,

          "port" => ,

      "@version" => "",

          "host" => "linux-node1",

      "@metdata" => {

        "ip_address" => "192.168.56.11"

    },

       "message" => "hello world",

          "type" => "tcplog"

}

#可以看到linux-node2上有监听5600端口

[root@linux-node2 ~]# netstat -tunlp |grep

tcp6              :::                 :::*                    LISTEN      /java

#还可以将某个文件发送到nc

[root@linux-node1 ~]# nc 192.168.56.12  < /etc/passwd

[root@linux-node2 conf.d]# /usr/share/logstash/bin/logstash -f /etc/logstash/conf.d/tcp.conf

OpenJDK -Bit Server VM warning: If the number of processors is expected to increase from one, then you should configure the number of parallel GC threads appropriately using -XX:ParallelGCThreads=N

WARNING: Could not find logstash.yml which is typically located in $LS_HOME/config or /etc/logstash. You can specify the path using --path.settings. Continuing using the defaults

Could not find log4j2 configuration at path /usr/share/logstash/config/log4j2.properties. Using default config which logs errors to the console

    "@timestamp" => --02T01::.530Z,

          "port" => ,

      "@version" => "",

          "host" => "linux-node1",

      "@metdata" => {

        "ip_address" => "192.168.56.11"

    },

       "message" => "root:x:0:0:root:/root:/bin/bash",

          "type" => "tcplog"

}

{

    "@timestamp" => --02T01::.531Z,

          "port" => ,

      "@version" => "",

          "host" => "linux-node1",

      "@metdata" => {

        "ip_address" => "192.168.56.11"

    },

       "message" => "bin:x:1:1:bin:/bin:/sbin/nologin",

          "type" => "tcplog"

}

......

#也可以通过这种方式伪设备的方式发送日志:(在类unix操作系统中,设备节点并一定要对应物理设备。没有这种对应关系的设备是伪设备。操作系统运用了它们提供的多种功能,tcp只是dev下面众多伪设备当中的一种设备。)

[root@linux-node1 ~]# echo "" > /dev/tcp/192.168.56.12/

[root@linux-node2 conf.d]# /usr/share/logstash/bin/logstash -f /etc/logstash/conf.d/tcp.conf

OpenJDK -Bit Server VM warning: If the number of processors is expected to increase from one, then you should configure the number of parallel GC threads appropriately using -XX:ParallelGCThreads=N

WARNING: Could not find logstash.yml which is typically located in $LS_HOME/config or /etc/logstash. You can specify the path using --path.settings. Continuing using the defaults

Could not find log4j2 configuration at path /usr/share/logstash/config/log4j2.properties. Using default config which logs errors to the console

{

    "@timestamp" => --02T01::.922Z,

          "port" => ,

      "@version" => "",

          "host" => "linux-node1",

      "@metdata" => {

        "ip_address" => "192.168.56.11"

    },

       "message" => "",

          "type" => "tcplog"

}
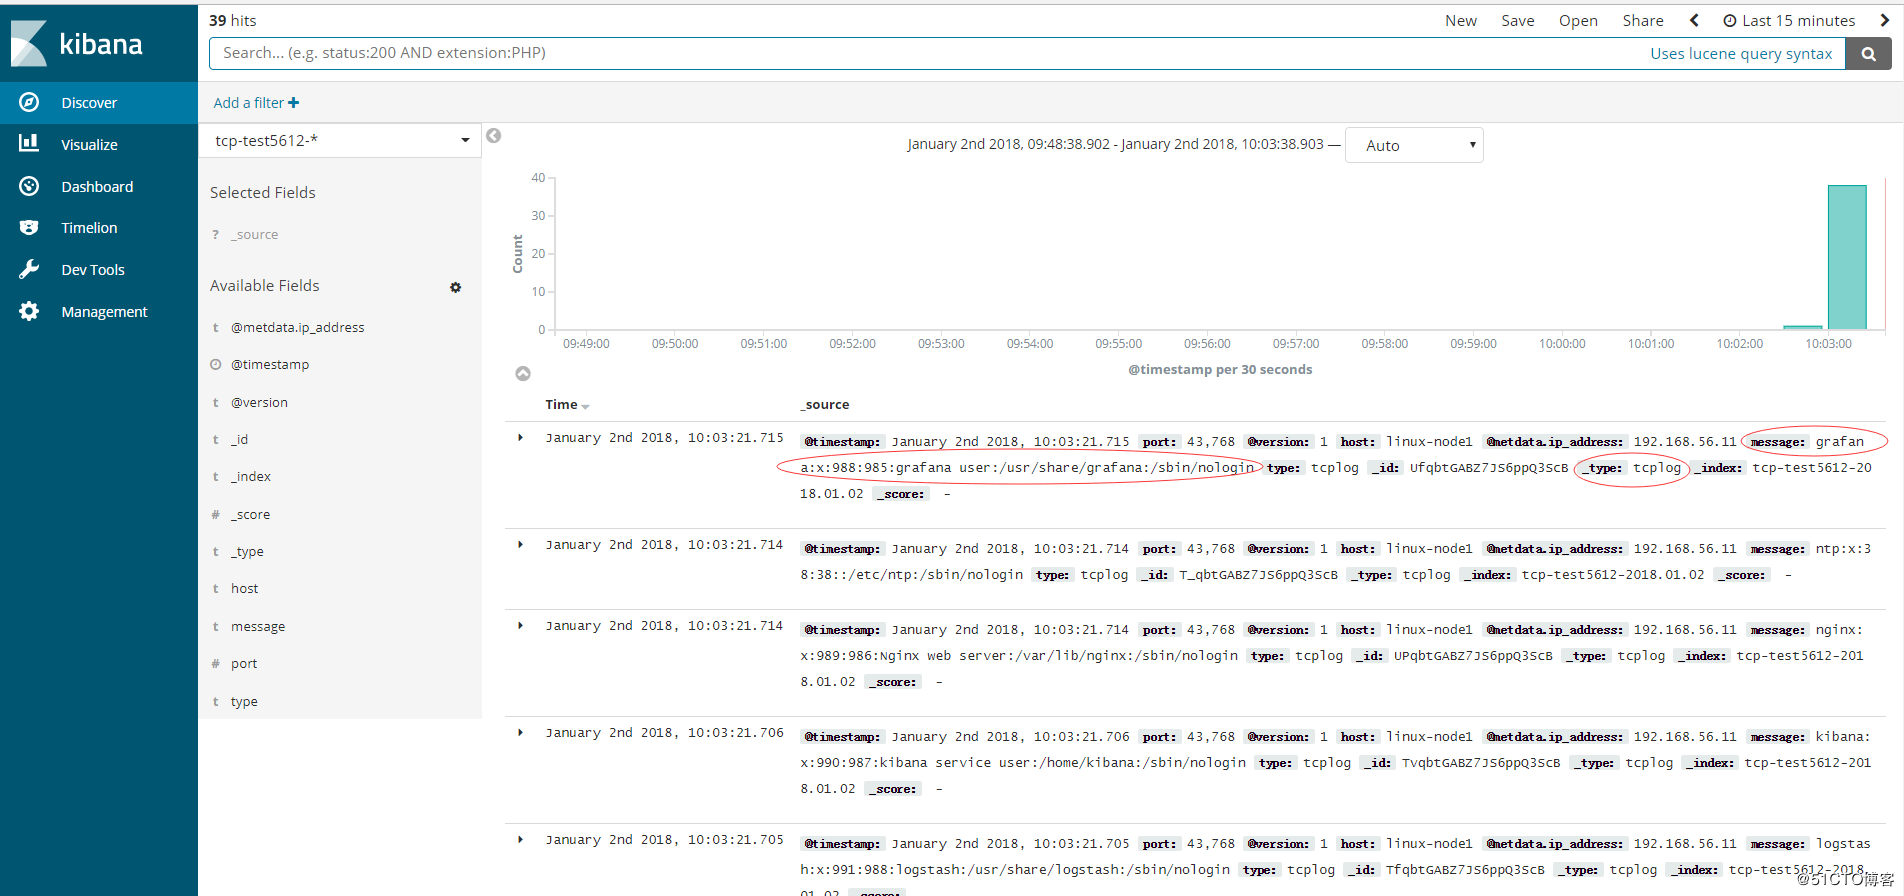
4.2、配置logstash通过TCP收集输出到elasticsearch
[root@linux-node2 conf.d]# vim tcp.conf

input {

        tcp{

                port => ""

                mode => "server"

                type => "tcplog"

        }

}

output {

        elasticsearch {

                hosts => ["192.168.56.11:9200"]

                index => "tcp-test5612-%{+YYYY.MM.dd}"

        }

        file {

                path => "/tmp/tcp-test5612-%{+YYYY.MM.dd}"

        }

}

[root@linux-node2 conf.d]# /usr/share/logstash/bin/logstash -f /etc/logstash/conf.d/tcp.conf -t

OpenJDK -Bit Server VM warning: If the number of processors is expected to increase from one, then you should configure the number of parallel GC threads appropriately using -XX:ParallelGCThreads=N

WARNING: Could not find logstash.yml which is typically located in $LS_HOME/config or /etc/logstash. You can specify the path using --path.settings. Continuing using the defaults

Could not find log4j2 configuration at path /usr/share/logstash/config/log4j2.properties. Using default config which logs errors to the console

Configuration OK

[root@linux-node2 conf.d]# systemctl restart logstash

[root@linux-node1 elasticsearch-head]# echo "hello world" |nc 192.168.56.12

[root@linux-node1 elasticsearch-head]# nc 192.168.56.12  < /etc/passwd
HEAD插件查看:
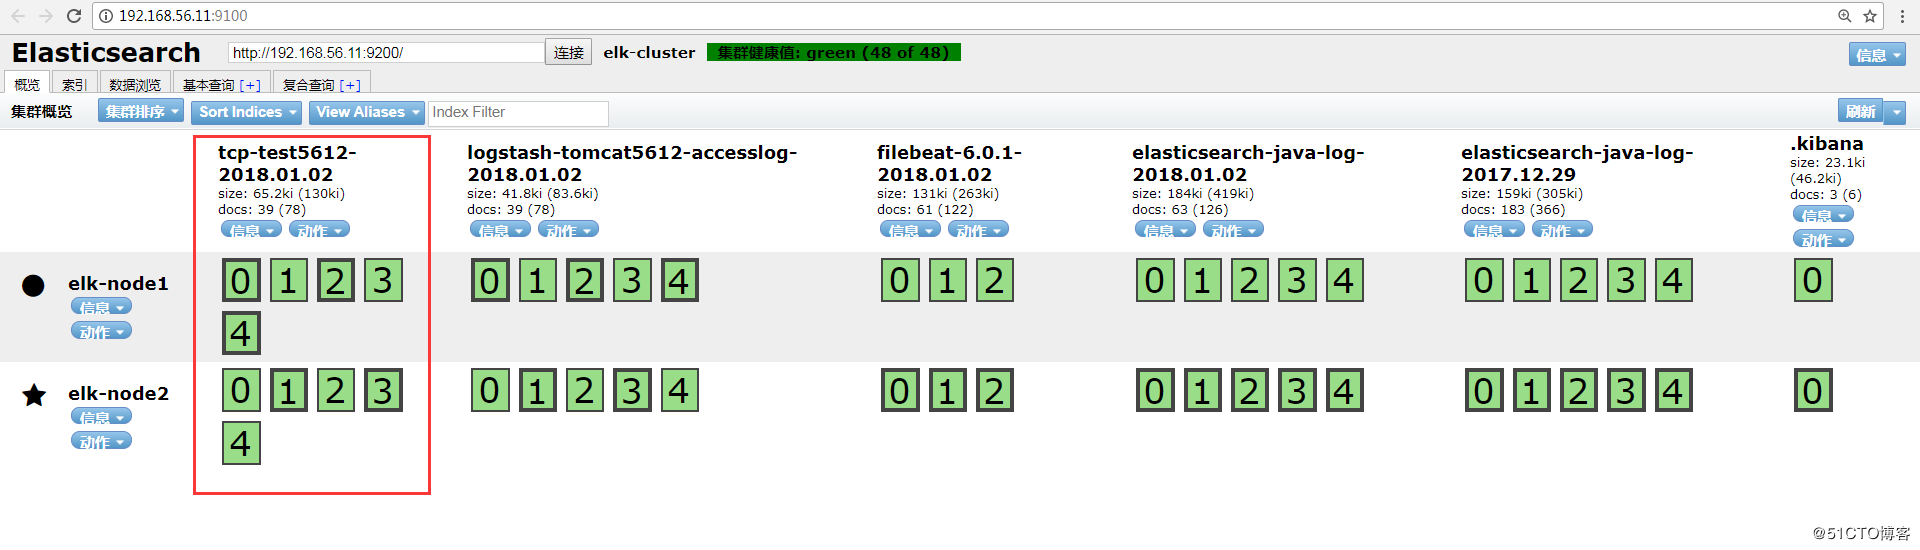
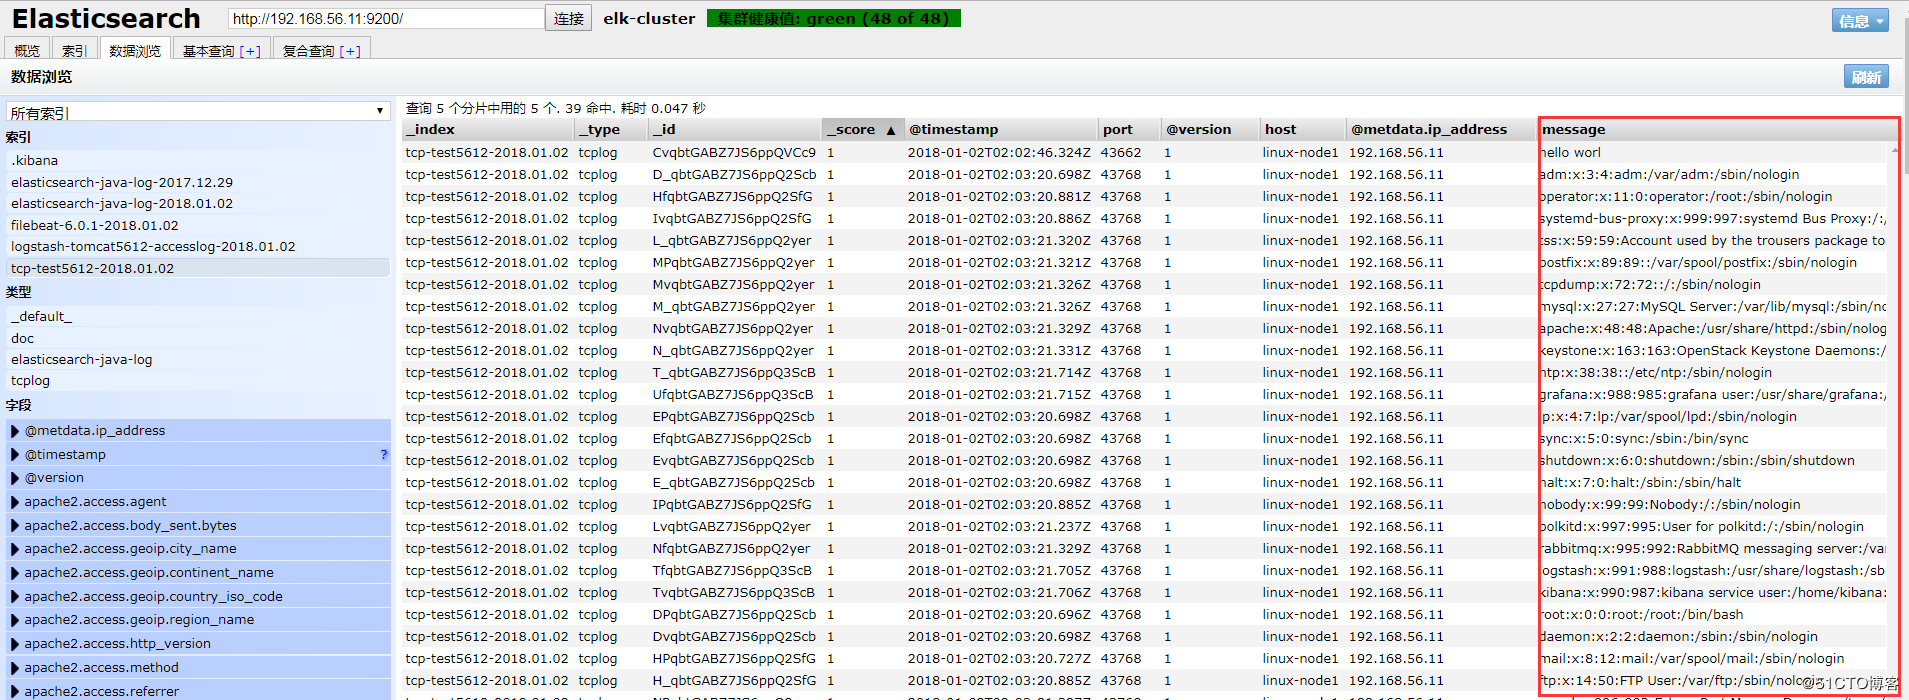
Kibana添加索引查看:
ELKStack入门篇(二)之Nginx、Tomcat、Java日志收集以及TCP收集日志使用的更多相关文章
- nginx+tomcat+java部署总结
昨天部署了一下nginx+tomcat+java出现了很多问题,以下为整理总结. 使用了两种部署方式,一种是源码部署,一种是war部署. java源码部署总结: 环境:nginx+tomcat 部署方 ...
- 【SSRS】入门篇(二) -- 建立数据源
原文:[SSRS]入门篇(二) -- 建立数据源 通过 [SSRS]入门篇(一) -- 创建SSRS项目 这篇,我们建立了一个SSRS项目: 接下来,我们以 AdventureWorks2012 示例 ...
- centos7最小版本安装nginx+tomcat+java+mysql运行环境
最近项目从windows搬到linux,由于项目组成员有限并且有其它紧急的任务需要处理,因而这个任务就落到我的头上了.下面记录下centos最小版本安装nginx+tomcat+mysql+java的 ...
- ELKStack入门篇(一)之ELK部署和使用
一.ELKStack简介 1.ELK介绍 中文指南:https://www.gitbook.com/book/chenryn/elk-stack-guide-cn/details ELK Stack包 ...
- ELKStack入门篇(四)之Filebeat
Filebeat是轻量级单用途的日志收集工具,用于在没有安装java的服务器上专门收集日志,可以将日志转发到logstash.elasticsearch或redis等场景中进行下一步处理. 官方文档: ...
- ELK之收集Java日志、通过TCP收集日志
1.Java日志收集 使用codec的multiline插件实现多行匹配,这是一个可以将多行进行合并的插件,而且可以使用what指定将匹配到的行与前面的行合并还是和后面的行合并. 语法示例: inpu ...
- java菜鸟篇<二> eclipse启动tomcat报错的问题:Exception: java.lang.OutOfMemoryError thrown from the UncaughtExceptionHandler in thread "main"
9.1今天不知道自己瞎搞eclipse的时候按到了什么键,然后再启动程序的时候就会报错: 如下: Exception: java.lang.OutOfMemoryError thrown from t ...
- 搭建nginx+tomcat+Java的负载均衡环境
转载 未测 供参考 另外这篇文章也不错.http://blog.csdn.net/wang379275614/article/details/47778201 一.简介: Tomcat在高并发环境下 ...
- linux CentOS YUM 安装 nginx+tomcat+java+mysql运行环境
Java环境配置 1 安装JDK 查看CentOS自带JDK是否已安装 1 [root@test ~]# yum list installed |grep java 若有自带安装的JDK,应如下操作进 ...
随机推荐
- Java虚拟机6:垃圾收集(GC)-1(内存溢出和内存泄漏的区别)
1.前言 在进行垃圾收集之前需要普及几个比较重要的概念. 2.内存溢出和内存泄露的概念和区别: (1):内存溢出(out of memory):是指程序在申请内存时,没有足够的内存空间可以分配,系统不 ...
- 3109. [CQOI2013]新数独【DFS】
Description Input 输入一共15行,包含一个新数独的实例.第奇数行包含左右方向的符号(<和>),第偶数行包含上下方向的符号(^和v). Output 输出包含9行,每行 ...
- ssrf绕过记录
第一道题来自2018 上海市大学生网络安全大赛线上赛web01 if(isset($_POST['url']) && parse_url($_POST['url'])['host']= ...
- Qt中QScrollArea类的简单使用心得
平台:windows 64位 Qt版本:5.5.1 MinGW 32bit 根据自己目前的需求简单说下怎么在QScrollArea滚动窗口中实现多个控件的滚动显示,先看看最 ...
- CentOS7图文安装教程
CentOS 7下载: CentOS 7只提供64位版本,虽然有不少国内镜像节点,不过还是觉得通过BT下载是不错的选择.镜像大小6.7G,联通20M光纤下载,不到小时.以下是中国大陆的下载地址列表: ...
- nginx开启gzip
gzip on; gzip_min_length 5k; gzip_buffers 4 16k; #gzip_http_version 1.0; gzip_comp_level 3; gzip_typ ...
- echo图片延迟加载js
插件描述:和 Lazy Load 一样,Echo.js 也是一个用于图像延迟加载 JavaScript.不同的是 Lazy Load 是基于 jQuery 的插件,而 Echo.js 不依赖于 jQu ...
- 接口测试Jmeter+Fiddler组合
接口测试Jmeter+Fiddler组合 在使用完Jmeter在做接口测试之后,个人感觉Jmeter比loadrunner好用,原因是界面操作更加直观,不必像loadrunner在写接口请求函数的时候 ...
- Java 常见BUG 整理
1.BigDecimal初始化double 2.Integer java对于-128到127之间的数,会进行缓存,这个范围的Integer对象是同一个! == 是ok,但是超出这个范围就不可以用 ...
- python2.7+pyqt+eric基本控件操作
一.单选按钮被选中 1.选择 Radio Button 2.加入如下代码: #单选按钮状态切换时触发onstateChanged函数 self.radioButton.toggled.connect( ...