
ELKStack入门篇(一)之ELK部署和使用
一、ELKStack简介
1、ELK介绍
中文指南:https://www.gitbook.com/book/chenryn/elk-stack-guide-cn/details
ELK Stack包含:ElasticSearch、Logstash、Kibana
ElasticSearch是一个搜索引擎,用来搜索、分析、存储日志。它是分布式的,也就是说可以横向扩容,可以自动发现,索引自动分片,总之很强大。文档https://www.elastic.co/guide/cn/elasticsearch/guide/current/index.html
Logstash用来采集日志,把日志解析为json格式交给ElasticSearch。
Kibana是一个数据可视化组件,把处理后的结果通过web界面展示
Beats在这里是一个轻量级日志采集器,其实Beats家族有5个成员
早期的ELK架构中使用Logstash收集、解析日志,但是Logstash对内存、cpu、io等资源消耗比较高。相比 Logstash,Beats所占系统的CPU和内存几乎可以忽略不计
x-pack对Elastic Stack提供了安全、警报、监控、报表、图表于一身的扩展包,是收费的。
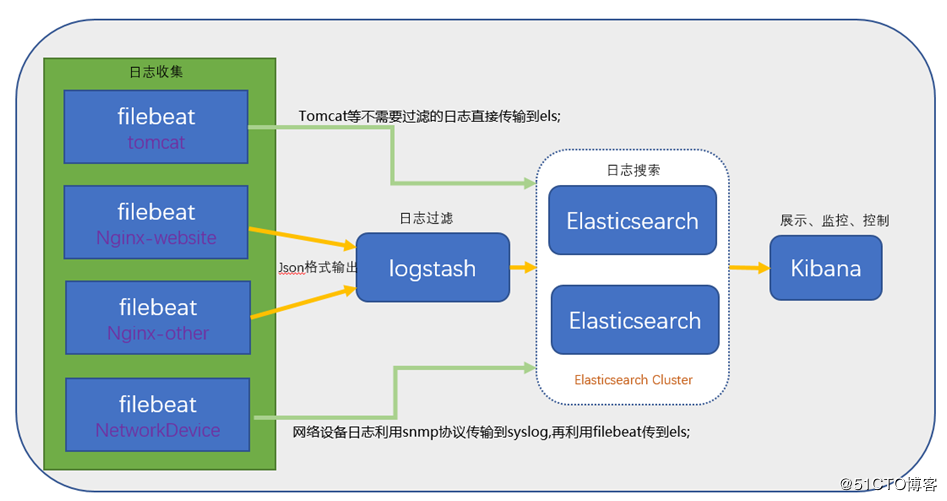
2、ELK架构图:
二、Elasticsearch部署
1、安装JDK
方法一:yum安装JDK

[root@linux-node1 ~]# yum install -y java

[root@linux-node1 ~]# java -version

openjdk version "1.8.0_151"

OpenJDK Runtime Environment (build 1.8.0_151-b12)

OpenJDK -Bit Server VM (build 25.151-b12, mixed mode)

方法二:源码安装JDK

下载

[root@linux-node1 ~]# wget http://download.oracle.com/otn-pub/java/jdk/8u151-b12/e758a0de34e24606bca991d704f6dcbf/jdk-8u151-linux-x64.tar.gz

配置Java环境

[root@linux-node1 ~]# tar zxf jdk-8u151-linux-x64.tar.gz -C /usr/local/

[root@linux-node1 ~]#  ln –s /usr/local/jdk1..0_91 /usr/local/jdk

[root@linux-node1 ~]# vim /etc/profile

export JAVA_HOME=/usr/local/jdk

export CLASSPATH=.:$JAVA_HOME/lib/dt.jar:$JAVA_HOME/lib/tools.jar

export PATH=$PATH:$JAVA_HOME/bin

[root@linux-node1 ~]# source /etc/profile

[root@linux-node1 ~]# java -version

★★★★注:linux-node2节点上也需要安装JDK
2、安装Elasticsearch
linux-node2节点也需要安装elasticsearch
使用yum安装elasticsearch会很慢,建议先下载:https://artifacts.elastic.co/downloads/elasticsearch/elasticsearch-6.0.0.rpm
(1)源码安装elasticsearch:
安装elasticsearch

[root@linux-node1 ~]# wget https://artifacts.elastic.co/downloads/elasticsearch/elasticsearch-6.0.0.rpm

[root@linux-node1 ~]# yum install -y elasticsearch-6.0..rpm

配置elasticsearch,linux-node2配置一个相同的节点,通过组播进行通信,会通过cluster进行查找,如果无法通过组播查询,修改成单播即可。

[root@linux-node1 ~]# vim /etc/elasticsearch/elasticsearch.yml

cluster.name:elk-cluster    #集群名称

node.name:elk-node1        #节点名称,一个集群之内节点的名称不能重复

path.data:/data/elkdata      #数据路径

path.logs:/data/logs              #日志路径

bootstrap.memory_lock:true      #锁住es内存,保证内存不分配至交换分区。

network.host:192.168.56.11       #网络监听地址

http.port:                       #用户访问查看的端口,9300是组件访问使用

discovery.zen,ping.unicast.hosts:["192.168.56.11","192.168.56.12"] #单播(配置一台即可,生产可以使用组播方式)

★★★注:内存锁定需要进行配置需要2G以上内存否则会导致无法启动elasticsearch。.x版本启用锁定内存,需要进行以下修改操作:

[root@linux-node1 ~]# systemctl edit elasticsearch

[Service]

LimitMEMLOCK=infinity

[root@linux-node1 ~]# systemctl daemon-reload

[root@linux-node1 ~]# mkdir /data/{elkdata,logs}   #创建数据目录和日志目录

[root@linux-node1 ~]# chown elasticsearch.elasticsearch /data -R

[root@linux-node1 ~]# systemctl start elasticsearch.service

[root@linux-node1 ~]# netstat -tulnp |grep java

tcp6              192.168.56.11:      :::*                    LISTEN      /java

tcp6              192.168.56.11:      :::*                    LISTEN      /java

将配置文件拷贝到linux-node2

[root@linux-node1 ~]# scp /etc/elasticsearch/elasticsearch.yml 192.168.56.12:/etc/elasticsearch/

[root@linux-node2 ~]# vim /etc/elasticsearch/elasticsearch.yml

修改:

node.name=elk-node2

network.host=192.168.56.12

[root@linux-node2 ~]# mkdir /data/{elkdata,logs}

[root@linux-node2 ~]# chown elasticsearch.elasticsearch /data -R

[root@linux-node2 ~]# systemctl start elasticsearch.service

[root@linux-node2 ~]# netstat -tulnp |grep java

tcp6              192.168.56.12:      :::*                    LISTEN      /java

tcp6              192.168.56.12:      :::*                    LISTEN      /java
(2)yum安装elasticsearch
.下载并安装GPG key

[root@linux-node1 ~]# rpm --import https://artifacts.elastic.co/GPG-KEY-elasticsearch

.添加yum仓库

[root@linux-node1 ~]# vim /etc/yum.repos.d/es.repo

[elasticsearch-.x]

name=Elasticsearch repository for .x packages

baseurl=https://artifacts.elastic.co/packages/6.x/yum

gpgcheck=

gpgkey=https://artifacts.elastic.co/GPG-KEY-elasticsearch

enabled=

autorefresh=

type=rpm-md

.安装elasticsearch

[root@hadoop-node1 ~]# yum install -y elasticsearch
3、Elasticsearch的集群配置和监控
可以使用命令来查看elasticsearch的状态内容
[root@linux-node1 ~]# curl http://192.168.56.11:9200/_cluster/health?pretty=true

{

  "cluster_name" : "elk-cluster",

  "status" : "green",

  "timed_out" : false,

  "number_of_nodes" : ,

  "number_of_data_nodes" : ,

  "active_primary_shards" : ,

  "active_shards" : ,

  "relocating_shards" : ,

  "initializing_shards" : ,

  "unassigned_shards" : ,

  "delayed_unassigned_shards" : ,

  "number_of_pending_tasks" : ,

  "number_of_in_flight_fetch" : ,

  "task_max_waiting_in_queue_millis" : ,

  "active_shards_percent_as_number" : 100.0

}

[root@linux-node2 ~]# curl http://192.168.56.12:9200/_cluster/health?pretty=true

{

  "cluster_name" : "elk-cluster",

  "status" : "green",

  "timed_out" : false,

  "number_of_nodes" : ,

  "number_of_data_nodes" : ,

  "active_primary_shards" : ,

  "active_shards" : ,

  "relocating_shards" : ,

  "initializing_shards" : ,

  "unassigned_shards" : ,

  "delayed_unassigned_shards" : ,

  "number_of_pending_tasks" : ,

  "number_of_in_flight_fetch" : ,

  "task_max_waiting_in_queue_millis" : ,

  "active_shards_percent_as_number" : 100.0

}

[root@linux-node1 ~]# curl  -i -XGET 'http://192.168.56.11:9200/_count?'   #查看es里面有什么内容

HTTP/1.1  OK

content-type: application/json; charset=UTF-

content-length:

{"count":,"_shards":{"total":,"successful":,"skipped":,"failed":}}

解释:

返回头部200,执行成功0个,返回0个

curl http://192.168.56.11:9200/_cluster/health?pretty 健康检查

curl http://192.168.56.11:9200/_cluster/state?pretty    集群详细信息

注:但是我们不可能经常通过命令来查看集群的信息,这里就使用elasticsearch的插件--head

插件是为了完成不同的功能,而官方提供了一些插件但大部分是收费的,另外也有一些开发爱好者提供的插件。可以实现对elasticsearch集群的状态与管理配置等功能。
4、Elasticsearch插件–>Head插件
插件作用:主要是做集群管理的插件
Github下载地址:https://github.com/mobz/elasticsearch-head
安装Head插件

[root@linux-node1 ~]# wget https://nodejs.org/dist/v8.10.0/node-v8.10.0-linux-x64.tar.xz

[root@linux-node1 ~]# tar xf node-v8.10.0-linux-x64.tar.xz

[root@linux-node1 ~]# mv node-v8.10.0-linux-x64 /usr/local/node

[root@linux-node1 ~]# vim /etc/profile

export NODE_HOME=/usr/local/node

export PATH=$PATH:$NODE_HOME/bin

[root@linux-node1 ~]# source /etc/profile

[root@linux-node1 ~]# which node

/usr/local/node/bin/node

[root@linux-node1 ~]# node -v

v8.10.0

[root@linux-node1 ~]# which npm

/usr/local/node/bin/npm

[root@linux-node1 ~]# npm -v

5.6.

[root@linux-node1 ~]# npm install -g cnpm --registry=https://registry.npm.taobao.org

[root@linux-node1 ~]# npm install -g grunt-cli --registry=https://registry.npm.taobao.org

[root@linux-node1 ~]# grunt -version

grunt-cli v1.2.0

[root@linux-node1 ~]# wget https://github.com/mobz/elasticsearch-head/archive/master.zip

[root@linux-node1 ~]# unzip master.zip

[root@linux-node1 ~]# cd elasticsearch-head-master/

[root@linux-node1 elasticsearch-head-master]# vim Gruntfile.js

                 connect: {

                         server: {

                                 options: {

                                         hostname: '192.168.56.11',

                                         port: ,

                                         base: '.',

                                         keepalive: true

                                 }

                         }

                 }

[root@linux-node1 elasticsearch-head-master]# vim _site/app.js

 this.base_uri = this.config.base_uri || this.prefs.get("app-base_uri") || "http://192.168.56.11:9200";

[root@linux-node1 elasticsearch-head-master]# cnpm install

[root@linux-node1 elasticsearch-head-master]# grunt --version

grunt-cli v1.2.0

grunt v1.0.1

[root@linux-node1 elasticsearch-head-master]# vim /etc/elasticsearch/elasticsearch.yml

 # ---------------------------------- Head -------------------------------------增加如下两行:

 #

 http.cors.enabled: true

 http.cors.allow-origin: "*"

[root@linux-node1 elasticsearch-head-master]# systemctl restart elasticsearch

[root@linux-node1 elasticsearch-head-master]# systemctl status elasticsearch

[root@linux-node1 elasticsearch-head-master]# grunt server &

(node:) ExperimentalWarning: The http2 module is an experimental API.

Running "connect:server" (connect) task

Waiting forever...

Started connect web server on http://192.168.56.11:9100

注:在elasticsearch .x以前的版本可以通过/usr/share/elasticsearch/bin/plugin install mobz/elasticsearch-head来安装head插件,在elasticsearch .x以上版本需要通过npm进行安装。

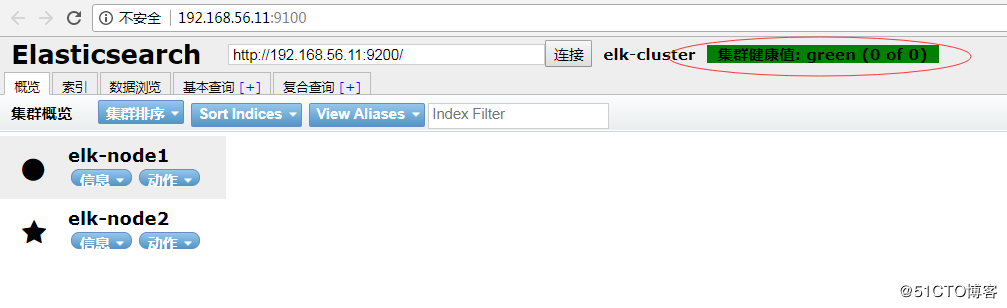
浏览器访问:http://192.168.56.11:9100,可以看到各个节点的状态信息,如图:
三、logstash的安装
1、logstash介绍
Logstash是一个开源的数据收集引擎,可以水平伸缩,而且logstash是整个ELK当中拥有最多插件的一个组件,其可以接收来自不同源的数据并统一输入到指定的且可以是不同目的地。
logstash收集日志基本流程: input–>codec–>filter–>codec–>output
1.input:从哪里收集日志。
2.filter:发出去前进行过滤
3.output:输出至Elasticsearch或Redis消息队列
4.codec:输出至前台,方便边实践边测试
5.数据量不大日志按照月来进行收集
2、安装logstash
环境准备:关闭防火墙和Selinux,并且安装java环境

logstash下载地址:https://artifacts.elastic.co/downloads/logstash/logstash-6.0.0.rpm

[root@linux-node1 ~]# wget https://artifacts.elastic.co/downloads/logstash/logstash-6.0.0.rpm

[root@linux-node1 ~]# yum install -y logstash-6.0..rpm

[root@linux-node1 ~]# rpm -ql logstash

[root@linux-node1 ~]# chown -R logstash.logstash chown -R logstash.logstash /usr/share/logstash/data/queue

#权限更改为logstash用户和组,否则启动的时候日志报错

#node2节点安装logstash

[root@linux-node2 ~]# yum install -y logstash-6.0..rpm

[root@linux-node1 ~]# ll /etc/logstash/conf.d/     #logstash的主配置目录

总用量
3、测试logstash是否正常
3.1、logstash的基本语法
input {

        指定输入

}

output {

        指定输出

}
3.2、测试标准输入输出
使用rubydebug方式前台输出展示以及测试
#标准输入输出

[root@linux-node1 ~]# /usr/share/logstash/bin/logstash -e 'input { stdin {} } output { stdout { codec => rubydebug} }'

OpenJDK -Bit Server VM warning: If the number of processors is expected to increase from one, then you should configure the number of parallel GC threads appropriately using -XX:ParallelGCThreads=N

WARNING: Could not find logstash.yml which is typically located in $LS_HOME/config or /etc/logstash. You can specify the path using --path.settings. Continuing using the defaults

Could not find log4j2 configuration at path /usr/share/logstash/config/log4j2.properties. Using default config which logs errors to the console

The stdin plugin is now waiting for input:

hello  #输入

{

      "@version" => "",              #@version时间版本号,一个事件就是一个ruby对象

          "host" => "linux-node1",       #host标记事件发生在哪里

    "@timestamp" => --08T14::.395Z,      #@timestamp,用来标记当前事件发生的时间

       "message" => "hello"       #消息的具体内容

}
3.3、测试输出到文件
[root@linux-node1 ~]# /usr/share/logstash/bin/logstash -e 'input { stdin{} } output { file { path => "/tmp/test-%{+YYYY.MM.dd}.log"} }'

OpenJDK -Bit Server VM warning: If the number of processors is expected to increase from one, then you should configure the number of parallel GC threads appropriately using -XX:ParallelGCThreads=N

WARNING: Could not find logstash.yml which is typically located in $LS_HOME/config or /etc/logstash. You can specify the path using --path.settings. Continuing using the defaults

Could not find log4j2 configuration at path /usr/share/logstash/config/log4j2.properties. Using default config which logs errors to the console

The stdin plugin is now waiting for input:

hello world

welcome to beijing!

[root@linux-node1 ~]# tailf /tmp/test-2018.03..log

{"@version":"","host":"linux-node1","@timestamp":"2018-03-14T07:57:27.096Z","message":"hello world"}

{"@version":"","host":"linux-node1","@timestamp":"2018-03-14T07:58:29.074Z","message":"welcome to beijing!"}

开启gzip压缩输出

[root@linux-node1 ~]# /usr/share/logstash/bin/logstash -e 'input { stdin {} } outpu{ file { path => "/tmp/test-%{+YYYY.MM.dd}.log.tar.gz" gzip => true } }'

OpenJDK -Bit Server VM warning: If the number of processors is expected to increase from one, then you should configure the number of parallel GC threads appropriately using -XX:ParallelGCThreads=N

what's your name?

[root@linux-node1 ~]# ll /tmp/test-2018.03..log.tar.gz

-rw-r--r--  root root  3月   : /tmp/test-2018.03..log.tar.gz
3.4、测试输出到elasticsearch
[root@linux-node1 ~]# /usr/share/logstash/bin/logstash -e 'input { stdin {} } output { elasticsearch { hosts => ["192.168.56.110:9200"] index => "logstash-test-%{+YYYY.MM.dd}" } }'

OpenJDK -Bit Server VM warning: If the number of processors is expected to increase from one, then you should configure the number of parallel GC threads appropriately using -XX:ParallelGCThreads=N

WARNING: Could not find logstash.yml which is typically located in $LS_HOME/config or /etc/logstash. You can specify the path using --path.settings. Continuing using the defaults

Could not find log4j2 configuration at path /usr/share/logstash/config/log4j2.properties. Using default config which logs errors to the console

The stdin plugin is now waiting for input:

what's your name ?

my name is kim.

验证elasticsearch服务器收到数据

[root@linux-node1 ~]# ll /data/elkdata/nodes//indices/

总用量

drwxr-xr-x  elasticsearch elasticsearch  3月   : cV8nUO0WSkmR990aBH0RiA

drwxr-xr-x  elasticsearch elasticsearch  3月   : Rca-tNpDSt20jWxEheyIrQ
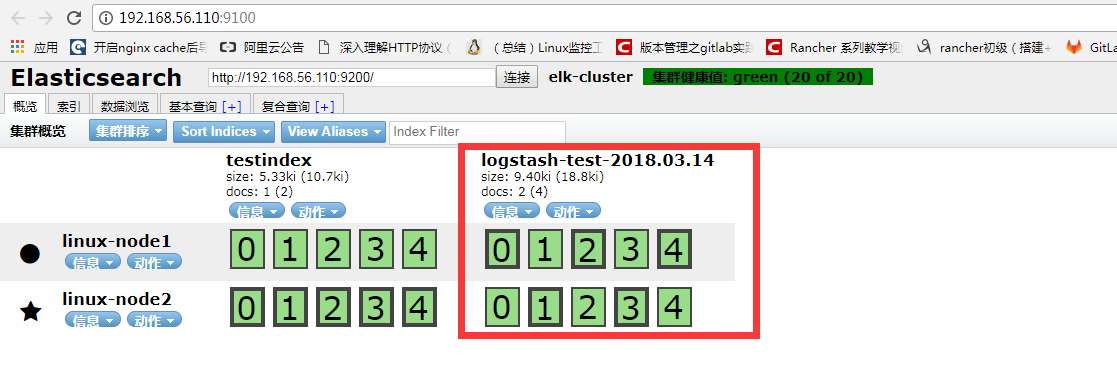

从head插件上可以看到有索引:logstash-test-2018-03-04,并且通过数据浏览可以看到刚才输入的数据。
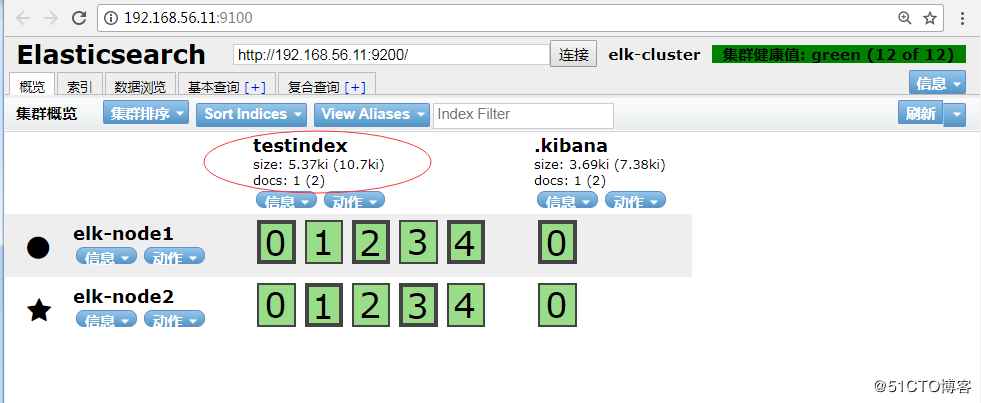
★★★★★
在该界面删除testindex,”动作”–>”删除”,再查看上面目录.
tips:在删除数据时,在该界面删除,切勿在上面的目录删除,因为集群节点上每个都有这样的数据,删除某一个,可能会导致elasticsearch无法启动。
四、Kibana安装
Kibana 是为 Elasticsearch 设计的开源分析和可视化平台。你可以使用 Kibana 来搜索,查看存储在 Elasticsearch 索引中的数据并与之交互。你可以很容易实现高级的数据分析和可视化,以图表的形式展现出来。
kiabana下载地址:https://artifacts.elastic.co/downloads/kibana/kibana-6.0.0-x86_64.rpm

[root@linux-node1 ~]# wget https://artifacts.elastic.co/downloads/kibana/kibana-6.0.0-x86_64.rpm

[root@linux-node1 ~]# yum install -y kibana-6.0.-x86_64.rpm

[root@linux-node1 ~]# vim /etc/kibana/kibana.yml

[root@linux-node1 ~]# grep "^[a-Z]" /etc/kibana/kibana.yml

server.port:         #监听端口

server.host: "192.168.56.11"      #监听IP地址,建议内网ip

elasticsearch.url: "http://192.168.56.11:9200"       #elasticsearch连接kibana的URL,也可以填写192.168.56.,因为它们是一个集群

[root@linux-node1 ~]# systemctl enable kibana

Created symlink from /etc/systemd/system/multi-user.target.wants/kibana.service to /etc/systemd/system/kibana.service.

[root@linux-node1 ~]# systemctl start kibana

监听端口为:

[root@linux-node1 ~]# ss -tnl

State       Recv-Q Send-Q                                                 Local Address:Port                                                                Peer Address:Port

LISTEN                                                                            *:                                                                           *:*

LISTEN                                                                            *:                                                                             *:*

LISTEN                                                                    127.0.0.1:                                                                             *:*

LISTEN                                                                192.168.56.11:                                                                           *:*

LISTEN                                                         ::ffff:192.168.56.11:                                                                          :::*

LISTEN                                                         ::ffff:192.168.56.11:                                                                          :::*

LISTEN                                                                           :::                                                                            :::*

LISTEN                                                                          :::                                                                            :::*

LISTEN                                                                            :::                                                                          :::*
浏览器访问192.168.56.11:5601,如图:
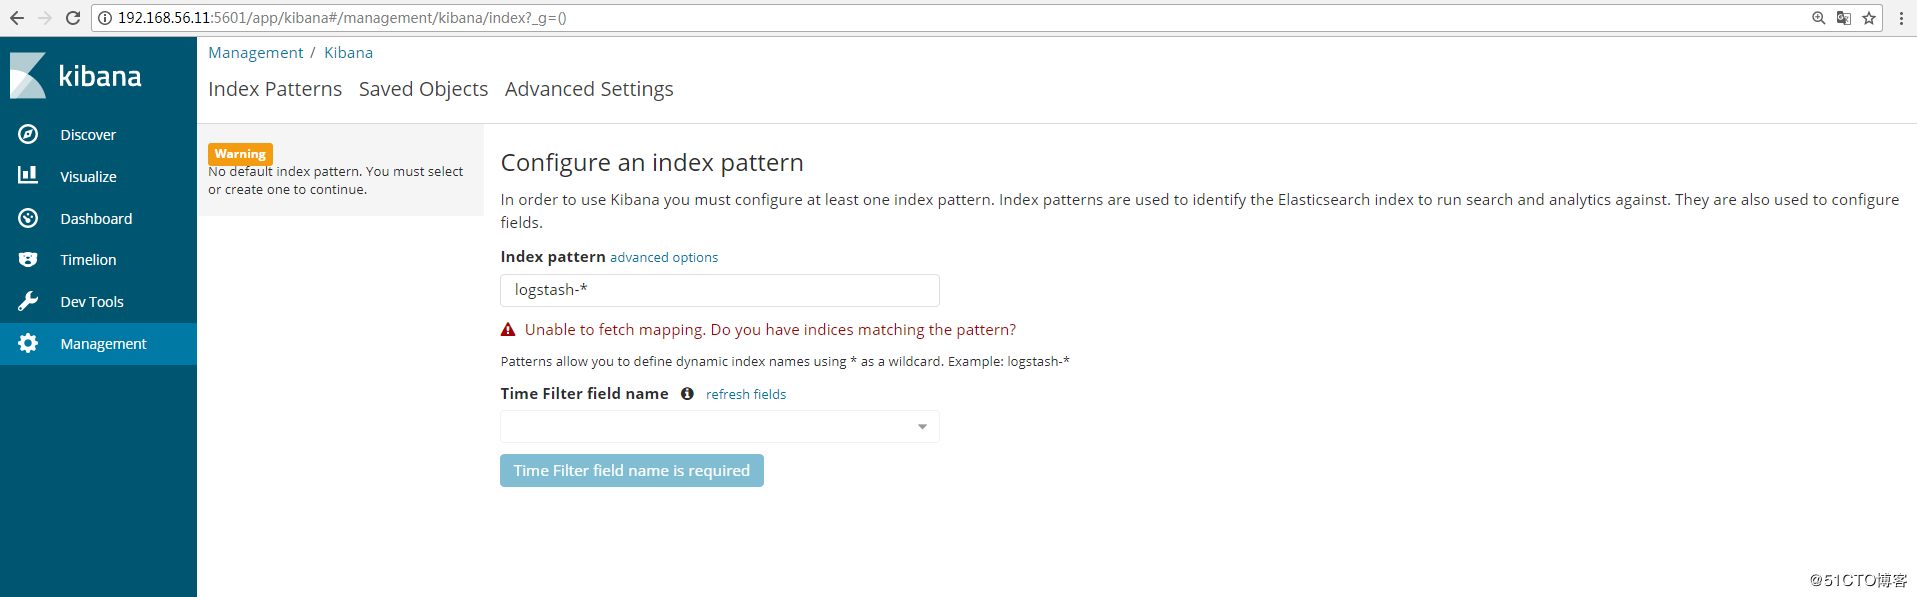
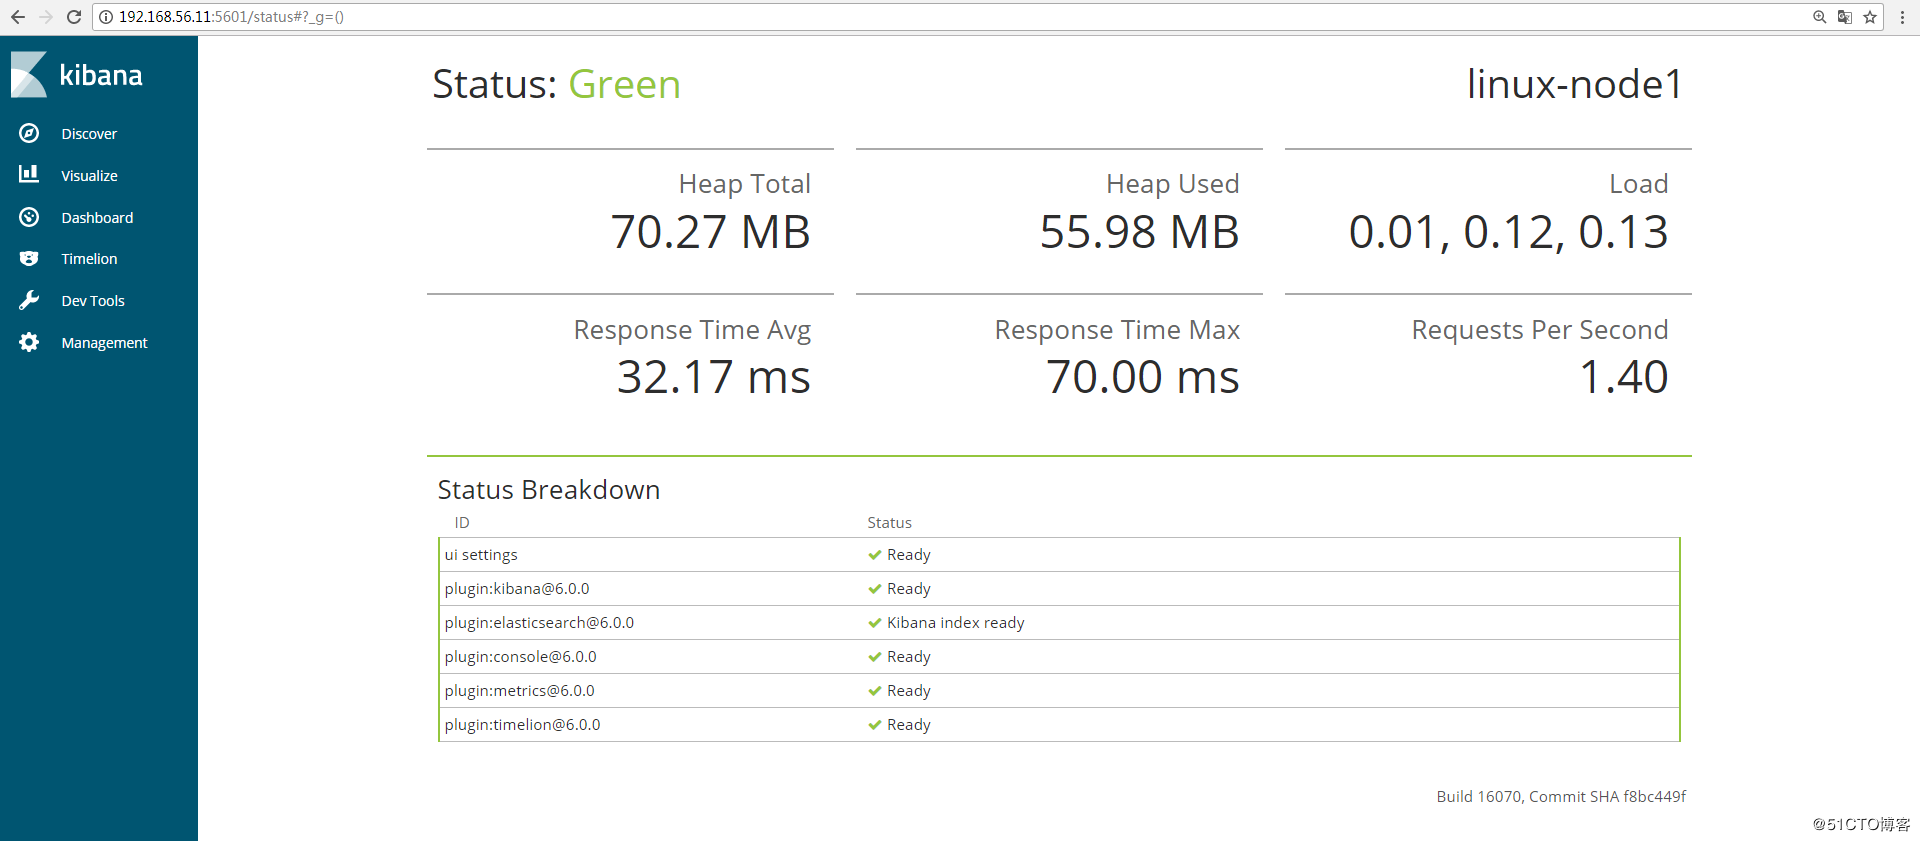
可以通过http://192.168.56.11:5601/status 来查看看是否正常,如果不正常,是无法进入到上图界面
五、通过配置logstash文件收集message日志
1、Kibana展示上一节的日志
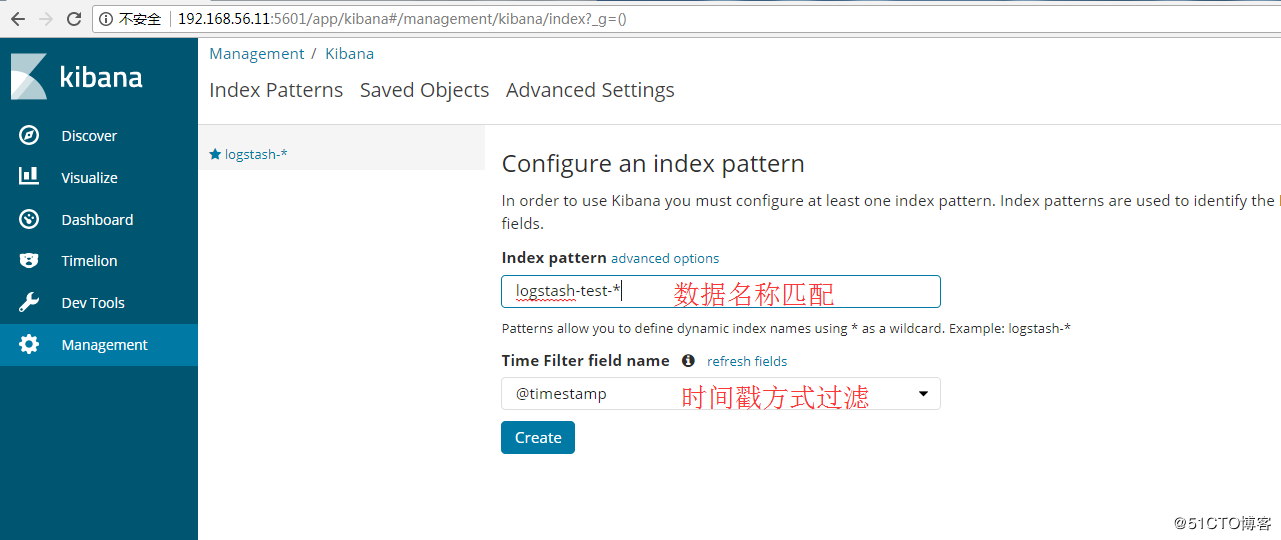
在Kibana上展示上一节收集的日志信息,添加索引,如图:
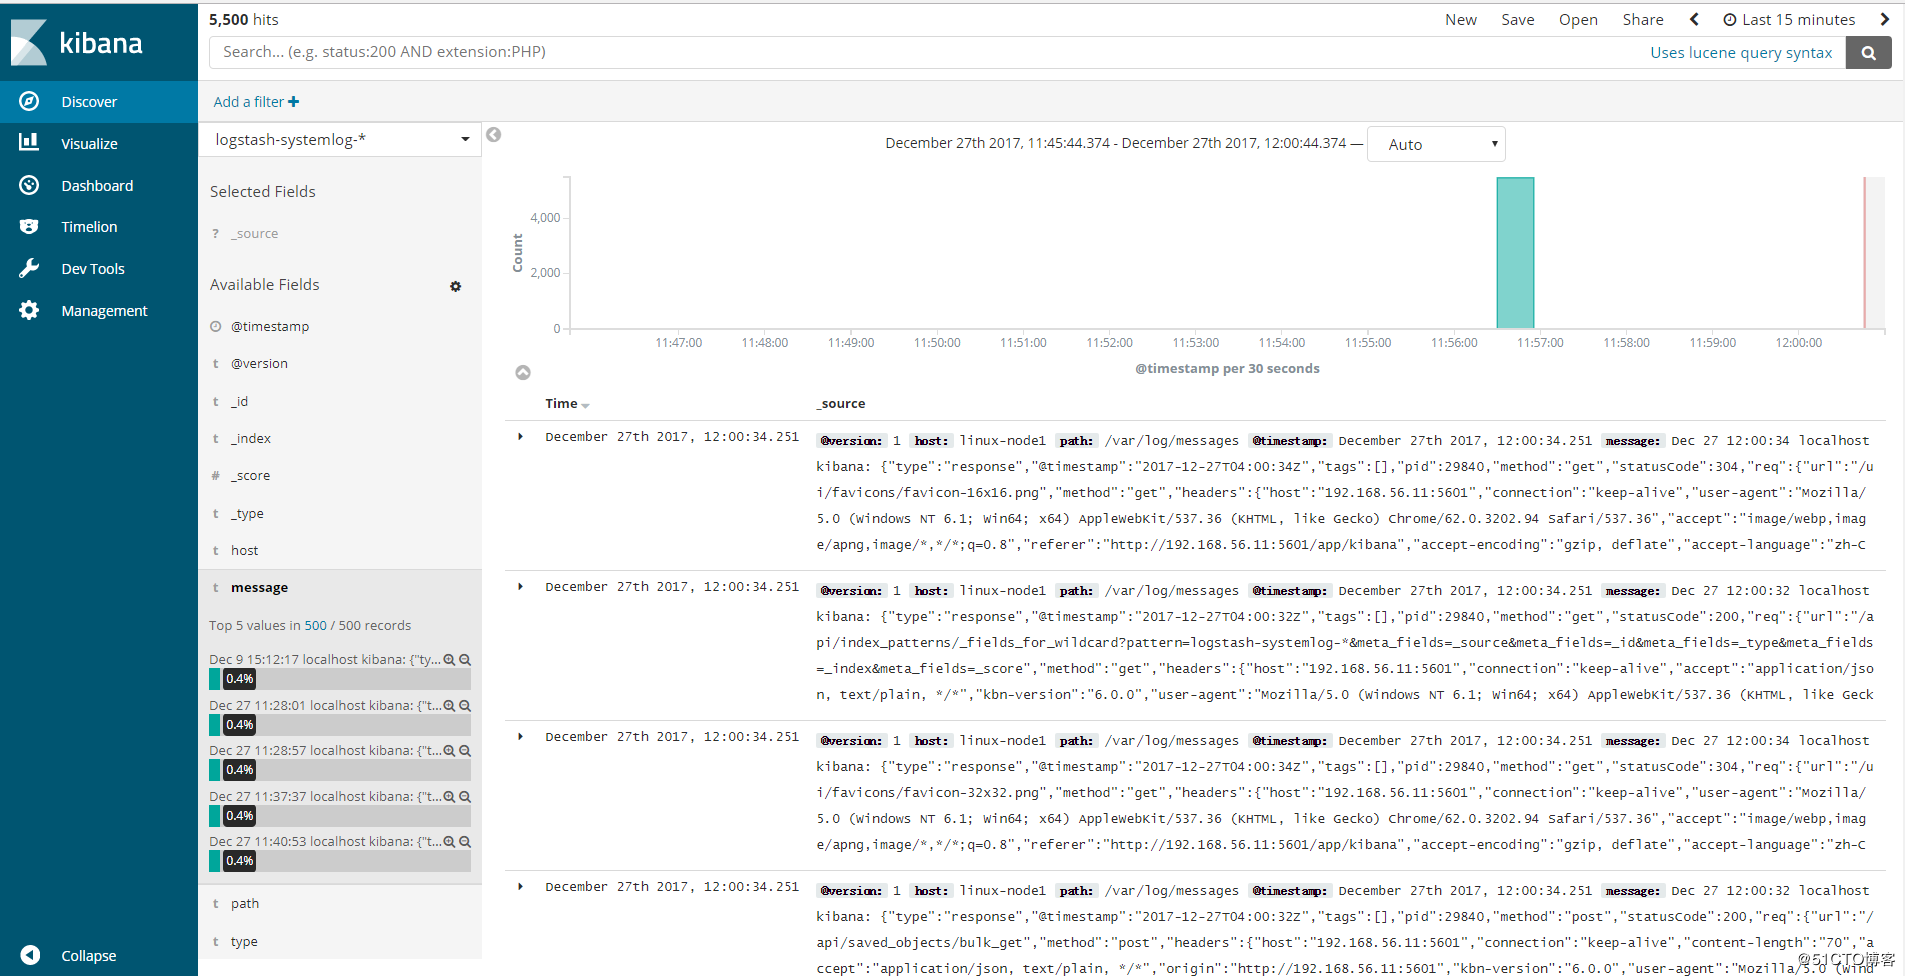
点击“discover”查看收集的信息,如图:

2、使用logstash配置文件收集messages日志
前提需要logstash用户对被收集的日志文件有读的权限并对写入的文件有写权限。
编辑logstash的配置文件:

[root@linux-node1 ~]# vim /etc/logstash/conf.d/system.conf

input {

  file {

    path => "/var/log/messages"     #日志路径

    type => "systemlog"      #类型,自定义,在进行多个日志收集存储时可以通过该项进行判断输出

    start_position => "beginning"    #logstash 从什么位置开始读取文件数据,默认是结束位置(end),也就是说 logstash 进程会以类似 tail -F 的形式运行。如果你是要导入原有数据,把这个设定改成"beginning",logstash 进程就从头开始读取,类似 less +F 的形式运行。

    stat_interval => ""  #logstash 每隔多久检查一次被监听文件状态(是否有更新) ,默认是  秒。

  }

}

output {

  elasticsearch {

    hosts => ["192.168.56.11:9200"]      #指定hosts

    index => "logstash-systemlog-%{+YYYY.MM.dd}"    #索引名称

  }

}

[root@linux-node1 ~]# /usr/share/logstash/bin/logstash -f /etc/logstash/conf.d/system.conf -t     #检测配置文件是否有语法错误

OpenJDK -Bit Server VM warning: If the number of processors is expected to increase from one, then you should configure the number of parallel GC threads appropriately using -XX:ParallelGCThreads=N

WARNING: Could not find logstash.yml which is typically located in $LS_HOME/config or /etc/logstash. You can specify the path using --path.settings. Continuing using the defaults

Could not find log4j2 configuration at path /usr/share/logstash/config/log4j2.properties. Using default config which logs errors to the console

Configuration OK

[root@linux-node1 ~]# ll /var/log/messages

-rw-------.  root root  12月  : /var/log/messages

#这里可以看到该日志文件是600权限,而elasticsearch是运行在elasticsearch用户下,这样elasticsearch是无法收集日志的。所以这里需要更改日志的权限,否则会报权限拒绝的错误。在日志中查看/var/log/logstash/logstash-plain.log 是否有错误。

[root@linux-node1 ~]# chmod  /var/log/messages

[root@linux-node1 ~]# systemctl restart logstash
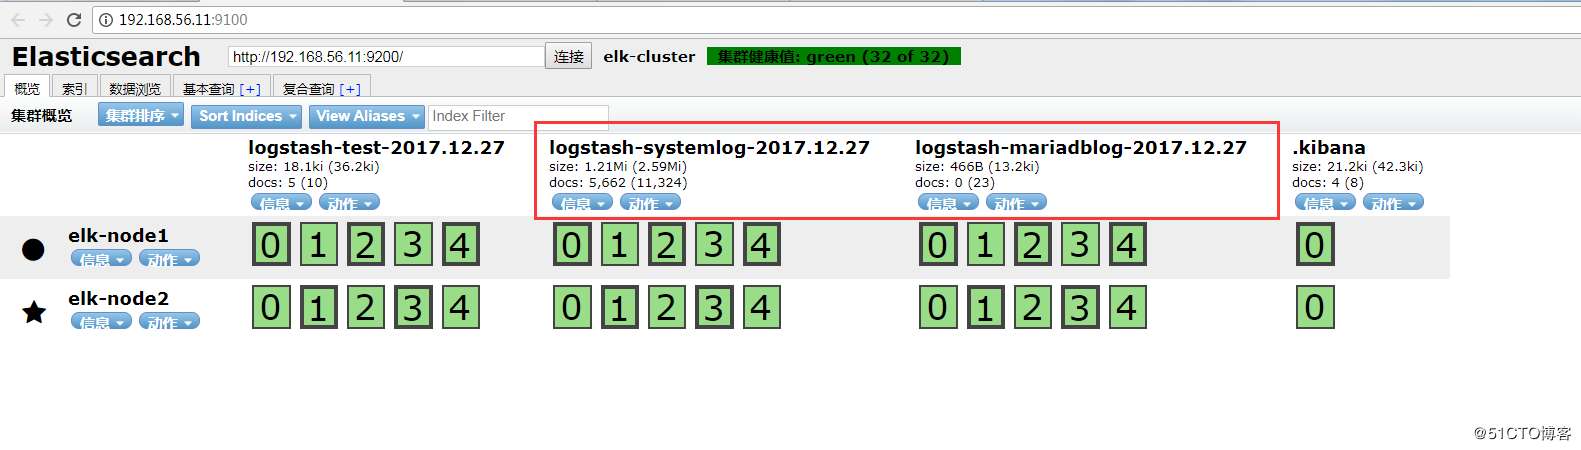
在管理界面查看是否有相应的索引(logstash-systemlog-2017.12.27),如图:

添加到Kibana中展示,创建索引:
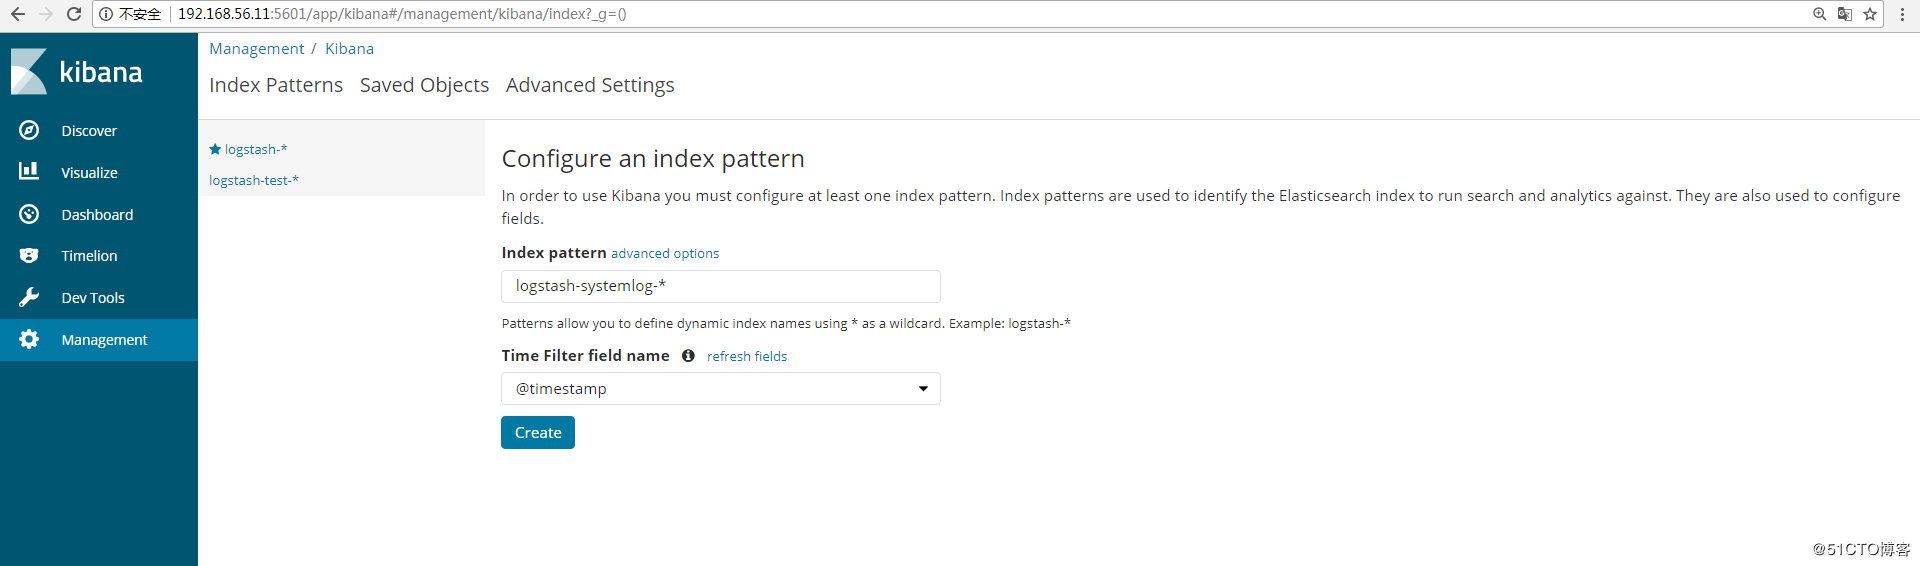
查看日志
3、使用一个配置文件收集多个日志
修改logstash的配置文件,这里增加收集数据库mariadb的日志:

[root@linux-node1 ~]# vim /etc/logstash/conf.d/system.conf

input {

  file {

        path => "/var/log/messages"

        type => "systemlog"

        start_position => "beginning"

        stat_interval => ""

  }

  file {

        path => "/var/log/mariadb/mariadb.log"

        type => "mariadblog"

        start_position => "beginning"

        stat_interval => ""

  }

}

output {

  if [type] == "systemlog" {       #使用if来判断类型,并输出到elasticsearch和file,展示一个out可以作多样输出

  elasticsearch {

        hosts => ["192.168.56.11:9200"]

        index => "logstash-systemlog-%{+YYYY.MM.dd}"

  }

  file {

        path => "/tmp/logstash-systemlog-%{+YYYY.MM.dd}"

  }}

  if [type] == "mariadblog" {

  elasticsearch {

        hosts => ["192.168.56.11:9200"]

        index => "logstash-mariadblog-%{+YYYY.MM.dd}"

  }

  file {

        path => "/tmp/logstash-mariadblog-%{+YYYY.MM.dd}"

  }}

}

配置文件检测语法是否正常:

[root@linux-node1 ~]# /usr/share/logstash/bin/logstash -f /etc/logstash/conf.d/system.conf -t

OpenJDK -Bit Server VM warning: If the number of processors is expected to increase from one, then you should configure the number of parallel GC threads appropriately using -XX:ParallelGCThreads=N

WARNING: Could not find logstash.yml which is typically located in $LS_HOME/config or /etc/logstash. You can specify the path using --path.settings. Continuing using the defaults

Could not find log4j2 configuration at path /usr/share/logstash/config/log4j2.properties. Using default config which logs errors to the console

Configuration OK

重启logstash:

[root@linux-node1 ~]# systemctl restart logstash

修改mariadb的日志权限:

[root@linux-node1 ~]# ll /var/log/mariadb/ -d

drwxr-x---  mysql mysql  12月   : /var/log/mariadb/

[root@linux-node1 ~]# chmod  /var/log/mariadb/

[root@linux-node1 ~]# ll /var/log/mariadb/mariadb.log

-rw-r-----  mysql mysql  12月  : /var/log/mariadb/mariadb.log

[root@linux-node1 ~]# chmod  /var/log/mariadb/mariadb.log
通过head插件查看:
查看是否在/tmp下收集到了日志数据
[root@linux-node1 ~]# ll /tmp/logstash-*

-rw-r--r--  logstash logstash  12月  : /tmp/logstash-mariadblog-2017.12.

-rw-r--r--  logstash logstash   12月  : /tmp/logstash-systemlog-2017.12.
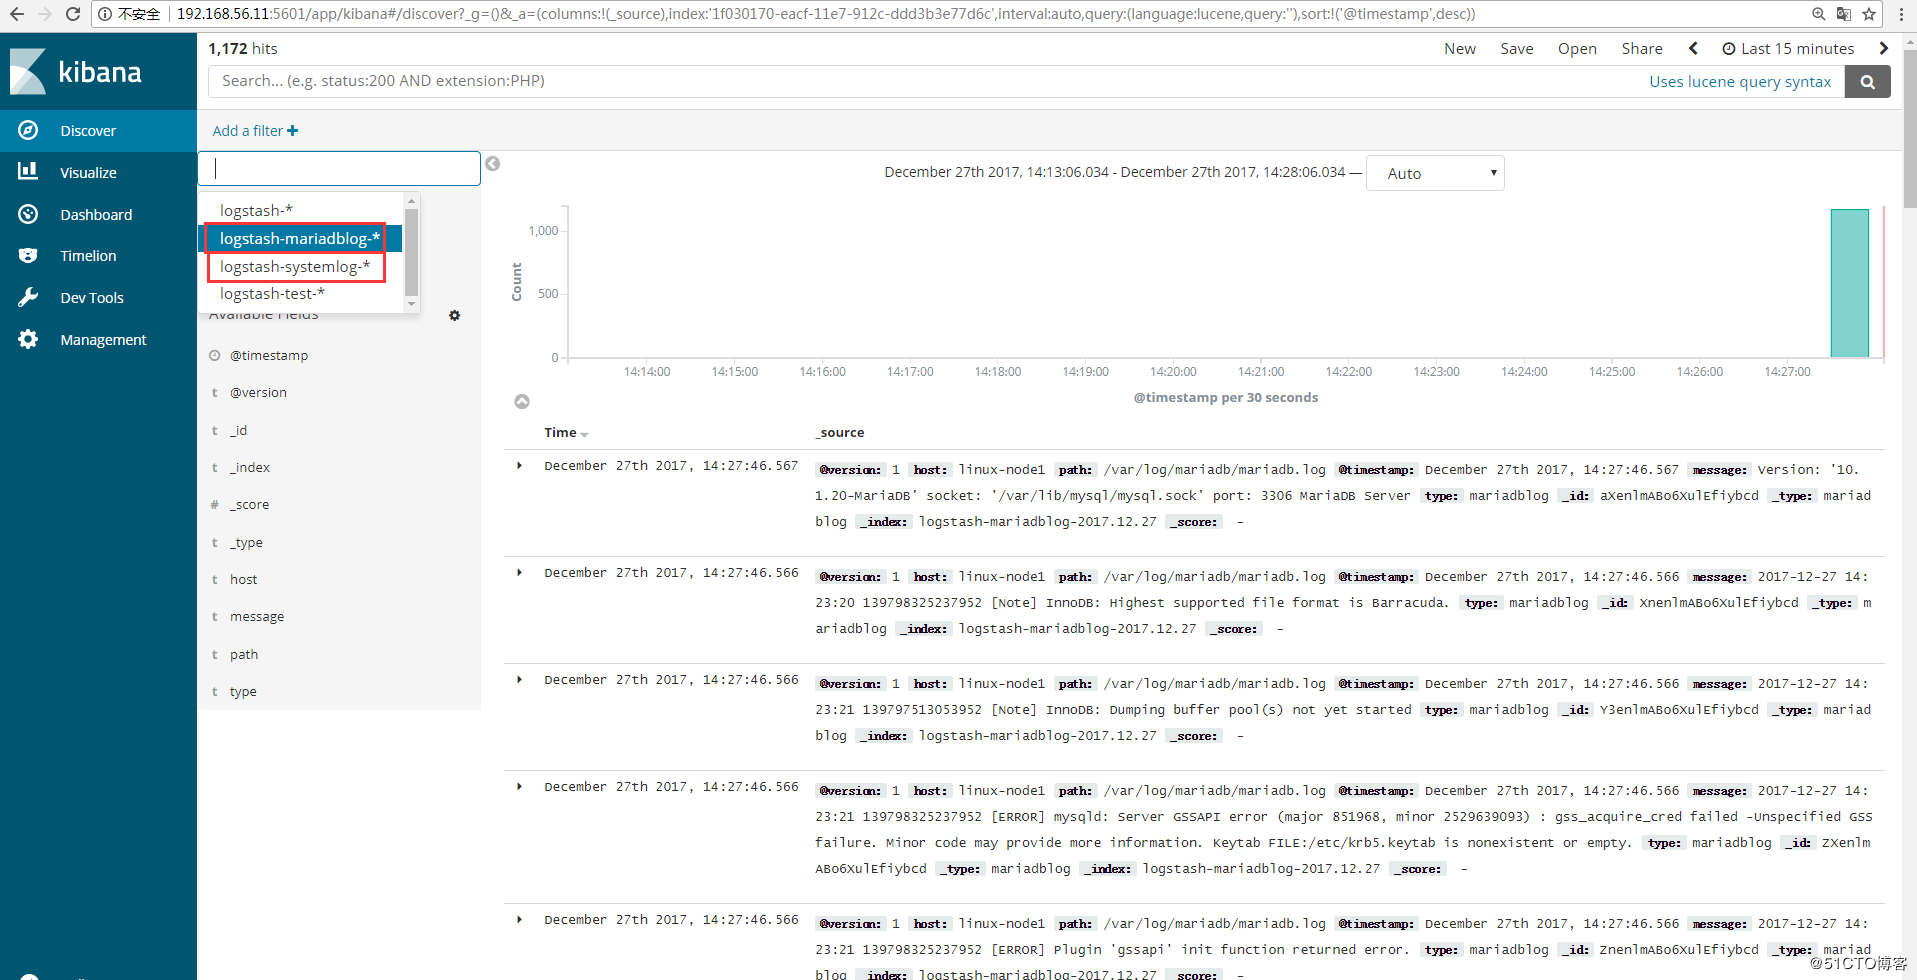
Kibana创建索引:
ELKStack入门篇(一)之ELK部署和使用的更多相关文章
- ELKStack入门篇(五)之实用架构解析
(1)用户通过nginx或haproxy访问ELK日志统计平台,IP地址为keepalived的vip地址. (2)nginx将请求转发到kibana (3)kibana到elasticsearch获 ...
- ELKStack入门篇(三)之logstash收集日志写入redis
1.部署Redis 1.1.下载redis [root@linux-node2 ~]# wget http://download.redis.io/releases/redis-4.0.6.tar.g ...
- ELKStack入门篇(二)之Nginx、Tomcat、Java日志收集以及TCP收集日志使用
1.收集Nginx的json格式日志 1.1.Nginx安装 [root@linux-node1 ~]# yum install nginx -y [root@linux-node1 ~]# vim ...
- ELKStack入门篇(四)之Filebeat
Filebeat是轻量级单用途的日志收集工具,用于在没有安装java的服务器上专门收集日志,可以将日志转发到logstash.elasticsearch或redis等场景中进行下一步处理. 官方文档: ...
- ELK快速入门(一)基本部署
ELK快速入门一-基本部署 ELK简介 什么是ELK?通俗来讲,ELK是由Elasticsearch.Logstash.Kibana 三个开源软件组成的一个组合体,这三个软件当中,每个软件用于完成不同 ...
- 如何在Visual Studio 2017中使用C# 7+语法 构建NetCore应用框架之实战篇(二):BitAdminCore框架定位及架构 构建NetCore应用框架之实战篇系列 构建NetCore应用框架之实战篇(一):什么是框架,如何设计一个框架 NetCore入门篇:(十二)在IIS中部署Net Core程序
如何在Visual Studio 2017中使用C# 7+语法 前言 之前不知看过哪位前辈的博文有点印象C# 7控制台开始支持执行异步方法,然后闲来无事,搞着,搞着没搞出来,然后就写了这篇博文,不 ...
- spring boot(一):入门篇
构建微服务:Spring boot 入门篇 什么是spring boot Spring Boot是由Pivotal团队提供的全新框架,其设计目的是用来简化新Spring应用的初始搭建以及开发过程.该框 ...
- 转:OSGi 入门篇:生命周期层
OSGi 入门篇:生命周期层 前言 生命周期层在OSGi框架中属于模块层上面的一层,它的运作是建立在模块层的功能之上的.生命周期层一个主要的功能就是让你能够从外部管理应用或者建立能够自我管理的应用(或 ...
- Maven入门示例(3):自动部署至外部Tomcat
Maven入门示例(3):自动部署至外部Tomcat 博客分类: maven 2012原创 Maven入门示例(3):自动部署至外部Tomcat 上一篇,介绍了如何创建Maven项目以及如何在内 ...
随机推荐
- PaaS平台– Google App Engine的开源实现AppScale环境搭建
搭建好开发环境介绍: 硬件平台:HP Z800 工作站 内存:24GB 硬盘:1TB 虚拟化环境:XenServer 6.2.0 VM1:Ubuntu 12.04 amd64 server ...
- DateConvertUtil 日期工具类
package com.hxqc.basic.dependency.util; import java.text.DateFormat; import java.text.ParseException ...
- BZOJ1334:[Baltic2008]Elect(背包DP)
Description N个政党要组成一个联合内阁,每个党都有自己的席位数. 现在希望你找出一种方案,你选中的党的席位数要大于总数的一半,并且联合内阁的席位数越多越好. 对于一个联合内阁,如果某个政党 ...
- POJ3690 Constellations
嘟嘟嘟 哈希 刚开始我一直在想二维哈希,但发现如果还是按行列枚举的话会破坏子矩阵的性质.也就是说,这个哈希只能维护一维的子区间的哈希值. 所以我就开了个二维数组\(has_{i, j}\)表示原矩阵\ ...
- PHP-----TP框架----命名空间
TP框架----命名空间 命名空间,起什么作用??? [1]命名空间是一个虚拟的目录,这个文件有可能存在这个电脑里的任何一个地方,但是如果要把这个文件它的命名空间全部写成同一个那么这些文件就相当于在同 ...
- Hadoop学习之路(二十一)MapReduce实现Reduce Join(多个文件联合查询)
MapReduce Join 对两份数据data1和data2进行关键词连接是一个很通用的问题,如果数据量比较小,可以在内存中完成连接. 如果数据量比较大,在内存进行连接操会发生OOM.mapredu ...
- 【node.js】Buffer(缓冲区)
Node.js中,定义了一个 Buffer 类,该类用来创建一个专门存放二进制数据的缓存区. 创建 Buffer 类 Node Buffer 类可以通过多种方式来创建. 1.创建长度为 10 字节的 ...
- 【CSS-flex】圣杯布局(Holy Grail Layout)、输入框的布局、悬挂式布局、固定的底栏
1.圣杯布局(Holy Grail Layout) 其指的是一种最常见的网站布局.页面从上到下,分成三个部分:头部(header),躯干(body),尾部(footer).其中躯干又水平分成三栏,从左 ...
- SpringBoot实战(十三)之缓存
什么是缓存? 引用下百度百科的解释: 缓存就是数据交换的缓冲区(又称作Cache),当某一硬件要读取数据时,会首先从缓存中查找需要的数据,找到了则直接执行,找不到的话则从内存中查找.由于缓存的运行速度 ...
- XCODE7 和IOS9适配后的一些问题
网上比较常规的几个问题就不细说了. 什么HTTPS.bitcode.什么什么的. 记录几个自己又遇到了但是网上没有说的. 启动应用报错, *** Terminating app due to unca ...