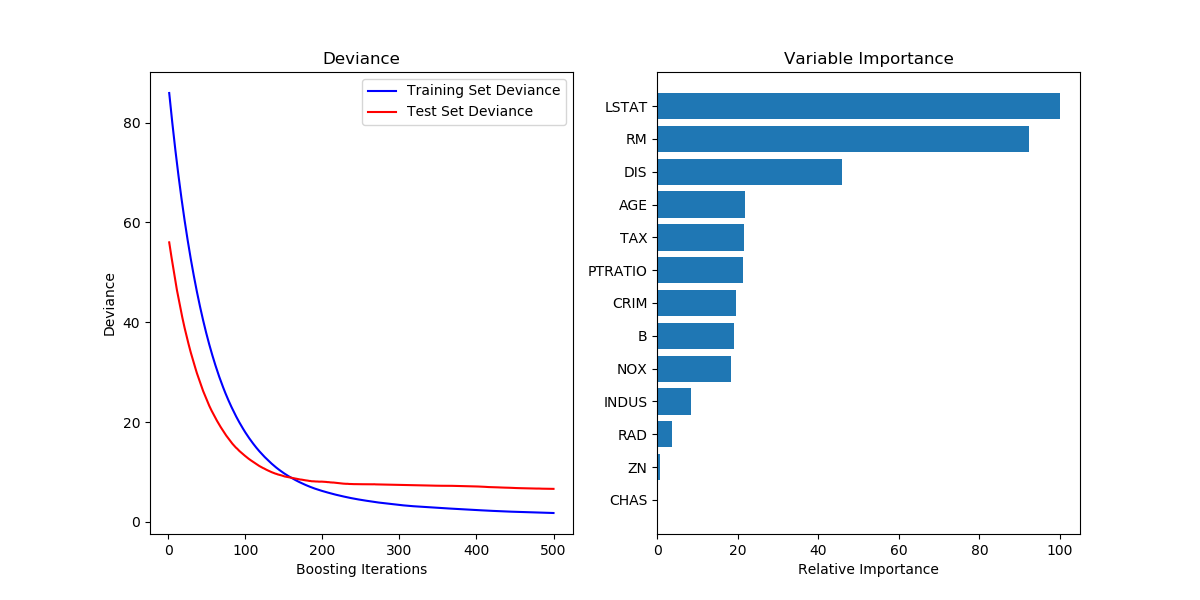
sklearn 可视化模型的训练测试收敛情况和特征重要性
show the code:
# Plot training deviance

def plot_training_deviance(clf, n_estimators, X_test, y_test):

    # compute test set deviance

    test_score = np.zeros((n_estimators,), dtype=np.float64)

    for i, y_pred in enumerate(clf.staged_predict(X_test)):

        test_score[i] = clf.loss_(y_test, y_pred)

    plt.figure(figsize=(12, 6))

    plt.subplot(1, 2, 1)

    plt.title('Deviance')

    train_score = clf.train_score_

    logging.info("len(train_score): %s" % len(train_score))

    logging.info(train_score)

    logging.info("len(test_score): %s" % len(test_score))

    logging.info(test_score)

    plt.plot(np.arange(n_estimators) + 1, train_score, 'b-',

             label='Training Set Deviance')

    plt.plot(np.arange(n_estimators) + 1, test_score, 'r*', label='Test Set Deviance')

    plt.legend(loc='upper right')

    plt.xlabel('Boosting Iterations')

    plt.ylabel('Deviance')

    plt.show()

# Plot feature importance

def plot_feature_importance(clf, feature_names):

    feature_importance = clf.feature_importances_

    # make importances relative to max importance

    feature_importance = 100.0 * (feature_importance / feature_importance.max())

    sorted_idx = np.argsort(feature_importance)

    pos = np.arange(sorted_idx.shape[0]) + .5

    plt.subplot(1, 2, 2)

    plt.barh(pos, feature_importance[sorted_idx], align='center')

    # plt.yticks(pos, feature_names[sorted_idx])

    plt.yticks(pos, [feature_names[idx] for idx in sorted_idx])

    plt.xlabel('Relative Importance')

    plt.title('Variable Importance')

    plt.show()

class Train(object):

    def __init__(self, data_file):

        self.data_file = data_file

        self.x_fields = ["xxx", "xxx", "xxx"]

        self.x_features, self.y_labels = self.load_data()

    def load_data(self):

        x_features, y_labels = [], []

        # ......

        return x_features, y_labels

    def train_model(self):

        model = GradientBoostingRegressor(random_state=42)

        model.fit(self.x_features, self.y_labels)

        y_pred = model.predict(self.x_features)

        logging.info("mean_squared_error: %.6f" % mean_squared_error(self.y_labels, y_pred))

        logging.info("mean_squared_log_error: %.6f" % mean_squared_log_error(self.y_labels, y_pred))

        plot_training_deviance(clf=model, n_estimators=model.get_params()["n_estimators"], X_test=self.x_features, y_test=self.y_labels)

        # 输出feature重要性

        logging.info("feature_importances_: %s" % model.feature_importances_)

        plot_feature_importance(clf=model, feature_names=self.x_fields)
参考的是sklearn中的样例: Gradient Boosting regression — scikit-learn 0.19.2 documentation
画出的图如下所示:
sklearn 可视化模型的训练测试收敛情况和特征重要性的更多相关文章
- 【集成学习】sklearn中xgboost模块中plot_importance函数(绘图--特征重要性)
直接上代码,简单 # -*- coding: utf-8 -*- """ ################################################ ...
- 使用 TensorBoard 可视化模型、数据和训练
使用 TensorBoard 可视化模型.数据和训练 在 60 Minutes Blitz 中,我们展示了如何加载数据,并把数据送到我们继承 nn.Module 类的模型,在训练数据上训练模型,并在测 ...
- sklearn——train_test_split 随机划分训练集和测试集
sklearn——train_test_split 随机划分训练集和测试集 sklearn.model_selection.train_test_split随机划分训练集和测试集 官网文档:http: ...
- 机器学习使用sklearn进行模型训练、预测和评价
cross_val_score(model_name, x_samples, y_labels, cv=k) 作用:验证某个模型在某个训练集上的稳定性,输出k个预测精度. K折交叉验证(k-fold) ...
- pytorch seq2seq模型训练测试
num_sequence.py """ 数字序列化方法 """ class NumSequence: """ ...
- 学习笔记TF016:CNN实现、数据集、TFRecord、加载图像、模型、训练、调试
AlexNet(Alex Krizhevsky,ILSVRC2012冠军)适合做图像分类.层自左向右.自上向下读取,关联层分为一组,高度.宽度减小,深度增加.深度增加减少网络计算量. 训练模型数据集 ...
- Python 3 利用 Dlib 19.7 和 sklearn机器学习模型 实现人脸微笑检测
0.引言 利用机器学习的方法训练微笑检测模型,给一张人脸照片,判断是否微笑: 使用的数据集中69张没笑脸,65张有笑脸,训练结果识别精度在95%附近: 效果: 图1 示例效果 工程利用pytho ...
- sklearn保存模型的两种方式
sklearn 中模型保存的两种方法 一. sklearn中提供了高效的模型持久化模块joblib,将模型保存至硬盘. from sklearn.externals import joblib # ...
- sklearn保存模型-【老鱼学sklearn】
训练好了一个Model 以后总需要保存和再次预测, 所以保存和读取我们的sklearn model也是同样重要的一步. 比如,我们根据房源样本数据训练了一下房价模型,当用户输入自己的房子后,我们就需要 ...
随机推荐
- mysql删除匿名用户
首先使用命令进入数据库 [root@localhost raul]# mysql -u root -p Enter password: Welcome to the MySQL monitor. Co ...
- 后台管理系统-使用AdminLTE搭建前端
返回总目录<ABP项目实战-后台管理系统-目录> 安装AdminLte 我们通过Nuget包管理器安装AdminLte 引用三方组件 因为AdminLte使用到了很多三方的组件,所以我们需 ...
- win7 +v Ubuntu 16.04 grub rescue 模式下修复 grub
前几天整理了下电脑的分区,合并并删除一些分区,结果导致 grub 被破坏了,Ubuntu进不去了,启动后直接进入了 rescure 模式.后来又折腾了下,终于修复好了,现总结一下. 先说一下我的系统环 ...
- 初识CGI
CGI Web 服务器只能生成静态内容,而用户请求动态内容时,Web服务器只能借助一些应用程序来实现.CGI时一套标准,它规定了Web服务器和应用程序之间的交互方式. 静态内容与动态内容 要想理解什么 ...
- 隐藏Apche、Nginx、PHP的版本号提高网站安全性
隐藏Apache版本号 在apache配置文件httpd.conf中,加入以下代码 ServerTokens Prod ServerSignature Off 隐藏Nginx版本号 在nginx的配置 ...
- P1174 打砖块
P1174 打砖块 普通分组背包:50pts 题解说的啥????(大雾) 看了半天 $s[0/1][i][j]$表示第$i$列用$j$发子弹,最后一发是1/否0打在该列上的价值 $f[0/1][i][ ...
- CSS3:{*zoom:1;}作用
CSS3:{*zoom:1;}作用 zoom:1的常见作用: zoom是IE专用属性,firefox等是不支持的.它的本来作用是设置或检索对象的缩放比例,但这作用几乎用不到. 可以让网页实现IE7中的 ...
- 20145302张薇《网络对抗技术》PC平台逆向破解
20145302张薇<网络对抗技术>PC平台逆向破解 实验任务 1.简单shellcode注入实验 2.Return-to-libc 攻击实验 实验相关原理 Bof攻击防御技术 从防止注入 ...
- 关于《Java读书笔记》第六章课后习题选择题总结与疑问
课后习题 选择题 3 题 代码: class Some{ String ToString(){ return "Some instance"; } } public class M ...
- HDU 1166 敌兵布阵(线段树 or 二叉索引树)
http://acm.hdu.edu.cn/showproblem.php?pid=1166 题意:第一行一个整数T,表示有T组数据. 每组数据第一行一个正整数N(N<=50000),表示敌人有 ...