《DSP using MATLAB》示例 Example 9.14
代码:
%% ------------------------------------------------------------------------

%%            Output Info about this m-file

fprintf('\n***********************************************************\n');

fprintf('        <DSP using MATLAB> Exameple 9.14 \n\n');

time_stamp = datestr(now, 31);

[wkd1, wkd2] = weekday(today, 'long');

fprintf('      Now is %20s, and it is %7s  \n\n', time_stamp, wkd2);

%% ------------------------------------------------------------------------

% Given Parameters:

D = 2; Rp = 0.1; As = 50; wxp = pi/8; wxs = pi/D; wp = wxp; ws = (2*pi/D)-wxs;

% Filter Design:

[delta1, delta2] = db2delta(Rp, As);

[N, F, A, weights] = firpmord([wp, ws]/pi, [1, 0], [delta1, delta2], 2); N = ceil(N/2)*2;

h = firpm(N, F, A, weights);

delay = N/2;                        % delay imparted by the filter

%% -----------------------------------------------------------------

%%                             Plot

%% -----------------------------------------------------------------

% Input signal x(n) = cos(2*pi*n/16)

n = [0:256]; x = cos(pi*n/8);

n1 = n(1:33); x1 = x(33:65);            % for plotting purposes

Hf1 = figure('units', 'inches', 'position', [1, 1, 8, 6], ...

	'paperunits', 'inches', 'paperposition', [0, 0, 6, 4], ...

	'NumberTitle', 'off', 'Name', 'Exameple 9.14');

set(gcf,'Color','white');

TF = 10;

subplot(2, 2, 1);

Hs1 = stem(n1, x1, 'filled'); set(Hs1, 'markersize', 2, 'color', 'g');

axis([-2, 34, -1.2, 1.2]); grid on;

xlabel('n', 'vertical', 'middle'); ylabel('Amplitude', 'vertical', 'middle');

title('Input Singal: x(n) = cos(\pin/8) ', 'fontsize', TF, 'vertical', 'baseline');

set(gca, 'xtick', [0:8:32]);

set(gca, 'ytick', [-1, 0, 1]);

% Decimation of x(n): D = 2

y = upfirdn(x, h, 1, D);

m = delay+1:1:128/D+delay+1; y1 = y(m); m = 0:16; y1 = y1(14:30);

subplot(2, 2, 3);

Hs2 = stem(m, y1, 'filled'); set(Hs2, 'markersize', 2, 'color', 'm');

axis([-1, 17, -1.2, 1.2]); grid on;

xlabel('m', 'vertical', 'middle'); ylabel('Amplitude', 'vertical', 'middle');

title('Output Singal: y(n): D=2', 'fontsize', TF, 'vertical', 'baseline');

set(gca, 'xtickmode', 'manual', 'xtick', [0:8:32]/D);

set(gca, 'ytickmode', 'manual', 'ytick', [-1, 0, 1]);

% Filter Design Plots

[Hr, w, a, L] = Hr_Type1(h); Hr_min = min(Hr); w_min = find(Hr == Hr_min);

H = abs(freqz(h, 1, w)); Hdb = 20*log10(H/max(H)); min_attn = Hdb(w_min);

subplot(2, 2, 2);

plot(w/pi, Hr, 'm', 'linewidth', 1.0); axis([0, 1, -0.1, 1.1]); grid on;

xlabel('Frequency in \pi units', 'fontsize', TF, 'vertical', 'middle');

ylabel('Amplitude', 'vertical', 'cap');

title('Amplitude Response', 'fontsize', TF, 'vertical', 'baseline');

set(gca, 'xtick', [0, wp/pi, ws/pi, 1], 'ytick', [0, 1]);

subplot(2, 2, 4);

plot(w/pi, Hdb, 'm', 'linewidth', 1.0); axis([0, 1, -60, 10]); grid on;

xlabel('Frequency in \pi units', 'fontsize', TF, 'vertical', 'middle');

ylabel('Decibels', 'vertical', 'cap');

title('Log-magnitude Response', 'fontsize', TF, 'vertical', 'baseline');

set(gca, 'xtick', [0, wp/pi, ws/pi, 1], 'ytick', [-60, round(min_attn), 0]);
运行结果:
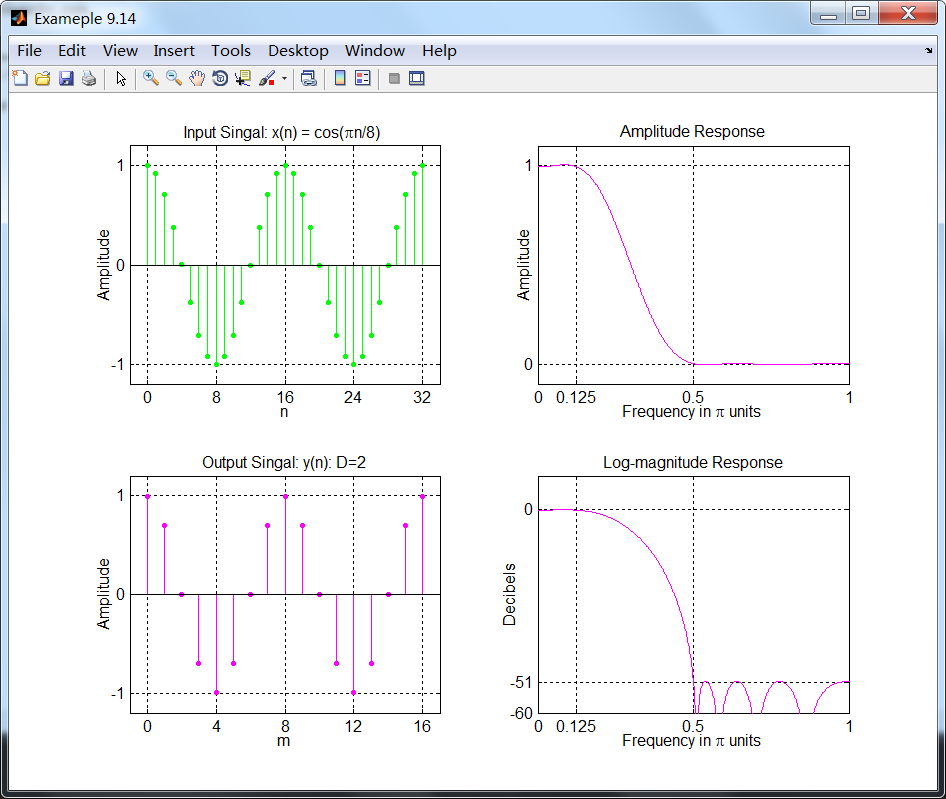
设计的滤波器达到51dB的衰减,并且减采样的信号是正确的。
《DSP using MATLAB》示例 Example 9.14的更多相关文章
- 《DSP using MATLAB》Problem 7.14
代码: %% ++++++++++++++++++++++++++++++++++++++++++++++++++++++++++++++++++++++++++++++++ %% Output In ...
- 《DSP using MATLAB》Problem 6.14
代码: %% ++++++++++++++++++++++++++++++++++++++++++++++++++++++++++++++++++++++++++++++++ %% Output In ...
- 《DSP using MATLAB》Problem 5.14
说明:这两个小题的数学证明过程都不会,欢迎博友赐教. 直接上代码: %% +++++++++++++++++++++++++++++++++++++++++++++++++++++++++++++++ ...
- 《DSP using MATLAB》Problem 4.14
代码: %% ---------------------------------------------------------------------------- %% Output Info a ...
- 《DSP using MATLAB》Problem 2.14
代码: %% ------------------------------------------------------------------------ %% Output Info about ...
- 《DSP using MATLAB》Problem 8.14
代码: %% ------------------------------------------------------------------------ %% Output Info about ...
- DSP using MATLAB 示例Example3.21
代码: % Discrete-time Signal x1(n) % Ts = 0.0002; n = -25:1:25; nTs = n*Ts; Fs = 1/Ts; x = exp(-1000*a ...
- DSP using MATLAB 示例 Example3.19
代码: % Analog Signal Dt = 0.00005; t = -0.005:Dt:0.005; xa = exp(-1000*abs(t)); % Discrete-time Signa ...
- DSP using MATLAB示例Example3.18
代码: % Analog Signal Dt = 0.00005; t = -0.005:Dt:0.005; xa = exp(-1000*abs(t)); % Continuous-time Fou ...
- DSP using MATLAB 示例Example3.23
代码: % Discrete-time Signal x1(n) : Ts = 0.0002 Ts = 0.0002; n = -25:1:25; nTs = n*Ts; x1 = exp(-1000 ...
随机推荐
- win7 +v Ubuntu 16.04 grub rescue 模式下修复 grub
前几天整理了下电脑的分区,合并并删除一些分区,结果导致 grub 被破坏了,Ubuntu进不去了,启动后直接进入了 rescure 模式.后来又折腾了下,终于修复好了,现总结一下. 先说一下我的系统环 ...
- Linux 查看系统所有用户
grep bash /etc/passwd Linux 查看系统所有用户
- 使用cronolog工具给tomcat进行日志切割
关于cronolog的用法查看:https://www.freebsd.org/cgi/man.cgi?query=cronolog&apropos=0&sektion=0&m ...
- js输出大段html文档简便方法
原文链接:https://zhidao.baidu.com/question/586477237.html 把要输出的html全部写在某个id中,然后复制过去,你想放多少都行 <script t ...
- 20145326 《Java程序设计》第9周学习总结
20145326 <Java程序设计>第9周学习总结 教材学习内容总结 第十六章 一.JDBC入门 1.JDBC简介 JDBC是用于执行SQL的解决方案,开发人员使用JDBC的标准接口,数 ...
- phpstorm2016.1 添加对Drupal的编程支持
一.前言 phpstorm作为目前对drupal支持最好的开发工具之一,是drupal模块开发的首选工具.今天我就来谈谈最新的phpstorm如何添加对drupal模块的支持. 相关环境:操作系统ub ...
- Java多线程,线程交替执行
两个线程,一个打印1-100的奇数,一个打印1-100的偶数:要求:线程1打印5个之后,线程2开始打印,线程2打印5个之后,线程1再开始打印,以此循环. Code: package com.qhong ...
- 【日志】修改redis日志路径
redis默认不记录log文件,需要在Redis.conf文件,找到loglevel notice,在其后的logfile "",双引号中,写redis的路径"/redi ...
- UVa 10635 王子和公主(LCS转LIS)
https://vjudge.net/problem/UVA-10635 题意: 有两个长度分别为p+1和q+1的序列,每个序列中的各个元素互不相同,且都是1~n^2之间的整数.两个序列的第一个元素均 ...
- POJ 2185 Milking Grid(KMP最小循环节)
http://poj.org/problem?id=2185 题意: 给出一个r行c列的字符矩阵,求最小的覆盖矩阵可以将原矩阵覆盖,覆盖矩阵不必全用完. 思路: 我对于字符串的最小循环节是这么理解的: ...