《DSP using MATLAB》Problem 7.14
代码:
%% ++++++++++++++++++++++++++++++++++++++++++++++++++++++++++++++++++++++++++++++++
%% Output Info about this m-file
fprintf('\n***********************************************************\n');
fprintf(' <DSP using MATLAB> Problem 7.14 \n\n'); banner();
%% ++++++++++++++++++++++++++++++++++++++++++++++++++++++++++++++++++++++++++++++++ % bandpass
ws1 = 0.25*pi; wp1 = 0.35*pi; wp2=0.65*pi; ws2=0.75*pi;
delta1 = 0.05; delta2 = 0.01;
tr_width = min(wp1-ws1, ws2-wp2);
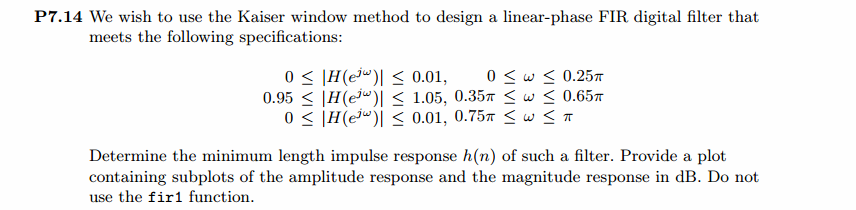
f = [ws1, wp1, wp2, ws2]/pi; [Rp, As] = delta2db(delta1, delta2) M = ceil((As-7.95)/(2.285*tr_width)) + 1; % Kaiser Window
if As > 21 || As < 50
beta = 0.5842*(As-21)^0.4 + 0.07886*(As-21);
else
beta = 0.1102*(As-8.7);
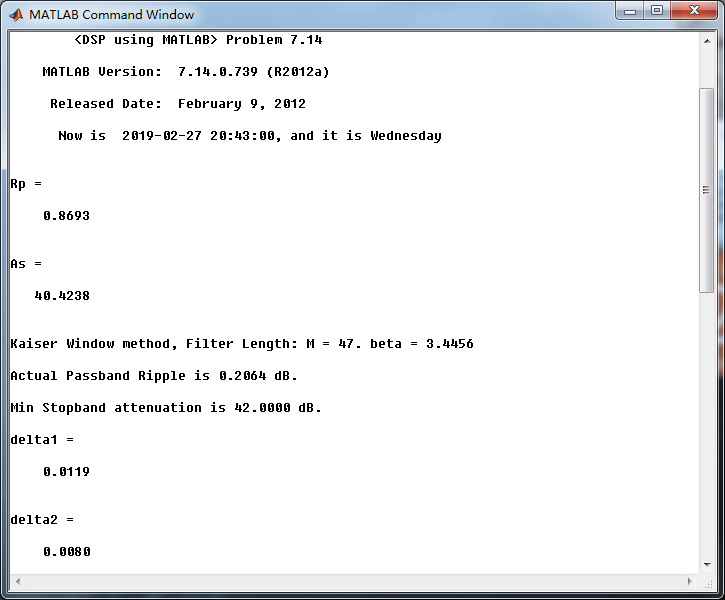
end fprintf('\nKaiser Window method, Filter Length: M = %d. beta = %.4f\n', M, beta); n = [0:1:M-1]; wc1 = (ws1+wp1)/2; wc2 = (ws2+wp2)/2; %wc = (ws + wp)/2, % ideal LPF cutoff frequency hd = ideal_lp(wc2, M) - ideal_lp(wc1, M);
w_kai = (kaiser(M, beta))'; h = hd .* w_kai;
[db, mag, pha, grd, w] = freqz_m(h, [1]); delta_w = 2*pi/1000;
[Hr,ww,P,L] = ampl_res(h); Rp = -(min(db(wp1/delta_w :1: wp2/delta_w+1))); % Actual Passband Ripple
fprintf('\nActual Passband Ripple is %.4f dB.\n', Rp); As = -round(max(db(1 : 1 : floor(ws1/delta_w)+1 ))); % Min Stopband attenuation
fprintf('\nMin Stopband attenuation is %.4f dB.\n', As); [delta1, delta2] = db2delta(Rp, As) % Plot figure('NumberTitle', 'off', 'Name', 'Problem 7.14 ideal_lp Method')
set(gcf,'Color','white'); subplot(2,2,1); stem(n, hd); axis([0 M-1 -0.3 0.4]); grid on;
xlabel('n'); ylabel('hd(n)'); title('Ideal Impulse Response'); subplot(2,2,2); stem(n, w_kai); axis([0 M-1 0 1.1]); grid on;
xlabel('n'); ylabel('w(n)'); title('Kaiser Window'); subplot(2,2,3); stem(n, h); axis([0 M-1 -0.3 0.4]); grid on;
xlabel('n'); ylabel('h(n)'); title('Actual Impulse Response'); subplot(2,2,4); plot(w/pi, db); axis([0 1 -100 10]); grid on;
set(gca,'YTickMode','manual','YTick',[-90,-42,0]);
set(gca,'YTickLabelMode','manual','YTickLabel',['90';'42';' 0']);
set(gca,'XTickMode','manual','XTick',[0,f,1]);
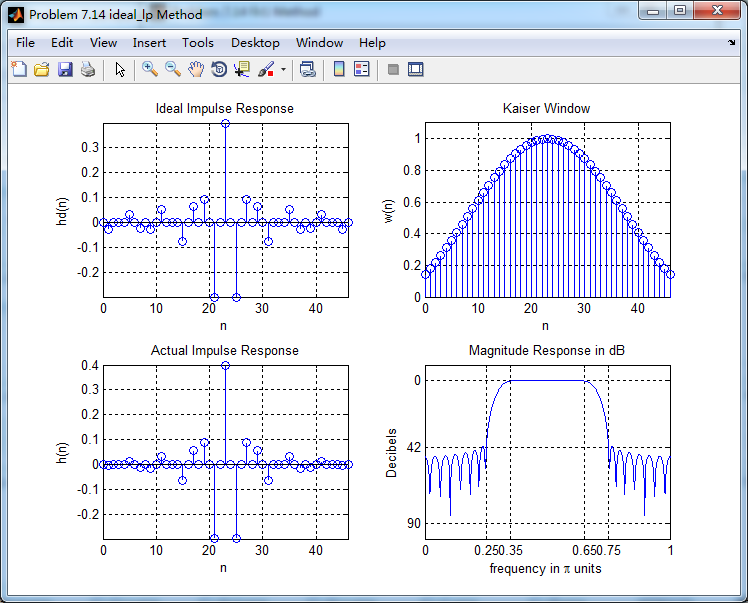
xlabel('frequency in \pi units'); ylabel('Decibels'); title('Magnitude Response in dB'); figure('NumberTitle', 'off', 'Name', 'Problem 7.14 h(n) ideal_lp Method')
set(gcf,'Color','white'); subplot(2,2,1); plot(w/pi, db); grid on; axis([0 2 -100 10]);
xlabel('frequency in \pi units'); ylabel('Decibels'); title('Magnitude Response in dB');
set(gca,'YTickMode','manual','YTick',[-90,-42,0])
set(gca,'YTickLabelMode','manual','YTickLabel',['90';'42';' 0']);
set(gca,'XTickMode','manual','XTick',[0,f,1+f,2]); subplot(2,2,3); plot(w/pi, mag); grid on; %axis([0 2 -100 10]);
xlabel('frequency in \pi units'); ylabel('Absolute'); title('Magnitude Response in absolute');
set(gca,'XTickMode','manual','XTick',[0,f,1+f,2]);
set(gca,'YTickMode','manual','YTick',[0,0.5, 1]) subplot(2,2,2); plot(w/pi, pha); grid on; %axis([0 1 -100 10]);
xlabel('frequency in \pi units'); ylabel('Rad'); title('Phase Response in Radians');
subplot(2,2,4); plot(w/pi, grd*pi/180); grid on; %axis([0 1 -100 10]);
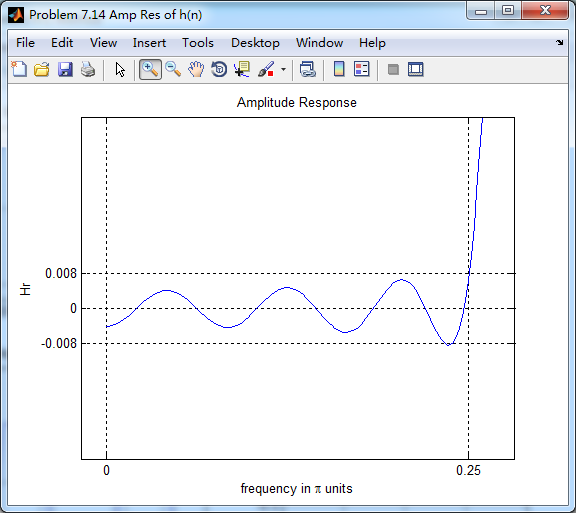
xlabel('frequency in \pi units'); ylabel('Rad'); title('Group Delay'); figure('NumberTitle', 'off', 'Name', 'Problem 7.14 Amp Res of h(n)')
set(gcf,'Color','white'); plot(ww/pi, Hr); grid on; %axis([0 1 -100 10]);
xlabel('frequency in \pi units'); ylabel('Hr'); title('Amplitude Response');
set(gca,'YTickMode','manual','YTick',[-delta2,0,delta2,1 - delta1,1, 1 + delta1])
%set(gca,'YTickLabelMode','manual','YTickLabel',['90';'45';' 0']);
set(gca,'XTickMode','manual','XTick',[0,f,2]); %% +++++++++++++++++++++++++++++++++++++++++
%% fir1 function method
%% +++++++++++++++++++++++++++++++++++++++++
f = [ws1, wp1, wp2, ws2]/pi;
m = [0 1 0];
ripple = [0.01 0.05 0.01];
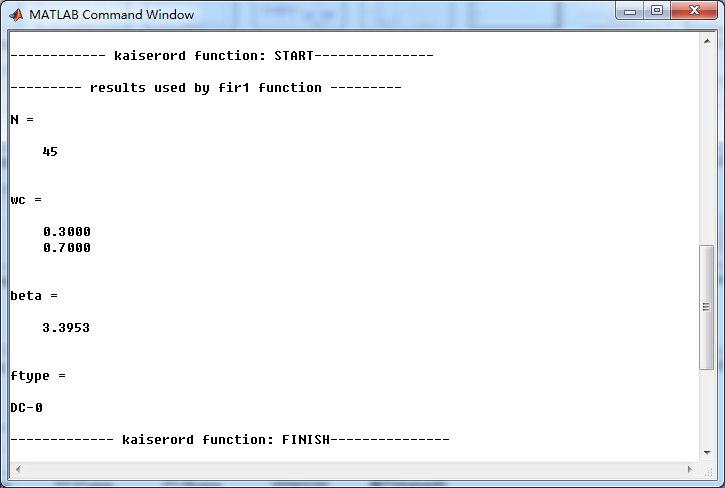
[N, wc, beta, ftype] = kaiserord(f,m,ripple);
fprintf('\n------------ kaiserord function: START---------------\n');
fprintf('\n--------- results used by fir1 function ---------\n');
N
wc
beta
ftype
fprintf('------------- kaiserord function: FINISH---------------\n');
%h_check = fir1(M-1, [wc1 wc2]/pi, 'stop', window(@kaiser, M));
%h_check = fir1(N, wc, ftype, window(@kaiser, N+1));
h_check = fir1(N, wc, ftype, kaiser(N+1, beta)); [db, mag, pha, grd, w] = freqz_m(h_check, [1]);
[Hr,ww,P,L] = ampl_res(h_check); As = -round(max(db(1 : 1 : floor(ws1/delta_w)+1 ))); % Min Stopband attenuation
fprintf('\nMin Stopband attenuation is %.4f dB.\n', As); Rp = -(min(db(wp1/delta_w :1: wp2/delta_w+1))); % Actual Passband Ripple
fprintf('\nActual Passband Ripple is %.4f dB.\n', Rp); [delta1, delta2] = db2delta(Rp, As) %% -------------------------------------------
%% plot
%% -------------------------------------------
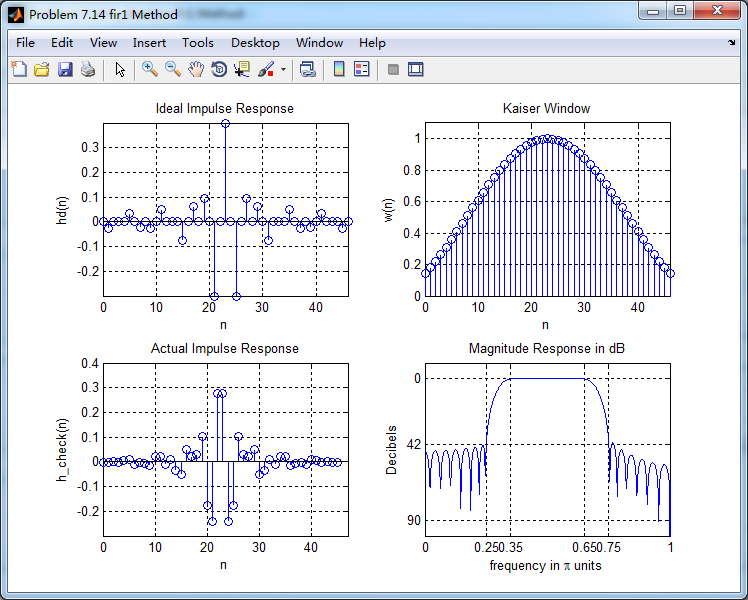
figure('NumberTitle', 'off', 'Name', 'Problem 7.14 fir1 Method')
set(gcf,'Color','white'); subplot(2,2,1); stem(n, hd); axis([0 M-1 -0.3 0.4]); grid on;
xlabel('n'); ylabel('hd(n)'); title('Ideal Impulse Response'); subplot(2,2,2); stem(n, w_kai); axis([0 M-1 0 1.1]); grid on;
xlabel('n'); ylabel('w(n)'); title('Kaiser Window'); subplot(2,2,3); stem([0:N], h_check); axis([0 M -0.3 0.4]); grid on;
xlabel('n'); ylabel('h\_check(n)'); title('Actual Impulse Response'); subplot(2,2,4); plot(w/pi, db); axis([0 1 -100 10]); grid on;
set(gca,'YTickMode','manual','YTick',[-90,-42,0]);
set(gca,'YTickLabelMode','manual','YTickLabel',['90';'42';' 0']);
set(gca,'XTickMode','manual','XTick',[0,f,1]);
xlabel('frequency in \pi units'); ylabel('Decibels'); title('Magnitude Response in dB'); figure('NumberTitle', 'off', 'Name', 'Problem 7.14 h_check(n) fir1 Method')
set(gcf,'Color','white'); subplot(2,2,1); plot(w/pi, db); grid on; axis([0 2 -100 10]);
xlabel('frequency in \pi units'); ylabel('Decibels'); title('Magnitude Response in dB');
set(gca,'YTickMode','manual','YTick',[-90,-42,0])
set(gca,'YTickLabelMode','manual','YTickLabel',['90';'42';' 0']);
set(gca,'XTickMode','manual','XTick',[0,f,1+f,2]); subplot(2,2,3); plot(w/pi, mag); grid on; %axis([0 2 -100 10]);
xlabel('frequency in \pi units'); ylabel('Absolute'); title('Magnitude Response in absolute');
set(gca,'XTickMode','manual','XTick',[0,f,1+f,2]);
set(gca,'YTickMode','manual','YTick',[0,0.5, 1]) subplot(2,2,2); plot(w/pi, pha); grid on; %axis([0 1 -100 10]);
xlabel('frequency in \pi units'); ylabel('Rad'); title('Phase Response in Radians');
subplot(2,2,4); plot(w/pi, grd*pi/180); grid on; %axis([0 1 -100 10]);
xlabel('frequency in \pi units'); ylabel('Rad'); title('Group Delay');
运行结果:


使用fir1函数得到的对应结果


《DSP using MATLAB》Problem 7.14的更多相关文章
- 《DSP using MATLAB》Problem 6.14
代码: %% ++++++++++++++++++++++++++++++++++++++++++++++++++++++++++++++++++++++++++++++++ %% Output In ...
- 《DSP using MATLAB》Problem 5.14
说明:这两个小题的数学证明过程都不会,欢迎博友赐教. 直接上代码: %% +++++++++++++++++++++++++++++++++++++++++++++++++++++++++++++++ ...
- 《DSP using MATLAB》Problem 4.14
代码: %% ---------------------------------------------------------------------------- %% Output Info a ...
- 《DSP using MATLAB》Problem 2.14
代码: %% ------------------------------------------------------------------------ %% Output Info about ...
- 《DSP using MATLAB》Problem 8.14
代码: %% ------------------------------------------------------------------------ %% Output Info about ...
- 《DSP using MATLAB》Problem 7.26
注意:高通的线性相位FIR滤波器,不能是第2类,所以其长度必须为奇数.这里取M=31,过渡带里采样值抄书上的. 代码: %% +++++++++++++++++++++++++++++++++++++ ...
- 《DSP using MATLAB》Problem 6.8
代码: %% ++++++++++++++++++++++++++++++++++++++++++++++++++++++++++++++++++++++++++++++++ %% Output In ...
- 《DSP using MATLAB》Problem 5.7
代码: %% ++++++++++++++++++++++++++++++++++++++++++++++++++++++++++++++++++++++++++++++++ %% Output In ...
- 《DSP using MATLAB》Problem 7.27
代码: %% ++++++++++++++++++++++++++++++++++++++++++++++++++++++++++++++++++++++++++++++++ %% Output In ...
随机推荐
- 活代码LINQ——09
一.代码 ' Fig. 9.7: LINQWithListCollection.vb ' LINQ to Objects using a List(Of String). Module LINQWit ...
- redis应用--HyperLogLog
如果你负责开发维护一个大型的网站,有一天老板找产品经理要网站每个网页每天的 UV 数据,然后让你来开发这个统计模块,你会如何实现? 如果统计 PV 那非常好办,给每个网页一个独立的 Redis 计数器 ...
- oracle插入数据的时候报错:ORA-00928: 缺失 SELECT 关键字
比如:插入数据的时候是这样的insert into a value('哈哈'); 报的是这样的错误:ORA-00928: 缺失 SELECT 关键字 其实就是value少了一个s,在oracle中,插 ...
- form表单提交到Servlet后,弹出对话框,然后在跳转页面
在Servlet中添加一下代码即可 out.print("<script>alert('添加成功!');window.location='index.jsp';</scri ...
- 如何用ESP8266/8285做一个WIFI广告机(虚拟WiFi)
准备工作 准备一个深圳四博智联科技有限公司的ESP-F 模组.或者四博智联科技的NODEMCU 当我们拿到ESP-F模块后,可以按照以下接线进行测试: 即 VCC.EN 接 3.3v.GPIO15 G ...
- 反射 day1
1.Object objval = rs.getObject(fieldName);//如果数据库值为空时的返回值java中的null //这个如果是oracle数值型的数据的会返回的可能类型有很多, ...
- shell练习题5
需求如下: 用shell实现,把一个文件文档中只有一个数字的行给打印出来.(以/password文件为例,自行修改) 参考解答如下 方法1 #!/bin/bash file_name=passwd n ...
- day14 内置函数二
lamda 语法: 函数名 = lambda 参数: 返回值注意: 1. 函数的参数可以有多个. 多个参数之间⽤逗号隔开 2. 匿名函数不管多复杂. 只能写⼀⾏, 且逻辑结束后直接返回数据 3. 返回 ...
- php的array数组 -------方法foreach循环时候,利用数组里值的引用地址(& )从而改变数组里的值
/* * 把每个数组值后面都加个SQL然后返回数组 * foreach循环时候,直接用引用(&)的方式就能改变之前的数组 */public function array_foreach(){ ...
- url_encode和base64
在用一个某开源插件做封装,想要传一些参数进去. 多数字段都是普通字符串参数,但是有一个字段传的是json,结果发现这个插件一看到大括号和双引号就识别错误了. 不想改这个插件的源码,考虑自己传进去的时候 ...