Sampling and Estimation
Sampling and Estimation
Sampling Error
Sampling error is the difference between a sample statistic(the mean, variance, or standard deviation of the sample) and its corresponding population parameter(the true mean, variance, or standard deviation of the population).
For example, the sampling error for the mean is as follows:
sampling errors of the mean = sample mean - population mean = x-μ
Simple Random Sampling
Simple random sampling is a method of selecting a sample in such a way that each item or person in the population being studied has the same likelihood of being included in the sample.
Stratified Random Sampling (分层抽样)
Stratified random sampling uses a classification system to separate the population into smaller groups based on one or more distinguishing characteristics. From each subgroup, or stratum, a random sample is taken and the results are pooled. The size of the samples from each stratum is based on the size of the stratum relative to the population.
Sampling Distribution
It is important to recognize that the sample statistic itself is a random variable and, therefore, has a probability distribution. The sampling distribution of the sample statistic is a probability distribution of all possible sample statistics computed from a set of equal-size samples that were randomly drawn from the same population.
Central Limit Theorem (中心极限定理)
The central limit theorem states that for simple random samples of size n from a population with a mean μ and a finite variance σ^2, the sampling distribution of the sample mean x approaches a normal probability distribution with mean μ and a variance equal to (σ^2/n) as the sample size becomes large.
The central limit theorem is extremely useful because the normal distribution is relatively easy to apply to hypothesis testing and to the construction of confidence intervals. Specific inferences about the population mean can be made from the sample mean, regardless of the population's distribution, as long as the sample size if "sufficiently large" which usually means n>=30.
Important properties of the central limit theorem include the following:
- If the sample size n is sufficiently large (n>=30), the sampling distribution of the sample means will be approximately normal. Remember what's going on here, random samples of size n are repeatedly being taken from an overall larger population. Each of these random samples has its own mean, which is itself a random variable, and this set of sample means has a distribution that is approximately normal.
- The mean of the population, μ, and the mean of the distribution of all possible sample means are equal.
- The variance of the distribution of sample means is (σ^2/n), the population variance divided by the sample size.
Standard Error (标准误差)
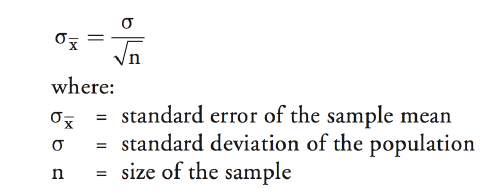
The standard error of the sample mean is the standard deviation of the distribution of the sample means.
When the standard deviation of the population, σ, is known,, the standard error of the sample mean is calculated as σ/(n^0.5)
Practically speaking, the population's standard deviation is almost never known. Instead, the standard error of the sample mean must be estimated by dividing the standard deviation of the sample mean by n^0.5 - s/(n^0.5)

Point Estimate (点估计) and Confidence Interval(置信区间)
Point estimates are single (sample) values used to estimate population parameters. The formula used to compute the point estimate is called the estimator. For example, the sample mean, x, is an estimator of the population mean μ and is computed as (∑X)/n
The value generated with this calculation for a given sample is called the point estimate of the mean.
A confidence interval is a range of values in which the population parameter is expected to lie.
Student's t-distribution
Student's t-distribution, or simply the t-distribution, is a bell-shaped probability distribution that is symmetrical about its mean. It is the appropriate distribution to use when constructing confidence intervals based on small samples (n<30) from populations with unknown variance and a normal, or approximately normal, distribution.
It may also be appropriate to use the t-distribution when the population variance is unknown and the sample size is large enough that the central limit theorem assure that the sampling distribution is approximately normal.
t-distribution has the following properties:
- It's symmetrical
- It is defined by a single parameter, the degree of freedom(df), where the degrees of freedom are equal to the number of sample observations minus 1, n-1, for sample means.
- It has more probability in the tails ("fatter tails") than the normal distribution.
- As the degree of freedom (the sample size) gets larger, the shape of the t-distribution more closely approaches a standard normal distribution.
The degree of freedom for tests based on sample means are n-1 because, given the mean, only n-1 observations can be unique.
As the number of degrees of freedom increases without bound, the t-distribution converges to the standard normal distribution (z-distribution). The thickness of the tails relative to those of the z-distribution is important in hypothesis testing because thicker tails mean more observations away from the center of the distribution (more outliers). Hence, hypothesis testing using the t-distribution makes it more difficult to reject null relative to hypothesis testing using the z-distribution.

Confidence Interval
Confidence interval estimates result in a range of values within which the actual value of a parameter will lie, given the probability of 1-α. Here, alpha, α, is called the level of significance for the confidence interval, and the probability 1-α is referred to as the degree of confidence.
Confidence intervals are usually constructed by adding or subtracting an appropriate value from the point estimate. In general, confidence intervals take on the following form:
point estimate +/- (reliability factor * standard error)
- point estimate = value of a sample statistic of the population parameter
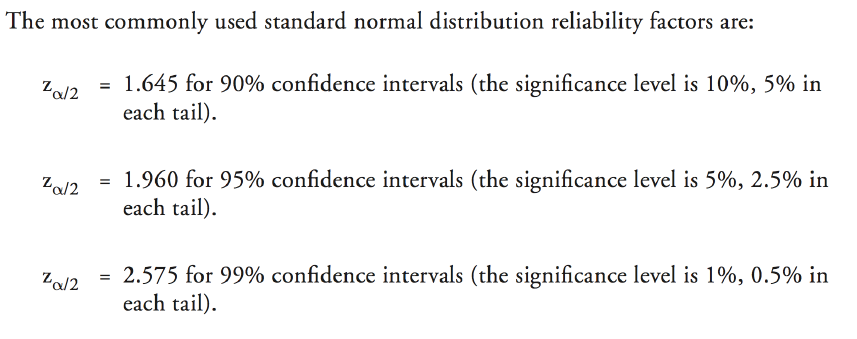
- reliability factor = number that depends on the sampling distribution of the point estimate and the probability that the point estimate falls in the confidence interval, 1-α
- standard error = standard error of the point estimate
If the population has a normal distribution with a known variance, a confidence interval for the population mean can be calculated as:

If the distribution of the population is normal with unknown variance, we can use t-distribution to construct a confidence interval:

Unlike the standard normal distribution, the reliability factors for the t-distribution depend on the sample size, so we cannot rely on a commonly used set of reliability factors. Instead, reliability factors for the t-distribution have to be looked up in a table of Student's t-distribution.
Owing to the relatively fatter tails of the t-distribution, confidence intervals constructed using t-reliability factors will be more conservative(wider) than those constructed using z-reliability factors.
If the distribution is nonnormal but the the population variance is known, the z-statistic can be used as long as the sample size is large(n>=30).
We can do this because the central limit theorem assures us that the distribution of the sample mean is approximately normal when the sample is large.
If the distribution is nonnormal and the population variance is unknown, the t-statistic can be used as long as the sample size is large(n>=30).
It is also acceptable to use the z-statistic, although use of the t-statistic is more conservative.
If we are sampling from a nonnormal distribution (which is sometimes the case in finance), we cannot create a confidence interval if the sample size is less than 30.
So, all else equal, make sure you have a sample of at least 30, and the larger, the better.

Sampling and Estimation的更多相关文章
- 斯坦福CS课程列表
http://exploredegrees.stanford.edu/coursedescriptions/cs/ CS 101. Introduction to Computing Principl ...
- Notes on Noise Contrastive Estimation and Negative Sampling
Notes on Noise Contrastive Estimation and Negative Sampling ## 生成负样本 在常见的关系抽取应用中,我们经常需要生成负样本来训练一个好的系 ...
- [Bayes] Parameter estimation by Sampling
虽然openBugs效果不错,但原理是什么呢?需要感性认识,才能得其精髓. Recall [Bayes] prod: M-H: Independence Sampler firstly. 采样法 Re ...
- Noise Contrastive Estimation
Notes from Notes on Noise Contrastive Estimation and Negative Sampling one sample: \[x_i \to [y_i^0, ...
- 蒙特卡洛法计算定积分—Importance Sampling
如上图所示,计算区间[a b]上f(x)的积分即求曲线与X轴围成红色区域的面积.下面使用蒙特卡洛法计算区间[2 3]上的定积分:∫(x2+4*x*sin(x))dx # -*- coding: u ...
- DL4NLP——词表示模型(三)word2vec(CBOW/Skip-gram)的加速:Hierarchical Softmax与Negative Sampling
上篇博文提到,原始的CBOW / Skip-gram模型虽然去掉了NPLM中的隐藏层从而减少了耗时,但由于输出层仍然是softmax(),所以实际上依然“impractical”.所以接下来就介绍一下 ...
- 随机采样和随机模拟:吉布斯采样Gibbs Sampling
http://blog.csdn.net/pipisorry/article/details/51373090 吉布斯采样算法详解 为什么要用吉布斯采样 通俗解释一下什么是sampling. samp ...
- Gibbs sampling
In statistics and in statistical physics, Gibbs sampling or a Gibbs sampler is aMarkov chain Monte C ...
- NCE损失(Noise-Constrastive Estimation Loss)
1.算法概述 假设X是从真实的数据(或语料库)中抽取的样本,其服从一个相对可参考的概率密度函数P(d),噪音样本Y服从概率密度函数为P(n),噪音对比估计(NCE)就是通过学习一个分类器把这两类样本区 ...
随机推荐
- procedure
create or replace procedure get_username as begin v_id in number:=1 select * from uc_t_staff t where ...
- 深夜闲聊节目:华为 Mate7的指纹识别安全么?
许久没有写过不论什么东西,近期非常忙并且还要准备找工作之类的,唉... ....今天的文章也不说技术,仅仅是闲聊. 一.手机指纹识别一揽 打开非常多站点.论坛的科技栏目,充斥着各种手机讯息!仿佛手机已 ...
- windows 安装 docker
.https://download.docker.com/win/stable/InstallDocker.msi .设置环境变量 C:\Program Files (x86)\Git\bin .如果 ...
- Swift教程_swift常见问题(0005)_完美解决Cannot override 'dealloc'异常
Swift教程_swift常见问题(0001)_CoreData: warning: Unable to load class named 'xxx' for entity 'xxx' Swift教程 ...
- jQuery+PHP动态显示(项目)实时时间和倒计时
jQuery动态显示当前时间: html代码:<div id="current_time"></div> setInterval()使用:setInt ...
- mysql中innodb和myisam的区别
InnoDB和MyISAM是很多人在使用MySQL时最常用的两个表类型,这两个表类型各有优劣,5.7之后就不一样了 1.事务和外键 InnoDB具有事务,支持4个事务隔离级别,回滚,崩溃修复能力和多版 ...
- Nginx配置https和wss
微信小程序不仅要求必须是HTTPS和WSS,还要求URL里不能有端口号. 一.使用Nginx足够了 常见的服务器有三种: Nginx IIS Apache 这三种服务器都可以配置https,但是没必要 ...
- Python的copy()与deepcopy()区别
Python的copy()与deepcopy()分别对应浅拷贝和深拷贝. 它们的理论区别: deepcopy():深复制(也就是寻常意义上的复制),即将被复制对象完全再复制一遍作为独立的新个体单独存在 ...
- 最新最全的iOS手机支付总结
关于手机支付,我想简单总结一下,我想主要分成三大类: 第一类,就是我们最常见的应用内支付(IAP),例如APPStore里面我们可以付费下载一些APP或者游戏. 第二类,就是我们经常使用第三方支付,例 ...
- 奇怪的php问题
<?php echo 999999999999 % 2; ?> 上面的结果居然是-1,不可思议. 999999999999 % 2