
20145239 GDB调试汇编堆栈过程分析
20145239 GDB调试汇编堆栈过程分析
测试源代码
#include<stdio.h>

short addend1 = ;

static int addend2 = ;

const static long addend3 = ;

static int g(int x)

{

    return x + addend1;

}

static const int f(int x)

{

    return g(x + addend2);

}

int main(void)

{

    return f() + addend3;

}
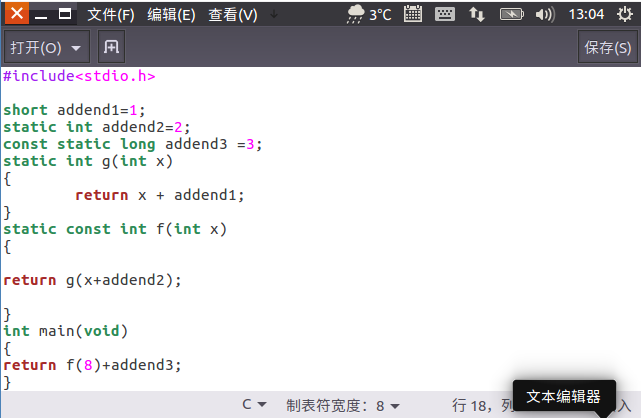
GCC编译
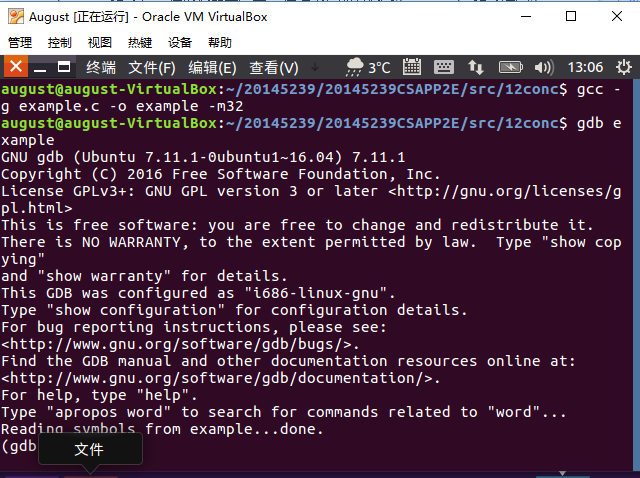
使用gcc - g example.c -o example -m32指令在64位的机器上产生32位汇编,然后使用gdb example指令进入gdb调试器
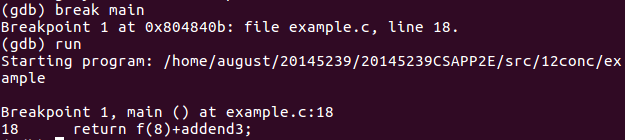
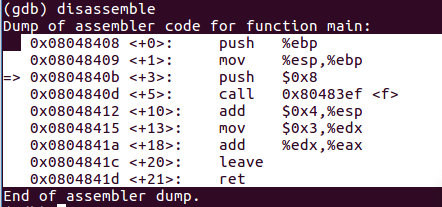
进入之后先在main函数处设置一个断点,再run一下,使用disassemble指令获取汇编代码,用i(info) r(registers)指令查看各寄存器的值:
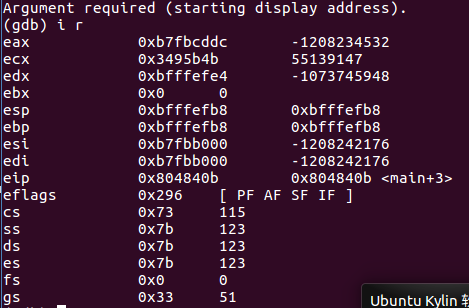
- 可见此时主函数的栈基址为 0xffffefb8,用
x(examine)指令查看内存地址中的值,但目前%esp所指堆栈内容为0,%ebp所指内容也为0

- 首先,结合display命令和寄存器或pc内部变量,输入display /i $pc、display /i $esp、display /i $ebp。这样在每次执行下一条汇编语句时,都会显示出当前执行的语句。下面展示每一步时
%esp、%ebp和堆栈内容的变化。
- call指令将下一条指令的地址入栈,此时
%esp,%ebp和堆栈的值为:

- 将上一个函数的基址入栈,从当前
%esp开始作为新基址:
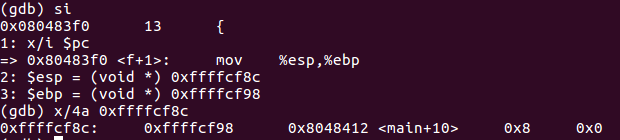
- 先为传参做准备:
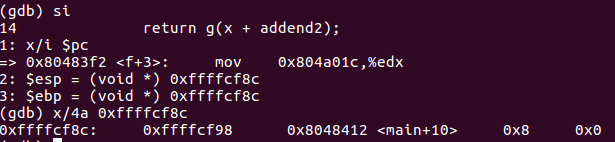
- 实参的计算在
%eax中进行:
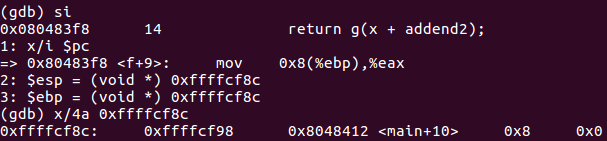
- f函数的汇编代码:
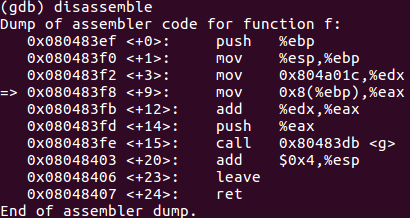
- 实参入栈:
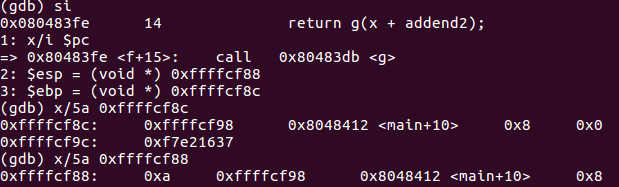
- call指令将下一条指令的地址入栈:


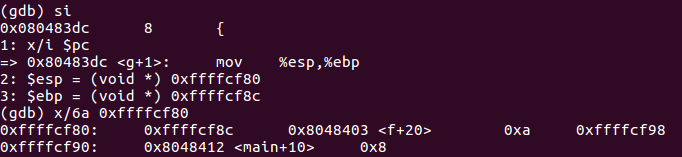
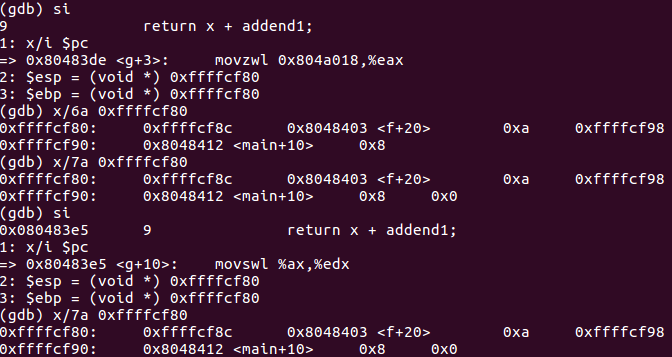
- 计算short+int:
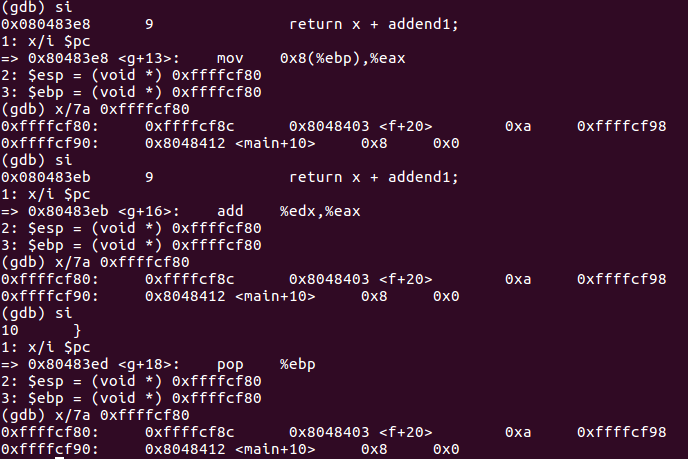
pop %ebp指令将栈顶弹到%ebp中,同时%esp增加4字节:

- ret指令将栈顶弹给
%eip:
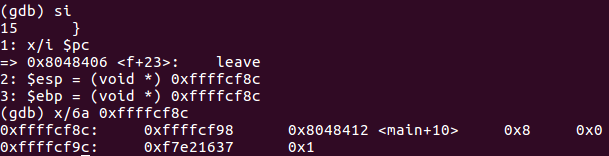
- 因为函数f修改了
%esp,所以用leave指令恢复。leave指令先将%esp对其到%ebp,然后把栈顶弹给%ebp:


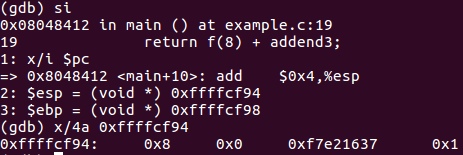
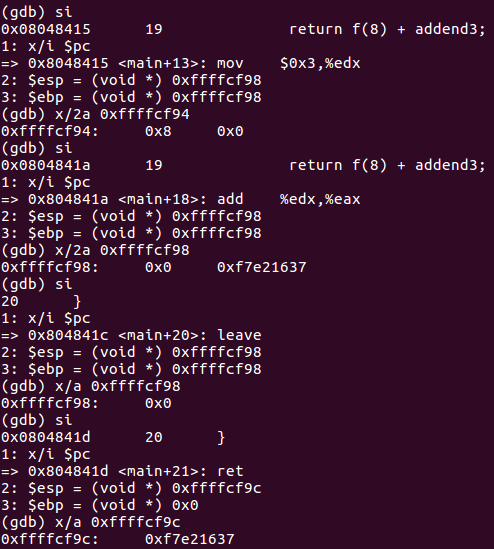
- 主函数汇编代码:
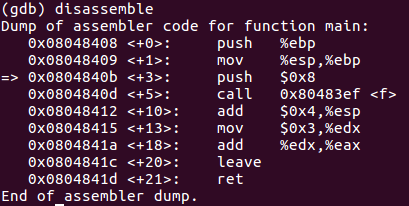
| 指令 | %esp | %ebp | %eip | %eax | 堆栈 |
|---|---|---|---|---|---|
| push $0x8 | 0xffffefb8 | 0xffffefb8 | 0x804840b | -134500932 | 0x0 |
| call 0x80483ef | 0xffffcf94 | 0xffffcf98 | 0x804840b | -134500932 | 0x8 0x0 |
| push %ebp | 0xffffcf90 | 0xffffcf98 | 0x80483ef | -134500932 | 0x8048412 0x8 0x0 |
| mov %esp,%ebp | 0xffffcf8c | 0xffffcf98 | 0x80483f0 | -134500932 | 0xffffcf98 0x8048412 0x8 0x0 |
| mov 0x804a01c,%edx | 0xffffcf8c | 0xffffcf8c | 0x80483f2 | -134500932 | 0xffffcf98 0x8048412 0x8 0x0 |
| mov 0x8(%ebp),%eax | 0xffffcf8c | 0xffffcf8c | 0x80483f8 | -134500932 | 0xffffcf98 0x8048412 0x8 0x0 |
| add %edx,%eax | 0xffffcf8c | 0xffffcf8c | 0x80483fb | 8 | 0xffffcf98 0x8048412 0x8 0x0 |
| push %eax | 0xffffcf8c | 0xffffcf8c | 0x80483fd | 10 | 0xffffcf98 0x8048412 0x8 0x0 |
| call 0x80483db | 0xffffcf88 | 0xffffcf8c | 0x80483fe | 10 | 0xa 0xffffcf98 0x8048412 0x8 0x0 |
| push %ebp | 0xffffcf84 | 0xffffcf8c | 0x80483db | 10 | 0x8048403 0xa 0xffffcf98 0x8048412 0x8 0x0 |
| mov %esp,%ebp | 0xffffcf80 | 0xffffcf8c | 0x80483dc | 10 | 0xffffcf8c 0x8048403 0xa 0xffffcf98 0x8048412 0x8 0x0 |
| movzwl 0x804a018,%eax | 0xffffcf80 | 0xffffcf80 | 0x80483de | 10 | 0xffffcf8c 0x8048403 0xa 0xffffcf98 0x8048412 0x8 0x0 |
| movswl %ax,%edx | 0xffffcf80 | 0xffffcf80 | 0x80483e5 | 1 | 0xffffcf8c 0x8048403 0xa 0xffffcf98 0x8048412 0x8 0x0 |
| mov 0x8(%ebp),%eax | 0xffffcf80 | 0xffffcf80 | 0x80483e8 | 1 | 0xffffcf8c 0x8048403 0xa 0xffffcf98 0x8048412 0x8 0x0 |
| add %edx,%eax | 0xffffcf80 | 0xffffcf80 | 0x80483eb | 10 | 0xffffcf8c 0x8048403 0xa 0xffffcf98 0x8048412 0x8 0x0 |
| pop %ebp | 0xffffcf80 | 0xffffcf80 | 0x80483ed | 11 | 0xffffcf8c 0x8048403 0xa 0xffffcf98 0x8048412 0x8 0x0 |
| ret | 0xffffcf84 | 0xffffcf8c | 0x80483ee | 11 | 0x8048403 0xa 0xffffcf98 0x8048412 0x8 0x0 |
| add $0x4,%esp | 0xffffcf88 | 0xffffcf8c | 0x8048403 | 11 | 0x8048403 0xa 0xffffcf98 0x8048412 0x8 0x0 |
| leave | 0xffffcf8c | 0xffffcf8c | 0x8048406 | 11 | 0xffffcf98 0x8048412 0x8 0x0 |
| ret | 0xffffcf90 | 0xffffcf98 | 0x8048407 | 11 | 0x8048412 0x8 0x0 |
| add $0x4,%esp | 0xffffcf94 | 0xffffcf98 | 0x8048412 | 11 | 0x8 0x0 |
| mov $0x3,%edx | 0xffffcf98 | 0xffffcf98 | 0x8048415 | 11 | 0x0 |
| add %edx,%eax | 0xffffcf98 | 0xffffcf98 | 0x804841a | 11 | 0x0 |
| leave | 0xffffcf98 | 0xffffcf98 | 0x804841c | 14 | 0x0 |
| ret | 0xffffcf9c | 0x0 | 0x804841d | 14 |
20145239 GDB调试汇编堆栈过程分析的更多相关文章
- GDB调试汇编堆栈过程分析
GDB调试汇编堆栈过程分析 分析过程 这是我的C源文件:click here 使用gcc - g example.c -o example -m32指令在64位的机器上产生32位汇编,然后使用gdb ...
- 20145212——GDB调试汇编堆栈过程分析
GDB调试汇编堆栈过程分析 测试代码 #include <stdio.h> short val = 1; int vv = 2; int g(int xxx) { return xxx + ...
- 20145223《信息安全系统设计基础》 GDB调试汇编堆栈过程分析
20145223<信息安全系统设计基础> GDB调试汇编堆栈过程分析 分析的c语言源码 生成汇编代码--命令:gcc -g example.c -o example -m32 进入gdb调 ...
- 赵文豪 GDB调试汇编堆栈过程分析
GDB调试汇编堆栈过程分析 使用gcc - g example.c -o example -m32指令在64位的机器上产生32位汇编,然后使用gdb example指令进入gdb调试器: 使用gdb调 ...
- 20145337 GDB调试汇编堆栈过程分析
20145337 GDB调试汇编堆栈过程分析 测试代码 #include<stdio.h> short addend1 = 1; static int addend2 = 2; const ...
- 20145208 GDB调试汇编堆栈过程分析
20145208 GDB调试汇编堆栈过程分析 测试代码 #include<stdio.h> short addend1 = 1; static int addend2 = 2; const ...
- 20145218 GDB调试汇编堆栈过程分析
GDB调试汇编堆栈过程分析 虚拟机中分析过程 输入gcc - g example.c -o example -m32指令在64位机器上产生32位汇编,但出现以下错误: 这时需要使用sudo apt-g ...
- 20145236 GDB调试汇编堆栈过程分析
GDB调试汇编堆栈过程分析 首先需要输入sudo apt-get install libc6-dev-i386安装一个库才能产生汇编代码,然后输入gcc - g example.c -o exampl ...
- 20145312 GDB调试汇编堆栈过程分析
20145312 GDB调试汇编堆栈过程分析 参考资料 卢肖明同学的博客:<GDB调试汇编堆栈过程分析>: http://www.cnblogs.com/lxm20145215----/p ...
随机推荐
- Session和Cookie之间存在的区别与联系
一. 概念理解 你可能有留意到当你浏览网页时,会有一些推送消息,大多数是你最近留意过的同类东西,比如你想买桌子,上淘宝搜了一下,结果连着几天会有各种各样的桌子的链接.这是因为 你浏览某个网页的时候,W ...
- android activity声明周期学习笔记
android生命周期图: Activity继承了ApplicationContext: 1:初次加载activity时顺序执行:onCreate()-->onStart()-->onRe ...
- UVA 11354 - Bond (最小生成树 + 树链剖分)
题目链接~~> 做题感悟:这题開始看到时感觉不是树不优点理,一想能够用 Kruskal 处理成树 ,然后就好攻克了. 解题思路: 先用 Kruskal 处理出最小生成树.然后用树链剖分 + 线段 ...
- 在Vue中使用layer.js弹出层插件
layer.js(mobile)是一个小巧方便的弹出层插件,在之前的apicloud项目中被大量使用,但最近对apicloud的IDE.非常不友好的文档和极低的开发效率深感厌烦,决定弃用然后转向Vue ...
- SpringCloud如何配置Eureka授权
现在已经成功的实现了一个Eureeka的服务启动以及微服务的注册配置操作,但是现在的程序有一个问题,你自己公司的Eureka服务应该可以注册的服务只能够是满足于认证要求的微服务,所有这样来在之前所进行 ...
- python单元测试unittest实例详解
转自:http://blog.csdn.net/five3/article/details/7104466 单元测试作为任何语言的开发者都应该是必要的,因为时隔数月后再回来调试自己的复杂程序时,其实也 ...
- k8s集群部署
环境: 两台虚拟机, 10.10.20.203 部署docker.etcd.flannel.kube-apiserver.kube-controller-manager.kube-scheduler ...
- CentOS 6.9上安装mysql-5.6.37
CentOS 6.9上安装mysql-5.6.37 1.准备数据存放的文件系统 新建一个逻辑卷,并将其挂载至特定目录即可.这里不再给出过程. 这里假设其逻辑卷的挂载目录为/data,而后需要创建/da ...
- mongodb 安装及使用
https://www.cnblogs.com/shileima/p/7823434.html
- 使用 SourceTree 遇到冲突的解决方法
首先,更新代码之前先 git stash ,然后 git pull ,再 git stash pop 这时候如果本地改的代码跟线上的冲突了,就报错了.那么就需要手动解决冲突. 打开存在冲突的文件,会看 ...