Just My Code debugging
Just My Code debugging
During a debugging session, the Modules window shows which code modules the debugger is treating as My Code (user code), along with their symbol loading status. For more information, see Get more familiar with how the debugger attaches to your app.

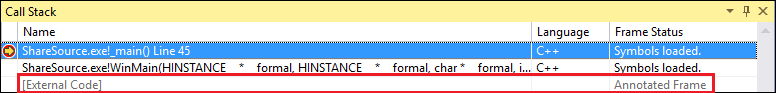
In the Call Stack or Tasks window, Just My Code collapses non-user code into a grayed-out annotated code frame labeled [External Code].
Tip: To open the Modules, Call Stack, Tasks, or most other debugging windows, you must be in a debugging session. While debugging, under Debug > Windows, select the windows you want to open.
To view the code in a collapsed [External Code] frame, right-click in the Call Stack or Task window, and select Show External Code from the context menu. The expanded external code lines replace the [External Code] frame.
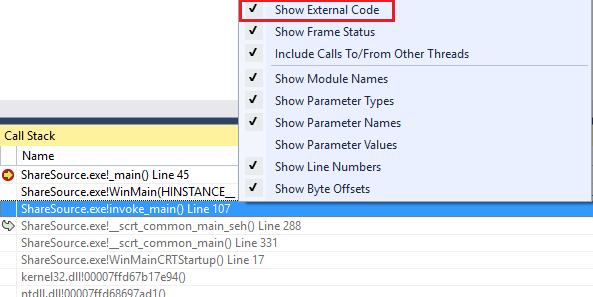
Note: Show External Code is a current user profiler setting that applies to all projects in all languages that are opened by the user.
Double-clicking an expanded external code line in the Call Stack window highlights the calling code line in green in the source code. For DLLs or other modules not found or loaded, a symbol or source not found page may open.
References
Debug user code with Just My Code - Visual Studio (Windows) | Microsoft Docs
Visual Studio Debug only user code with Just My Code - ltimaginea - 博客园 (cnblogs.com)
Just My Code debugging的更多相关文章
- VS Code Just My Code Debugging
VS Code Just My Code Debugging VS Code for C++ doesn't support Just My Code Refer here: Add support ...
- [转]Python in Visual Studio Code
本文转自:https://code.visualstudio.com/docs/languages/python Working with Python in Visual Studio Code, ...
- 转 Debugging AutoCAD 2017 using Visual Studio 2015
原文地址: http://adndevblog.typepad.com/autocad/2016/05/debugging-autocad-2017-using-visual-studio-2015. ...
- 31 Godoc: documenting Go code 编写良好的文档关于godoc
Godoc: documenting Go code 编写良好的文档关于godoc 31 March 2011 The Go project takes documentation seriousl ...
- Windows VS Code 配置 C/C++ 开发环境
准备 Windows [这个相信大家都有 笑: )] VS Code MinGW-w64 C/C++ 安装 MinGw-w64 具体说明细节和安装体验可以在<⑨也懂系列:MinGW-w64安装教 ...
- Visual Studio Debug only user code with Just My Code
Debug only user code with Just My Code By default, the debugger skips over non-user code (if you wan ...
- P/Invoke:C#调用C++
P/Invoke的全称是Platform Invoke (平台调用) 它实际上是一种函数调用机制通 过P/Invoke我们就可以调用非托管DLL中的函数. P/Invoke依次执行以下操作: 1. 查 ...
- 那些年黑了你的微软BUG
本文为 Dennis Gao 原创技术文章,发表于博客园博客,未经作者本人允许禁止任何形式的转载. 前言 炎炎夏日,朗朗乾坤,30℃ 的北京,你还在 Coding 吗? 整个 7 月都在忙项目,还加了 ...
- 170多个Ionic Framework学习资源(转载)
在Ionic官网找到的学习资源:http://blog.ionic.io/learning-ionic-in-your-living-room/ 网上的文章比较多,但是很多时候我们很难找到自己需要的. ...
随机推荐
- Python__requests模块的基本使用
1 - 安装和导入 pip install requests import requests 2 - requsts的请求方法 requests.get('https://www.baidu.com/ ...
- noip模拟43
A. 第一题 儿子遍历顺序按深度由小到大即可 B. 第二题 二分最小值,以点权作为初始距离跑最长路即可 直接用大根堆跑 \(dij\) 会 \(T\),考虑初始权值可以处理,且边权一定,用类似蚯蚓的方 ...
- Vs code自动生成Doxygen格式注释
前言 程序中注释的规范和统一性的重要性不言而喻,本文就推荐一种在用vscode编写代码时自动化生成标准化注释格式的方法,关于Doxygen规范及其使用可查看博文 代码注释规范之Doxygen. ...
- Intel® QAT加速卡之逻辑实例
Intel QAT加速卡逻辑实例 1. QAT相关的名词组织关系 在本手册中描述的平台上,处理器可以连接到一个或多个英特尔通信芯片组8925至8955系列(PCH)设备. 从软件角度来看,每个PCH设 ...
- Openswan支持的算法及参数信息:
数据封装加密算法: algorithm ESP encrypt: id=2, name=ESP_DES, ivlen=8, keysizemin=64, keysizemax=64 algorithm ...
- Element NavMenu动态生成导航菜单
为了演示方便,不从数据库获取了 { "data":[ { "id":125, " ...
- 如何在线安全清理mysql慢日志
部门mysql数据库的服务器磁盘空间快满了,查看了下磁盘的慢日志,发现占了50多个g,百度了资料后删除成功,现在和大家分享下我清理的过程,或许有更好的办法. 1.首先连接进入mysql,查看慢日志的状 ...
- UI自动化测试:App的Webview页面元素左滑
一.前言 在做App自动化测试时,我们会遇到如上图所示的列表数据页面左滑删除场景,一般可以通过location.rect方法获取对应列表的元素坐标,然后使用TouchAction或者swipe滑动 ...
- 对Java的annotation(注解)的认识
什么是java的annotation(注解) ? 注解的定义(annootation): public @interface TestAnnotation { } 上面的这种形式,便定义了注解是如何定 ...
- ESP8266- 使用AT指令获取网络时间
前言:很早就考虑过用 ESP8266 获取网络时间,以前都是用 ESP8266 刷机智云的 Gagent 固件,但无奈现在手头的 ESP-01 的 Flash 只有 1M,实在无法胜任.经过在网络上的 ...