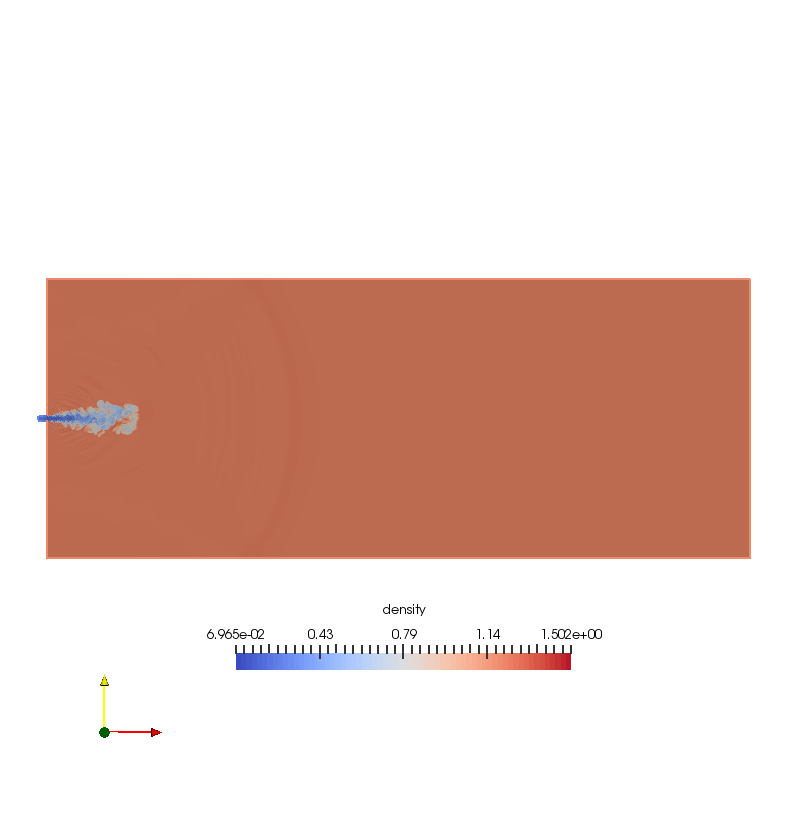
save density, pressure, velocity, temperature contour at one slice in xy plane-- paraview with batch Python scripts
#### import the simple module from the paraview
from paraview.simple import *
#### disable automatic camera reset on 'Show'
paraview.simple._DisableFirstRenderCameraReset()
# create a new 'EnSight Reader' and assign it to a variable, 'transientcase'
transientcase = EnSightReader(CaseFileName='/home/kaiming/Documents/ZJU_Projects/Jet/data/transient.case')
transientcase.PointArrays = ['v', 'density', 'pressure', 'temperature']
# get active view
renderView1 = GetActiveViewOrCreate('RenderView')
# uncomment following to set a specific view size
# renderView1.ViewSize = [788, 837]
# get color transfer function/color map for 'density'
densityLUT = GetColorTransferFunction('density')
# show data in view
transientcaseDisplay = Show(transientcase, renderView1)
# trace defaults for the display properties.
transientcaseDisplay.ColorArrayName = ['POINTS', 'density']
transientcaseDisplay.LookupTable = densityLUT
transientcaseDisplay.GlyphType = 'Arrow'
transientcaseDisplay.ScalarOpacityUnitDistance = 0.0016420380639339577
# reset view to fit data
renderView1.ResetCamera()
# show color bar/color legend
transientcaseDisplay.SetScalarBarVisibility(renderView1, False)
# get opacity transfer function/opacity map for 'density'
densityPWF = GetOpacityTransferFunction('density')
# reset view to fit data
renderView1.ResetCamera()
#################
## slice
################
# create a new 'Slice'
slice1 = Slice(Input=transientcase)
slice1.SliceType = 'Plane'
slice1.SliceOffsetValues = [0.0]
# init the 'Plane' selected for 'SliceType'
slice1.SliceType.Origin = [-0.21849990739250558, 0.0, 0.0]
# Properties modified on slice1.SliceType
slice1.SliceType.Origin = [0.0, 0.0, 0.0]
slice1.SliceType.Normal = [0.0, 0.0, 1.0]
# show data in view
slice1Display = Show(slice1, renderView1)
# trace defaults for the display properties.
slice1Display.ColorArrayName = ['POINTS', 'density']
slice1Display.LookupTable = densityLUT
slice1Display.GlyphType = 'Arrow'
# hide data in view
Hide(transientcase, renderView1)
# show color bar/color legend
slice1Display.SetScalarBarVisibility(renderView1, True)
# set active source
SetActiveSource(transientcase)
# reset view to fit data
renderView1.ResetCamera()
# current camera placement for renderView1
renderView1.CameraPosition = [-0.21849990739250558, 0.0, 0.9599974287600782]
renderView1.CameraFocalPoint = [-0.21849990739250558, 0.0, 0.0]
renderView1.CameraParallelScale = 0.2494169143257604
# *****************
# change legend layout, and its font color, position
# *****************
# get color legend for 'densityLUT' in view 'renderView1'
densityLUTColorBar = GetScalarBar(densityLUT, renderView1)
# Properties modified on densityLUTColorBar
densityLUTColorBar.AutoOrient = 0
## legend orientation
densityLUTColorBar.Orientation = 'Horizontal'
## legend normalized position
densityLUTColorBar.Position = [0.3, 0.2]
# change label color to 'black'
densityLUTColorBar.LabelColor = [0.0, 0.0, 0.0]
# change titile color to 'black'
densityLUTColorBar.TitleColor = [0.0, 0.0, 0.0]
# ***************
# set Background color as 'White'
renderView1.Background =[1,1,1]
# get layout
viewLayout1 = GetLayout()
# save screenshot
SaveScreenshot('/home/kaiming/Documents/ZJU_Projects/Jet/paraview/d_63.png', layout=viewLayout1, magnification=1, quality=100)
#################
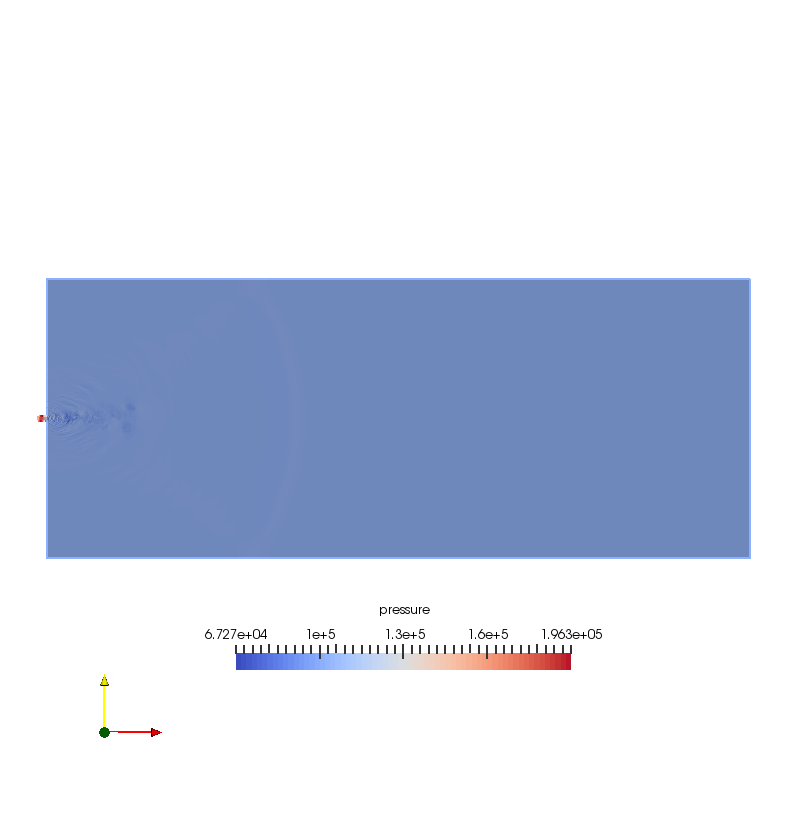
# pressure contour
##################
# show color bar/color legend
slice1Display.SetScalarBarVisibility(renderView1, False)
# set active source
SetActiveSource(slice1)
# set scalar coloring
ColorBy(slice1Display, ('POINTS', 'pressure'))
# rescale color and/or opacity maps used to include current data range
slice1Display.RescaleTransferFunctionToDataRange(True)
# show color bar/color legend
slice1Display.SetScalarBarVisibility(renderView1, True)
# get color transfer function/color map for 'pressure'
pressureLUT = GetColorTransferFunction('pressure')
# get opacity transfer function/opacity map for 'pressure'
pressurePWF = GetOpacityTransferFunction('pressure')
# set active source
SetActiveSource(transientcase)
# *****************
# change legend layout, and its font color, position
# *****************
# get color legend for 'densityLUT' in view 'renderView1'
pressureLUTColorBar = GetScalarBar(pressureLUT, renderView1)
# Properties modified on vLUTColorBar
pressureLUTColorBar.AutoOrient = 0
## legend orientation
pressureLUTColorBar.Orientation = 'Horizontal'
## legend normalized position
pressureLUTColorBar.Position = [0.3, 0.2]
# change label color to 'black'
pressureLUTColorBar.LabelColor = [0.0, 0.0, 0.0]
# change titile color to 'black'
pressureLUTColorBar.TitleColor = [0.0, 0.0, 0.0]
# ***************
# current camera placement for renderView1
renderView1.CameraPosition = [-0.21849990739250558, 0.0, 0.9599974287600782]
renderView1.CameraFocalPoint = [-0.21849990739250558, 0.0, 0.0]
renderView1.CameraParallelScale = 0.2494169143257604
# save screenshot
SaveScreenshot('/home/kaiming/Documents/ZJU_Projects/Jet/paraview/p_63.png', layout=viewLayout1, magnification=1, quality=100)
######################
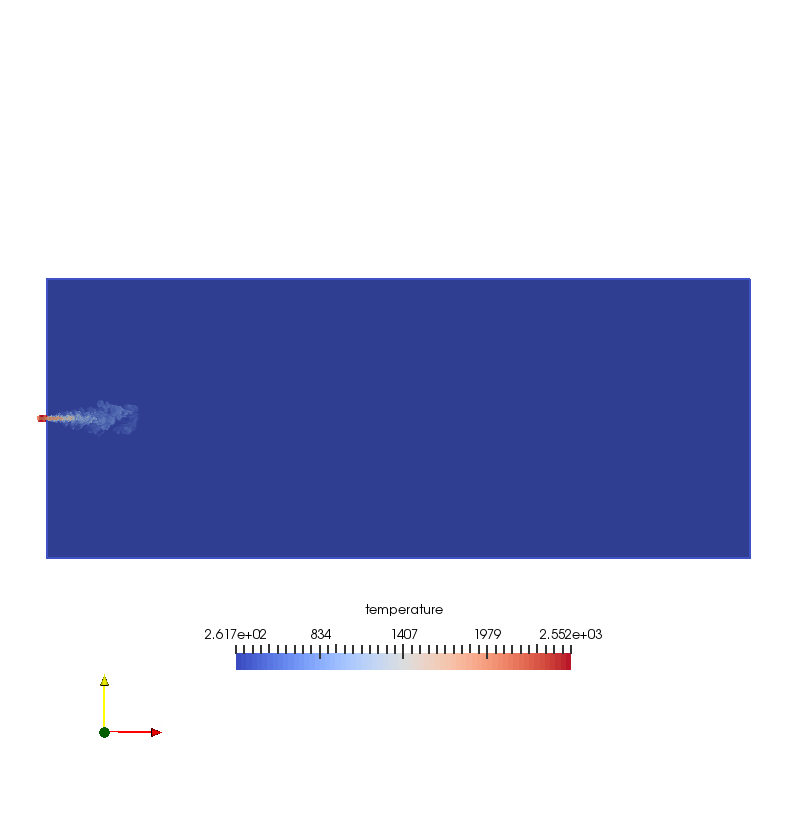
# #temperature contour
######################
# show color bar/color legend
slice1Display.SetScalarBarVisibility(renderView1, False)
# set active source
SetActiveSource(slice1)
# set scalar coloring
ColorBy(slice1Display, ('POINTS', 'temperature'))
# rescale color and/or opacity maps used to include current data range
slice1Display.RescaleTransferFunctionToDataRange(True)
# show color bar/color legend
slice1Display.SetScalarBarVisibility(renderView1, True)
# get color transfer function (color map) for 'temperature'
temperatureLUT = GetColorTransferFunction('temperature')
# get opacity transfer function/opacity map for 'temperature'
temperaturePWF = GetOpacityTransferFunction('temperature')
# ******
# legend layout, and its font color, position
# *****
temperatureLUTColorBar = GetScalarBar(temperatureLUT, renderView1)
# Properties modified on vLUTColorBar
temperatureLUTColorBar.AutoOrient = 0
## legend orientation
temperatureLUTColorBar.Orientation = 'Horizontal'
## legend normalized position
temperatureLUTColorBar.Position = [0.3, 0.2]
# label color to 'black'
temperatureLUTColorBar.LabelColor = [0.0, 0.0, 0.0]
# change 'titile' color to 'black'
temperatureLUTColorBar.TitleColor = [0.0, 0.0, 0.0]
# *****************
# set active source
SetActiveSource(transientcase)
# current camera placement for renderView1
renderView1.CameraPosition = [-0.21849990739250558, 0.0, 0.9599974287600782]
renderView1.CameraFocalPoint = [-0.21849990739250558, 0.0, 0.0]
renderView1.CameraParallelScale = 0.2494169143257604
# save screenshot
SaveScreenshot('/home/kaiming/Documents/ZJU_Projects/Jet/paraview/t_63.png', layout=viewLayout1, magnification=1, quality=100)
# *****************
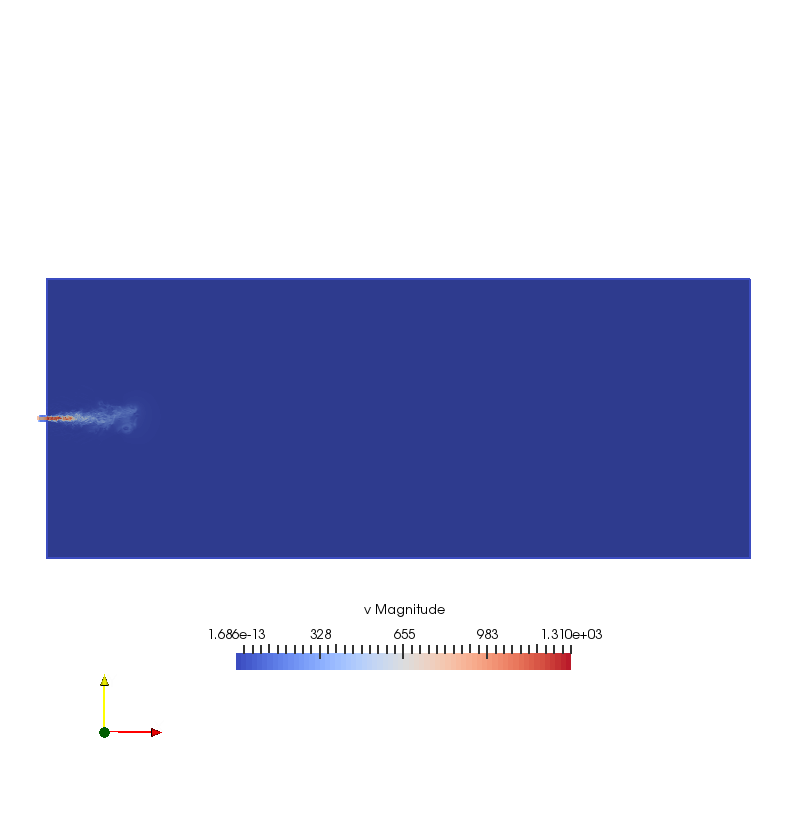
# velocity
# ****************
# show color bar/color legend
slice1Display.SetScalarBarVisibility(renderView1, False)
# set active source
SetActiveSource(slice1)
# set scalar coloring
ColorBy(slice1Display, ('POINTS', 'v'))
# rescale color and/or opacity maps used to include current data range
slice1Display.RescaleTransferFunctionToDataRange(True)
# show color bar/color legend
slice1Display.SetScalarBarVisibility(renderView1, True)
# get color transfer function/color map for 'v'
vLUT = GetColorTransferFunction('v')
# get opacity transfer function/opacity map for 'v'
vPWF = GetOpacityTransferFunction('v')
# *****************
# change legend layout, and its font color, position
# *****************
# get color legend for 'densityLUT' in view 'renderView1'
vLUTColorBar = GetScalarBar(vLUT, renderView1)
# Properties modified on vLUTColorBar
vLUTColorBar.AutoOrient = 0
## legend orientation
vLUTColorBar.Orientation = 'Horizontal'
## legend normalized position
vLUTColorBar.Position = [0.3, 0.2]
# change label color to 'black'
vLUTColorBar.LabelColor = [0.0, 0.0, 0.0]
# change titile color to 'black'
vLUTColorBar.TitleColor = [0.0, 0.0, 0.0]
# ***************
# set active source
SetActiveSource(transientcase)
# current camera placement for renderView1
renderView1.CameraPosition = [-0.21849990739250558, 0.0, 0.9599974287600782]
renderView1.CameraFocalPoint = [-0.21849990739250558, 0.0, 0.0]
renderView1.CameraParallelScale = 0.2494169143257604
# save screenshot
SaveScreenshot('/home/kaiming/Documents/ZJU_Projects/Jet/paraview/v_63.png', layout=viewLayout1, magnification=1, quality=100)
#### saving camera placements for all active views
# current camera placement for renderView1
renderView1.CameraPosition = [-0.21849990739250558, 0.0, 0.9599974287600782]
renderView1.CameraFocalPoint = [-0.21849990739250558, 0.0, 0.0]
renderView1.CameraParallelScale = 0.2494169143257604
#### uncomment the following to render all views
# RenderAllViews()
# alternatively, if you want to write images, you can use SaveScreenshot(...).
save density, pressure, velocity, temperature contour at one slice in xy plane-- paraview with batch Python scripts的更多相关文章
- 分享JQuery动画插件Velocity.js的六种列表加载特效
分享JQuery动画插件Velocity.js的六种列表加载特效.在这款实例中给中六种不同的列表加载效果.分别为从上飞入.从右侧飞入.从左侧飞入.和渐显.一起看下效果图: 在线预览 源码下载 实现 ...
- post processing in CFD
post post Table of Contents 1. Post-processing 1.1. Reverse flow 1.1.1. reasons 1.1.2. solutions 1.2 ...
- jet flow in a combustion chamber
Table of Contents 1. contacts 2. Paper digest 2.1. LES vs. RANS 2.2. Dynamics of Transient Fuel Inje ...
- saving snaps iteratively with for loop in Paraview
Goal: read data 1 and slice, then save pressure, velocity contours, close data, then do loop for the ...
- hbot固件配置
又入了一台打印机,171到手,本来之前有更好的,无奈别人下手太快,只剩这台了. 175x135x180的样子. 创客的板,还带16g的闪迪内存卡,看到那会儿感觉赚大了! 拿到的时候不少螺丝松的,有的打 ...
- Fast-tracking approach for building routing topologies in fast-moving networks
In one embodiment, a local node in a communication network determines a set of its neighbor nodes, a ...
- Usage of hdf2v3 and hdf2file
备注 修改Filetype,再执行hdf2file或hdf2tab,可以输出不同类型的数据.把Filetype设置成8,就是 Tecplot 格式的数据. <!DOCTYPE html PUBL ...
- Python演讲笔记1
参考: 1. The Clean Architecture in Python (Brandon Rhodes) 2. Python Best Practice Patterns (Vladimir ...
- Disposable microfluidic devices: fabrication, function, and application Gina S. Fiorini and Daniel T
Disposable microfluidic devices: fabrication, function, and application Gina S. Fiorini and Daniel T ...
随机推荐
- 洛谷 P1969 积木大赛 —— 水题
题目:https://www.luogu.org/problemnew/show/P1969 看每个高度和前面的关系即可. 代码如下: #include<iostream> #includ ...
- Python实现用户交互,显示省市县三级联动的选择
题目:Python实现用户交互,显示省市县三级联动的选择 定义的字典为: dic = { "江西": { "萍乡": ["安源", &quo ...
- 打开mat文件
点击file目录,选择import data 然后选择所需.mat文件,就可以打开了
- python orm / 表与model相互转换
orm英文全称object relational mapping,就是对象映射关系程序,简单来说我们类似python这种面向对象的程序来说一切皆对象,但是我们使用的数据库却都是关系型的,为了保证一致的 ...
- Shape Drawable Resources
1,示例 它们的代码如下: shape_oval.xml <?xml version="1.0" encoding="utf-8"?> <sh ...
- 转 Shell调试篇
检查语法 -n选项只做语法检查,而不执行脚本. sh -n script_name.sh 启动调试 sh -x script_name.sh 进入调试模式后,Shell依次执行读入的语句,产生的输出中 ...
- LN : leetcode 258 Add Digits
lc 258 Add Digits lc 258 Add Digits Given a non-negative integer num, repeatedly add all its digits ...
- Position属性四个值:static、fixed、absolute和relative的区别
1.static(静态定位):默认值.没有定位,元素出现在正常的流中(忽略 top, bottom, left, right 或者 z-index 声明). 2.relative(相对定位):生成相对 ...
- npm install的时候报错 npm err code 1
在学习vue的时候,npm install的时候报错 npm err code 1,当时很郁闷,是‘vue init webpack my-project’命令新建的模版项目 ,怎么会报错,第一次遇 ...
- 微信小程序组件解读和分析:四、icon图标
icon图标组件说明: icon是一种图标格式,用于系统图标.软件图标等,这种图标扩展名为.icon..ico.常见的软件或windows桌面上的那些图标一般都是ICON格式的.在应用上面很多地方 ...