MiniProfiler性能分析工具— .Net Core中用法
前言:
在日常开发中,应用程序的性能是我们需要关注的一个重点问题。当然我们有很多工具来分析程序性能:如:Zipkin等;但这些过于复杂,需要单独搭建。
MiniProfiler就是一款简单,但功能强大的应用新能分析工具;可以帮助我们定位:SQL性能问题、响应慢等问题。
本篇文章将介绍MiniProfiler在Asp.Net Core中如何使用
一、MiniProfiler介绍
MiniProfiler是一款针对.NET, Ruby, Go and Node.js的性能分析的轻量级程序。可以对一个页面本身,及该页面通过直接引用、Ajax、Iframe形式访问的其它页面进行监控,监控内容包括数据库内容,并可以显示数据库访问的SQL(支持EF、EF CodeFirst等 )。并且以很友好的方式展现在页面上。
MiniProfiler官网:http://miniprofiler.com/
MiniProfiler的一个特别有用的功能是它与数据库框架的集成。除了.NET原生的 DbConnection类,MiniProfiler还内置了对实体框架(Entity Framework)以及LINQ to SQL、RavenDb和MongoDB的支持。任何执行的Step都会包括当时查询的次数和所花费的时间。为了检测常见的错误,如N+1反模式,profiler将检测仅有参数值存在差异的多个查询。
二、MiniProfiler用法
1、Nuget包安装:
//Mvc

Install-Package MiniProfiler.AspNetCore.Mvc

//EF分析添加

Install-Package MiniProfiler.EntityFrameworkCore
2、配置MiniProfiler:修改Startup.cs
a) 注入MiniProfiler
public void ConfigureServices(IServiceCollection services)

{

    // ...其他配置...

    // 注入MiniProfiler

    services.AddMiniProfiler(options =>

    {

        //访问地址路由根目录;默认为:/mini-profiler-resources

        options.RouteBasePath = "/profiler";

        //数据缓存时间

        (options.Storage as MemoryCacheStorage).CacheDuration = TimeSpan.FromMinutes(60);

        //sql格式化设置

        options.SqlFormatter = new StackExchange.Profiling.SqlFormatters.InlineFormatter();

        //跟踪连接打开关闭

        options.TrackConnectionOpenClose = true;

        //界面主题颜色方案;默认浅色

        options.ColorScheme = StackExchange.Profiling.ColorScheme.Dark;

        //.net core 3.0以上:对MVC过滤器进行分析

        options.EnableMvcFilterProfiling = true;

        //对视图进行分析

        options.EnableMvcViewProfiling = true;

        //控制访问页面授权,默认所有人都能访问

        //options.ResultsAuthorize;

        //要控制分析哪些请求,默认说有请求都分析

        //options.ShouldProfile;

        //内部异常处理

        //options.OnInternalError = e => MyExceptionLogger(e);

    })

    // AddEntityFramework是要监控EntityFrameworkCore生成的SQL

    .AddEntityFramework();

}
b) 启用MiniProfiler
public void Configure(IApplicationBuilder app, IHostingEnvironment env, ILoggerFactory loggerFactory, IMemoryCache cache)

{

    // ...其他配置

    //该方法必须在app.UseEndpoints以前

    app.UseMiniProfiler();

    app.UseEndpoints(routes =>

    {

        // ...

    });

}
c) MVC项目:
修改 _ViewImports.cshtml
@using StackExchange.Profiling

@addTagHelper *, MiniProfiler.AspNetCore.Mvc
将MiniProfiler添加到布局文件(Shared/_Layout.cshtml)中
<mini-profiler />
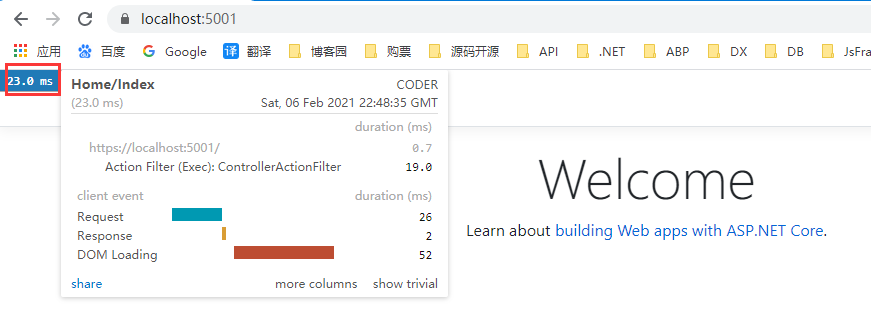
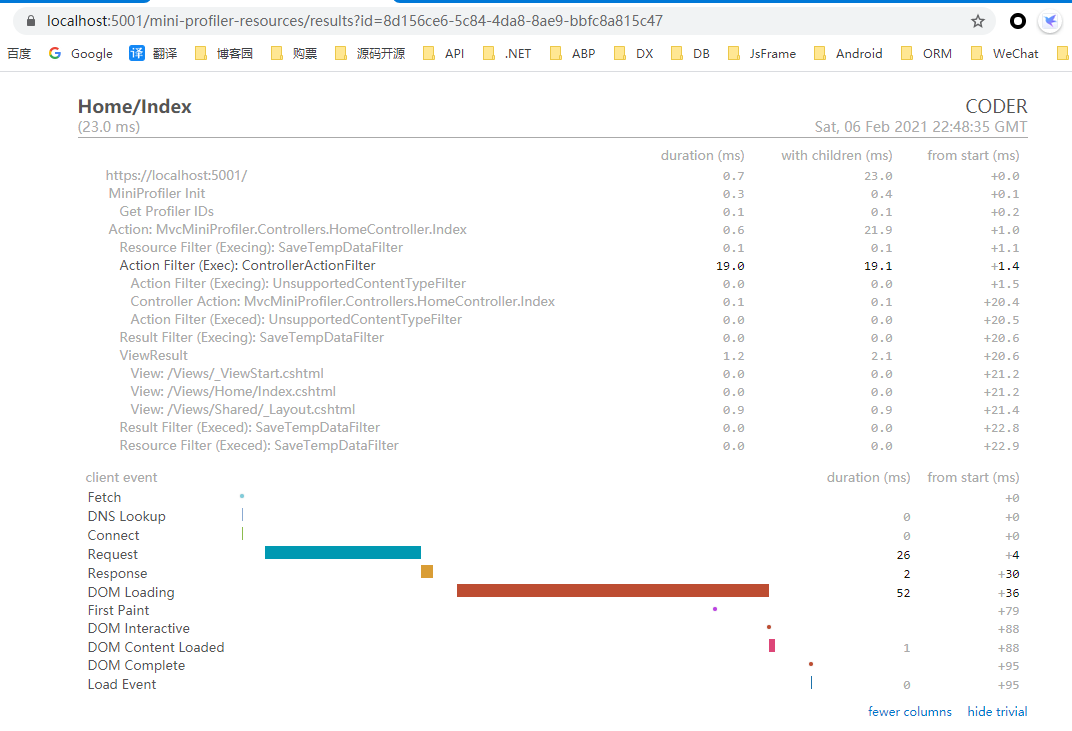
d) 运行效果:
三、 Swagger UI接入MiniProfiler
使用步骤和前面大体一样
1、下载Swagger页面:
请先在Github中下载对应版本的swagger页面:https://github.com/domaindrivendev/Swashbuckle.AspNetCore/blob/master/src/Swashbuckle.AspNetCore.SwaggerUI/index.html
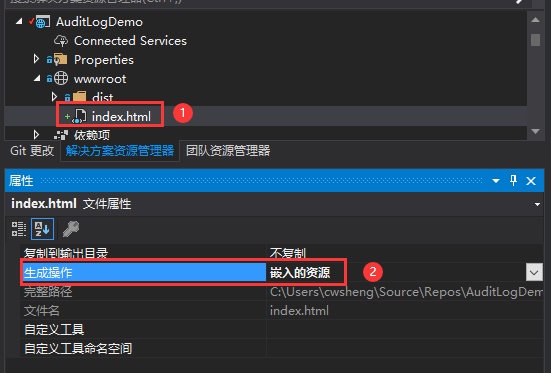
2、添加到项目中,并设置index.html为:内嵌资源
3、修改UseSwaggerUI中间件的配置
app.UseSwaggerUI(c =>

{

    //AuditLogDemo项目命名空间

    c.SwaggerEndpoint("/swagger/v1/swagger.json", "AuditLogDemo API V1");

    c.IndexStream = () => GetType().GetTypeInfo().Assembly.GetManifestResourceStream("AuditLogDemo.wwwroot.index.html");

});
4、获取MiniProfiler的html代码片段
/// <summary>

/// 获取html片段

/// </summary>

/// <returns></returns>

[HttpGet]

[Route("GetHtml")]

public IActionResult GetHtml()

{

    var html = MiniProfiler.Current.RenderIncludes(HttpContext);

    return Ok(html.Value);

}
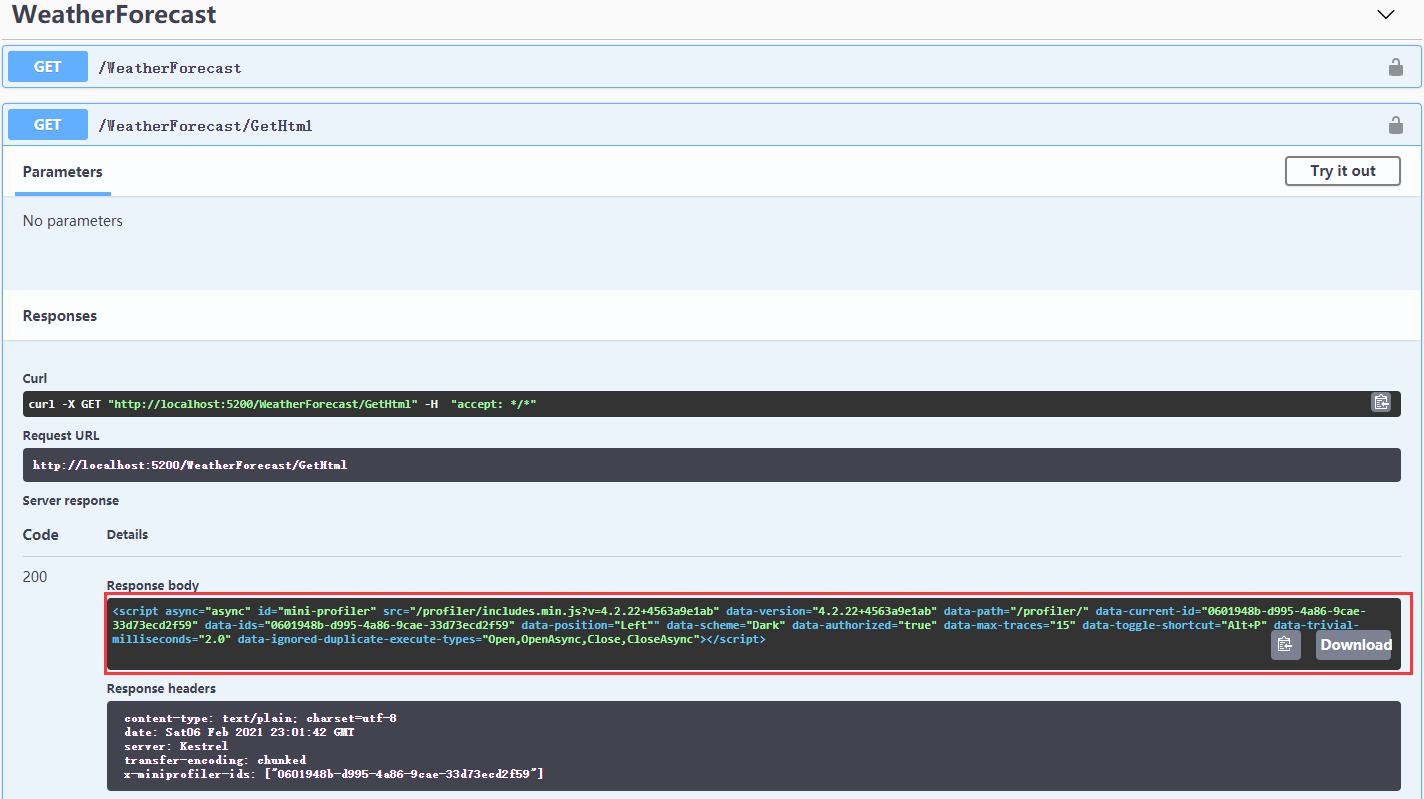
5、在Swagger的Html中添加获取的MiniProfiler片段
<!-- HTML for static distribution bundle build -->

<script async="async" id="mini-profiler" src="/profiler/includes.min.js?v=4.2.22+4563a9e1ab"

        data-version="4.2.22+4563a9e1ab" data-path="/profiler/"

        data-current-id="0601948b-d995-4a86-9cae-33d73ecd2f59"

        data-ids="0601948b-d995-4a86-9cae-33d73ecd2f59"

        data-position="Left"

        data-scheme="Dark"

        data-authorized="true"

        data-max-traces="15"

        data-toggle-shortcut="Alt+P"

        data-trivial-milliseconds="2.0"

        data-ignored-duplicate-execute-types="Open,OpenAsync,Close,CloseAsync"></script>

<!-- HTML for static distribution bundle build -->

<!DOCTYPE html>

<html lang="en">

<head>

    <meta charset="UTF-8">

    <title>%(DocumentTitle)</title>

    ……
6、调用效果:

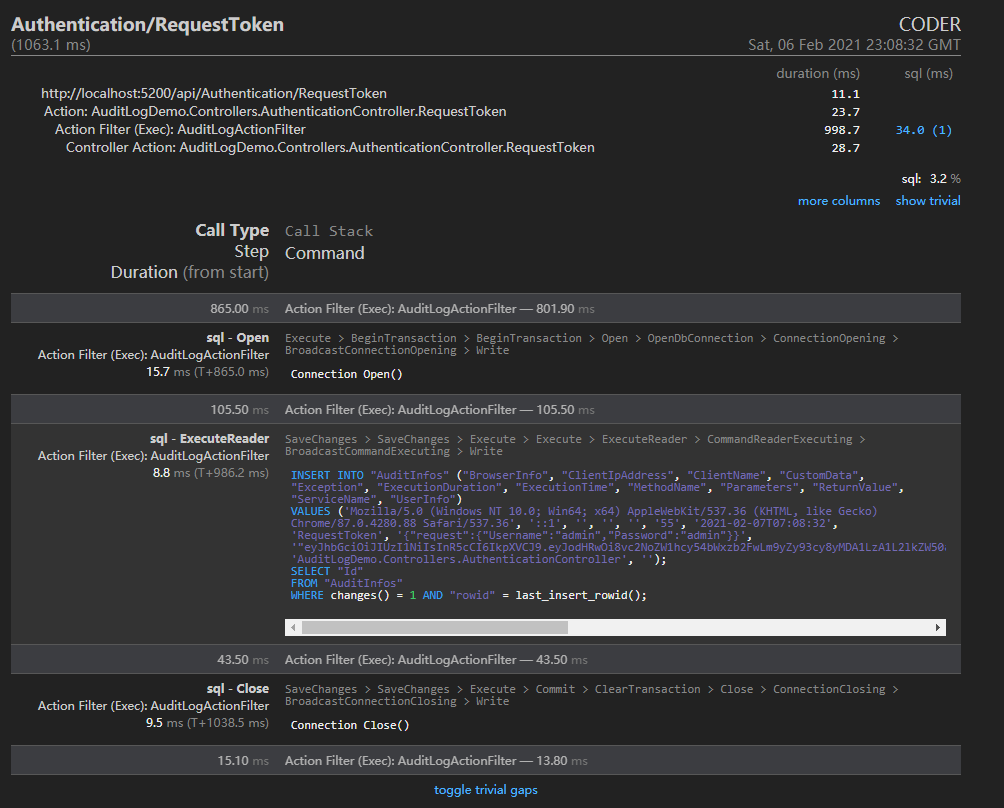
如上图可以查看到所有请求路径及Sql操作耗时,那么如果需要监控指定代码块耗时如何实现呢
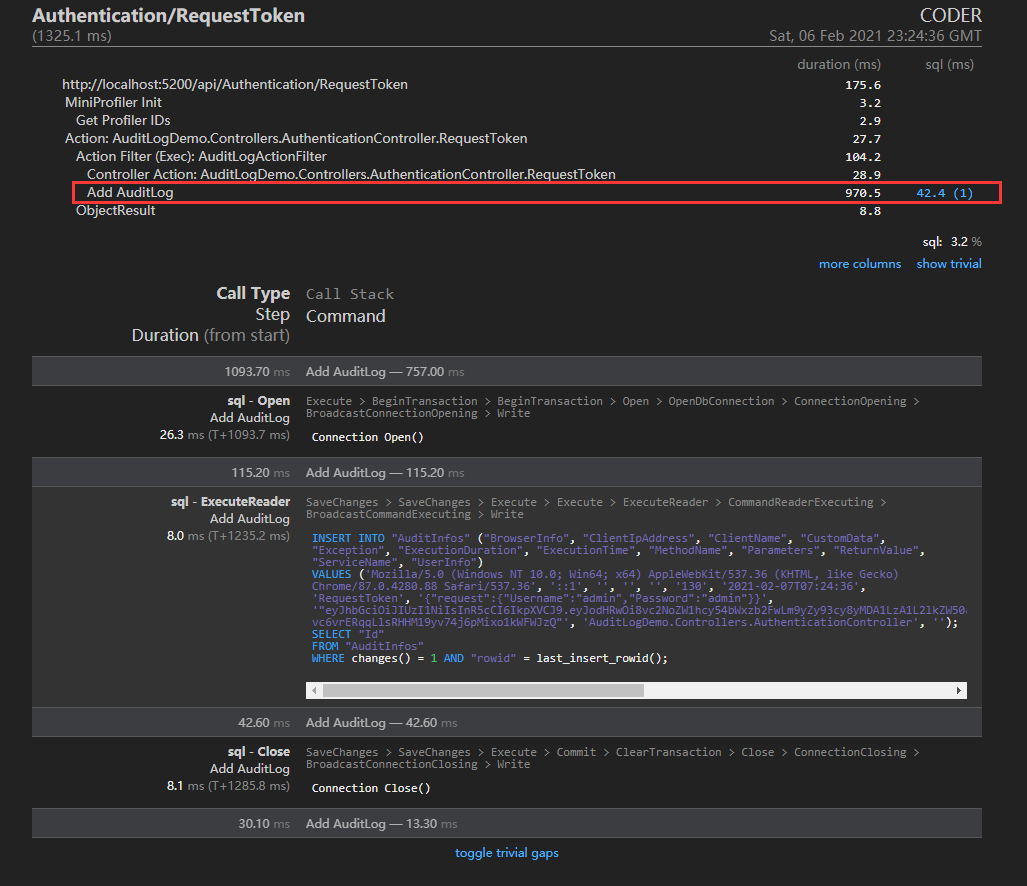
四、自定义标记:
1、添加标记代码:
var miniPro = MiniProfiler.Current;

using (miniPro.Step("Add AuditLog"))

{

    //保存审计日志

    await _auditLogService.SaveAsync(auditInfo);

}
2、取消监控方式:
using(MiniProfiler.Current.Ignore())

{

   //代码

}
3、当然MiniProfiler还有很多其他功能等待解锁:如监控ADO.NET执行耗时,需要使用:ProfileDBConnection 和 ProfileDBCommand对象:
总结:
1、MiniProfiler使用非常简单
2、功能满足日常中程序性能优化相关问题
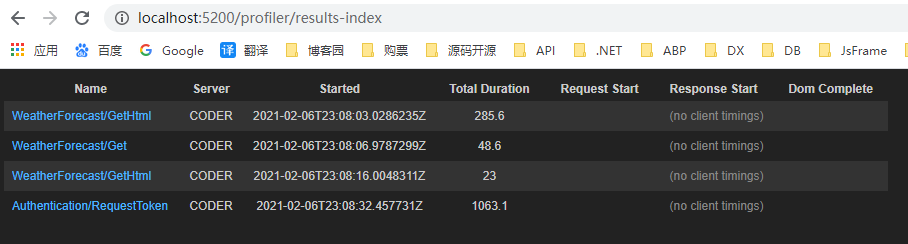
其他:
MiniProfiler的监控列表地址:http://{xxx}/profiler/results-index
MiniProfiler性能分析工具— .Net Core中用法的更多相关文章
- sar命令,linux中最为全面的性能分析工具之一
sar是System Activity Reporter(系统活动情况报告)的缩写.这个工具所需要的负载很小,也是目前linux中最为全面的性能分析工具之一.此款工具将对系统当前的状态就行取样,然后通 ...
- Linux性能分析工具的安装和使用
转自:http://blog.chinaunix.net/uid-26488891-id-3118279.html Normal 0 7.8 磅 0 2 false false false EN-US ...
- 系统级性能分析工具perf的介绍与使用[转]
测试环境:Ubuntu16.04(在VMWare虚拟机使用perf top存在无法显示问题) Kernel:3.13.0-32 系统级性能优化通常包括两个阶段:性能剖析(performance pro ...
- valgrind和Kcachegrind性能分析工具详解
一.valgrind介绍 valgrind是运行在Linux上的一套基于仿真技术的程序调试和分析工具,用于构建动态分析工具的装备性框架.它包括一个工具集,每个工具执行某种类型的调试.分析或类似的任务, ...
- 系统级性能分析工具perf的介绍与使用
测试环境:Ubuntu16.04(在VMWare虚拟机使用perf top存在无法显示问题) Kernel:3.13.0-32 系统级性能优化通常包括两个阶段:性能剖析(performance pro ...
- Linux 性能分析工具汇总合集
出于对Linux操作系统的兴趣,以及对底层知识的强烈欲望,因此整理了这篇文章.本文也可以作为检验基础知识的指标,另外文章涵盖了一个系统的方方面面.如果没有完善的计算机系统知识,网络知识和操作系统知识, ...
- [转]Linux性能分析工具汇总合集
出于对Linux操作系统的兴趣,以及对底层知识的强烈欲望,因此整理了这篇文章.本文也可以作为检验基础知识的指标,另外文章涵盖了一个系统的方方面面.如果没有完善的计算机系统知识,网络知识和操作系统知识, ...
- 超全整理!Linux性能分析工具汇总合集
转自:http://rdc.hundsun.com/portal/article/731.html?ref=myread 出于对Linux操作系统的兴趣,以及对底层知识的强烈欲望,因此整理了这篇文章. ...
- Android 常用的性能分析工具详解:GPU呈现模式, TraceView, Systrace, HirearchyViewer(转)
此篇将重点介绍几种常用的Android性能分析工具: 一.Logcat 日志 选取Tag=ActivityManager,可以粗略地知道界面Displaying的时间消耗.当我们打开一个Activit ...
随机推荐
- Apache的Mod_rewrite学习(RewriteRule重写规则的语法) 转
RewriteRuleSyntax: RewriteRule Pattern Substitution [flags] 一条RewriteRule指令,定义一条重写规则,规则间的顺序非常重要.对Apa ...
- Spring用了哪些设计模式?
设计模式是一套被反复使用的.多数人知晓的.经过分类编目的.代码设计经验的总结.总共有 23 种设计模式 使用设计模式是为了重用代码.让代码更容易被他人理解.保证代码可靠性. Spring用了哪些设计模 ...
- LeetCode876 链表的中间结点
给定一个带有头结点 head 的非空单链表,返回链表的中间结点. 如果有两个中间结点,则返回第二个中间结点. 示例 1: 输入:[1,2,3,4,5] 输出:此列表中的结点 3 (序列化形式:[3,4 ...
- Nginx安装步骤及本地浏览器不通解决方案,Nginx在Linux发布项目,Tomcat 与本地浏览器不通解决方案
Nginx安装步骤及本地浏览器不通解决方案 1.将安装包放到usr/local文件夹下 2..进入local目录,解压 tar -zxvf nginx-1.17.5.tar.gz 3.进入 nginx ...
- (一)React Ant Design Pro + .Net5 WebApi:先搞定服务器,顺手装个Nginx
腾讯云搞定服务器,具体过程就不赘述了,文档都有,咨询客服或者自行百度,体验一下过程. 一. 服务器 1. 云服务器 cvm 1核2G centos8.0 2. 域名注册 www.homejok.com ...
- 【ORA】ORA-00030: User session ID does not exist.
今天巡检,查询锁相关的情况的时候,确认业务后,准备将锁干掉,但是干掉的时候报了一个错误,ORA-00030 发现回话不存在,我以为pmon进程已经将锁进程kill掉了,就再次查看,发现,还是存在 这个 ...
- 【Oracle】查询锁的相关SQL
--查看有锁的进程 select t2.username,t2.sid,t2.serial#,t2.logon_time,t2.state from v$locked_object t1,v$sess ...
- LeetCode993. 二叉树的堂兄弟节点
题目 1 class Solution { 2 public: 3 TreeNode* r1;TreeNode* r2; 4 bool isCousins(TreeNode* root, int x, ...
- service自动发现,yaml文件管理内外部端口访问
service服务发现 [root@k8s-master ~]# vim busybox-5d4f595646-dzjv4.yaml apiVersion: v1 kind: Pod metadata ...
- JavaSE 基础知识(常识概念 + 基础语法)问答总结/面试题 —— 讲给应届生的 Java 开源知识项目
写在最前面 这个项目是从20年末就立好的 flag,经过几年的学习,回过头再去看很多知识点又有新的理解.所以趁着找实习的准备,结合以前的学习储备,创建一个主要针对应届生和初学者的 Java 开源知识项 ...