[转帖]Alertmanager 部署配置
https://www.cnblogs.com/winstom/p/11940570.html
前言
Alertmanager 用于发送告警, 是真正发送信息给用户的模块。
Alertmanager 会接受Prometheus发送过来的警告信息,再由Alertmanager来发送。
- Grouping—分组
    防止告警风暴,达到告警收敛目的

    设置时间段,对接收到的同类告警只发送一条

    系统出问题同类告警只发送一条

    配置文件配置
- Inhibition—抑制
防止告警风暴,达到告警收敛目的

同一时间内,对准备发送的告警事件的相关性,决定只发送一条

若A发送C不可达已经准备发送时,可配置其他关于C不可达事件不发送

配置文件配置
- Silences—沉默
临时屏蔽,设置某个时间段内某类告警不发送

web界面配置
- Client behavior—客户端
POST方法,两个接口v1、v2
 [{

    "labels": {

      "alertname": "<requiredAlertName>",

      "<labelname>": "<labelvalue>",

      ...

    },

    "annotations": {

      "<labelname>": "<labelvalue>",

    },

    "startsAt": "<rfc3339>",

    "endsAt": "<rfc3339>",

    "generatorURL": "<generator_url>"

  },

  ...

]
关键key说明
labels:代表一个告警事件,用去去重

annotations:不代表一条告警,用于完善告警详情

startAt:默认是接收告警事件的当前时间

endsAt:默认设置为可配置的超时时间,告警事件解决的时间

generatorURL:代表发送告警事件的客户端
源码安装
[root@es2 ~]# tar xf alertmanager-0.19.0.linux-amd64.tar.gz

[root@es2 ~]# mv alertmanager-0.19.0.linux-amd64 /opt/alertmanager-0.19

[root@es2 ~]# cd /opt/alertmanager-0.19/

[root@es2 alertmanager-0.19]# mkdir bin  config  data logs

[root@es2 alertmanager-0.19]# mv alertmanager  amtool bin/

[root@es2 alertmanager-0.19]# mv alertmanager.yml config/

[root@es2 alertmanager-0.19]# cp config/alertmanager.yml config/alertmanager.yml.default
配置
修改 /opt/alertmanager-0.19/config/alertmanager.yml
[root@es2 config]# cat alertmanager.yml

global:

  smtp_smarthost: 'smtp.exmail.qq.com:25'       # smtp地址

  smtp_from: 'sijy@jubaozhu.com'                # 谁发邮件

  smtp_auth_username: 'sijy@jubaozhu.com'       # 邮箱用户

  smtp_auth_password: 'xxxxx'                   # 邮箱密码

  smtp_require_tls: false

route:

  group_by: ["instance"]            # 分组名

  group_wait: 30s                   # 当收到告警的时候,等待三十秒看是否还有告警,如果有就一起发出去

  group_interval: 5m                # 发送警告间隔时间

  repeat_interval: 3h               # 重复报警的间隔时间

  receiver: mail                    # 全局报警组,这个参数是必选的,和下面报警组名要相同

receivers:

- name: 'mail'                      # 报警组名

  email_configs:

  - to: 'sijiayong000@163.com'      # 发送给谁
启动
nohup /opt/alertmanager-0.19/bin/alertmanager --log.level=info --log.format=json --web.listen-address="10.0.20.12:9093" --config.file="/opt/alertmanager-0.19/config/alertmanager.yml" --storage.path="/opt/alertmanager-0.19/data/" --data.retention=120h &>>/opt/alertmanager-0.19/logs/alertmanager.log &
--log.level日志级别--log.format日志输出格式--web.listen-addres监听地址端口--config.file配置配置文件--storage.path配置数据保存目录--data.retention配置数据保留时间
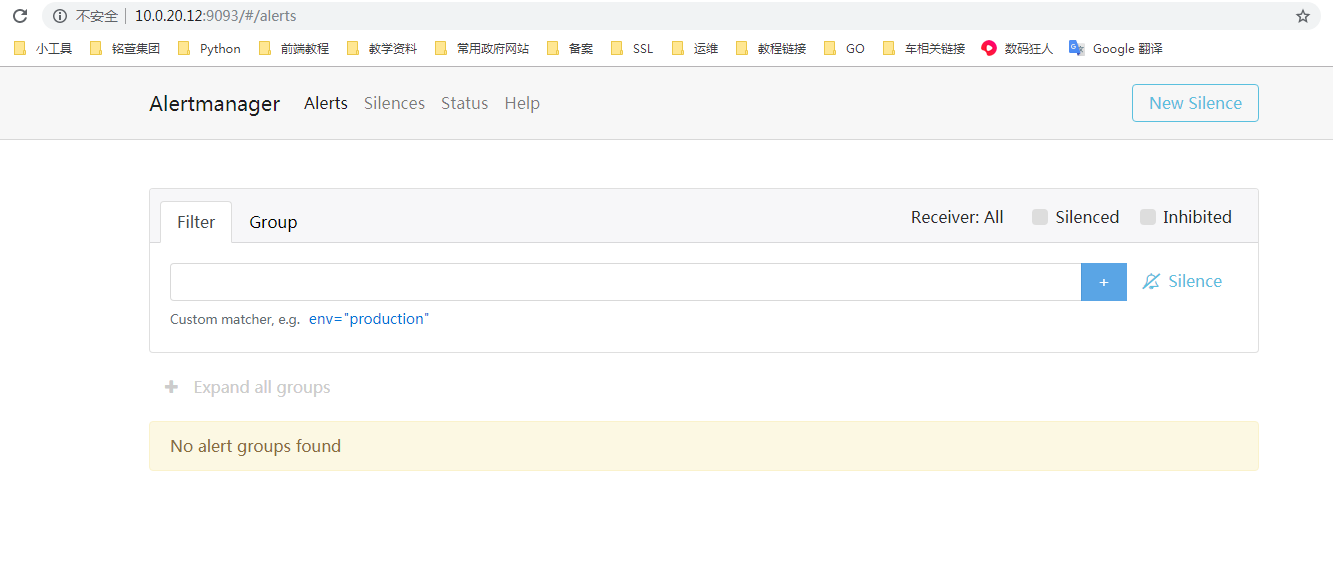
启动后即可访问页面
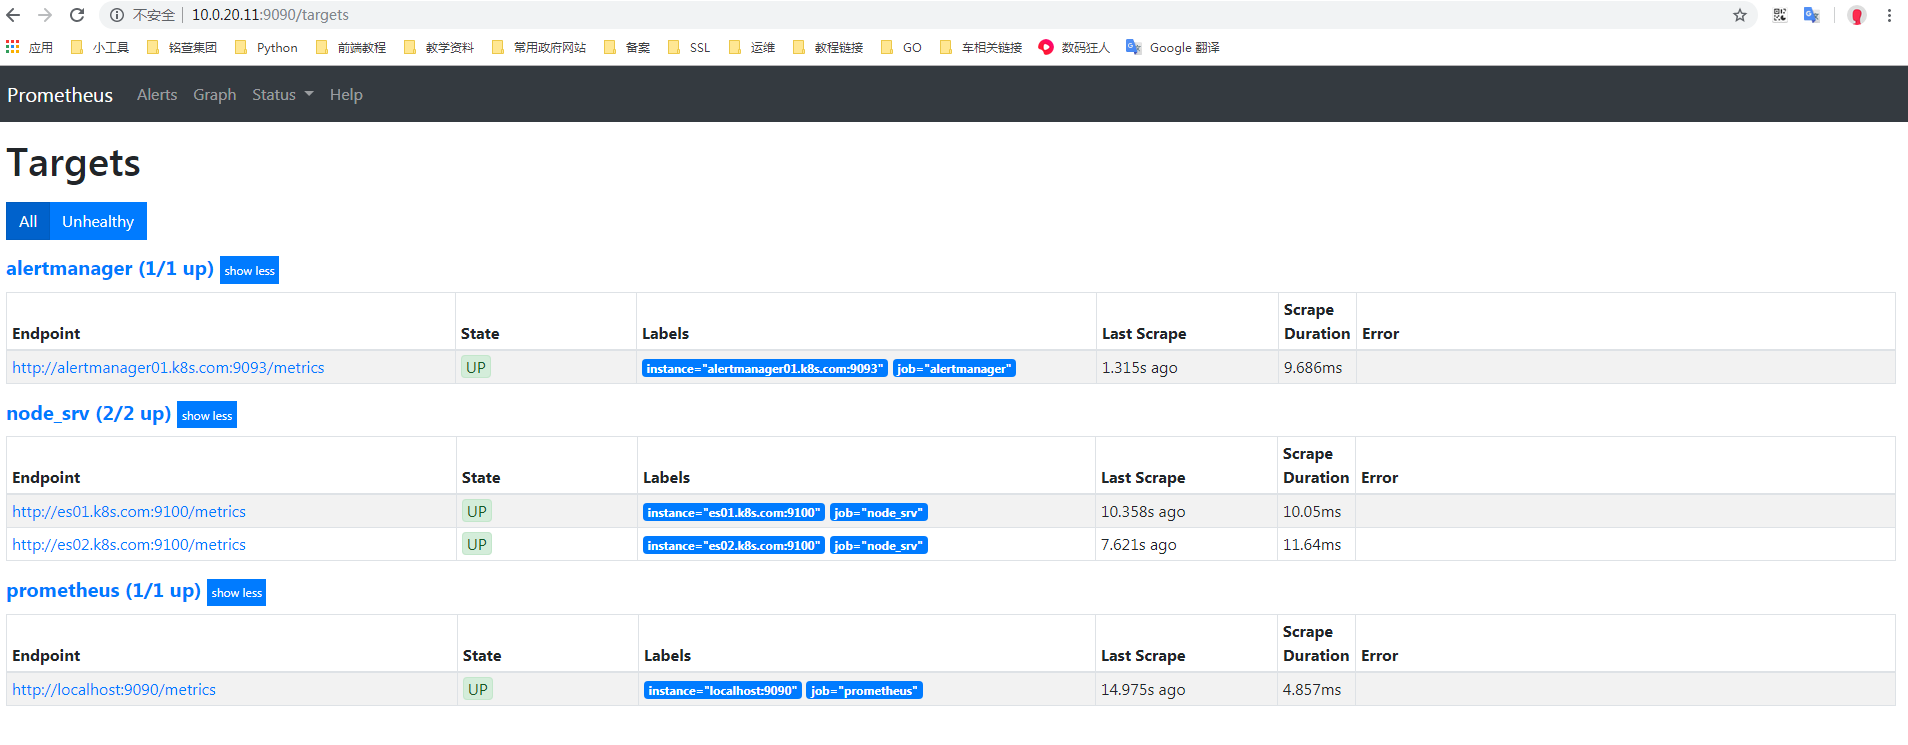
配置prometheus监控Alertmanager
因为后面会部署alertmanager集群,所以这里使用SRV解析的自动发现
修改prometheus配置
[root@es01 config]# cat prometheus.yml

global:

  scrape_interval:     15s

  evaluation_interval: 15s

alerting:

  alertmanagers:

    - dns_sd_configs:               # 同样配置DNS自动发现

      - names: ["_alertmanager._tcp_k8s.com."]  # 加入SRV解析的自动发现

rule_files:

scrape_configs:

  - job_name: 'prometheus'

    static_configs:

    - targets: ['localhost:9090']

  - job_name: 'node_srv'

    metrics_path: "/metrics"

    dns_sd_configs:

    - names: ['_prometheus._tcp.k8s.com']

  - job_name: 'alertmanager'

    metrics_path: "/metrics"

    dns_sd_configs:

    - names: ['_alertmanager._tcp.k8s.com']
上面配置好后,在DNS上做好对应的SRV解析接口。
重新加载配置文件
检查配置文件,并重新加载
# 检查配置文件

[root@es01 config]# /opt/prometheus-2.14/bin/promtool check config /opt/prometheus-2.14/config/prometheus.yml

Checking /opt/prometheus-2.14/config/prometheus.yml

  SUCCESS: 0 rule files found

# 重新加载配置文件

[root@es01 config]# curl -X POST httP://10.0.20.11:9090/-/reload

[root@es01 config]#
配置测试告警
修改prometheus配置
定义报警规则,把这些规则写入到 rule_files: 配置下面
[root@es01 config]# cat prometheus.yml

global:

  scrape_interval:     15s

  evaluation_interval: 15s

alerting:

  alertmanagers:

    - dns_sd_configs:

      - names: ["_alertmanager._tcp.k8s.com"]

rule_files:

   - "rules/node_alerts.yml"    # 这里支持通配符,如 *.yml

   - "rules/node_rules.yml"     # 这个同样也是,表示自定义永久固定查询值

scrape_configs:

  - job_name: 'prometheus'

    static_configs:

    - targets: ['localhost:9090']

  - job_name: 'node_srv'

    metrics_path: "/metrics"

    dns_sd_configs:

    - names: ['_prometheus._tcp.k8s.com']

  - job_name: 'alertmanager'

    metrics_path: "/metrics"

    dns_sd_configs:

    - names: ['_alertmanager._tcp.k8s.com']
然后创建对应的目录和具体规则文件
[root@es01 config]# mkdir rules
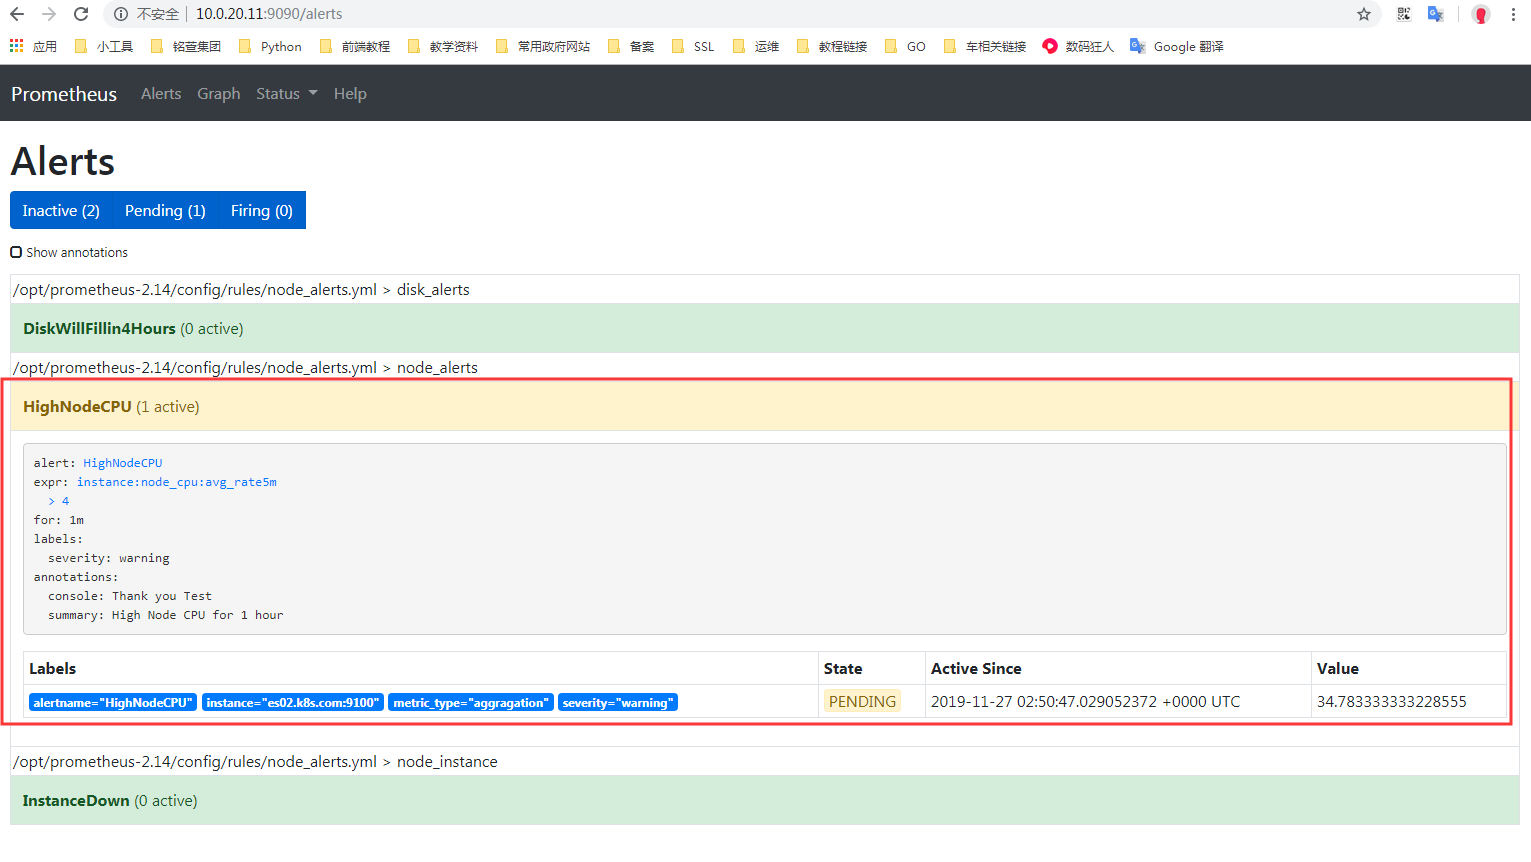
[root@es01 config]# cat rules/node_alerts.yml
groups:
- name: node_alerts # 规则名称
rules:
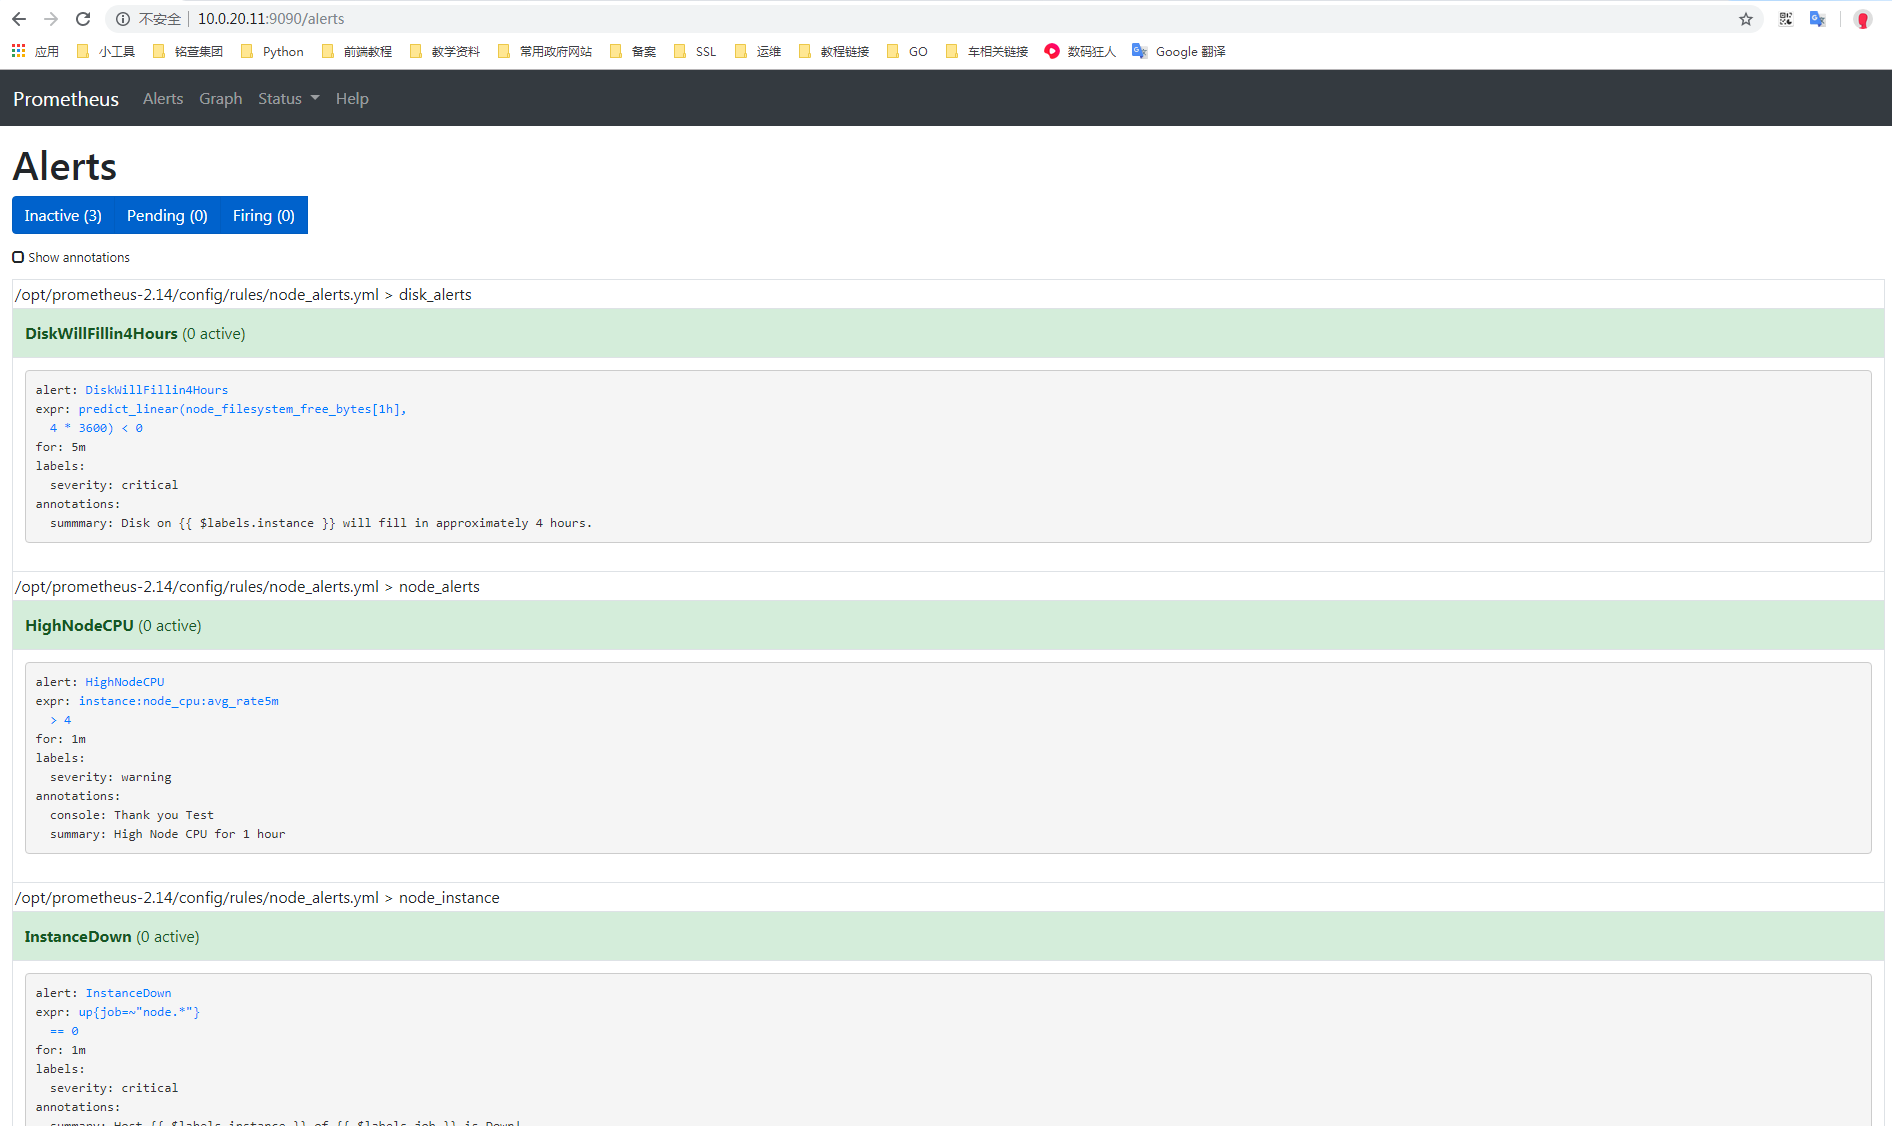
- alert: HighNodeCPU # 告警名称
expr: instance:node_cpu:avg_rate5m > 4 # 告警条件
for: 1m # 查询时间间隔
labels:
severity: warning # 告警级别
annotations: # 注释
summary: High Node CPU for 1 hour # 发送告警的内容
console: Thank you Test
# 下面的和上面的都类似
- name: disk_alerts
rules:
- alert: DiskWillFillin4Hours
expr: predict_linear(node_filesystem_free_bytes[1h], 4*3600) < 0
for: 5m
labels:
severity: critical
annotations:
summmary: Disk on {{ $labels.instance }} will fill in approximately 4 hours.
- name: node_instance
rules:
- alert: InstanceDown
expr: up{job=~"node.*"} == 0
for: 1m
labels:
severity: critical
annotations:
summary: Host {{ $labels.instance }} of {{ $labels.job }} is Down!
[root@es01 config]# cat rules/node_rules.yml

groups:

- name: node_rules          # 规则名称

  interval: 10s             # 查询间隔

  rules:

  - record: instance:node_cpu:avg_rate5m        # 查询名称,此名称在prometheus中可直接查询

    expr: 100 - avg(irate(node_cpu_seconds_total{mode="idle"}[5m])) by (instance) * 100 # 查询语句

    labels:

      metric_type: aggragation          # 增加的标签,通过此规则查出来的metric值,会增加这个标签

  - record: instance:node_memory_usage:percentage

    expr: (node_memory_MemTotal_bytes - (node_memory_MemFree_bytes + node_memory_Cached_bytes + node_memory_Buffers_bytes)) / node_memory_MemTotal_bytes  * 100
重新加载配置文件
检查配置文件,并重新加载
# 检查配置文件

[root@es01 config]# /opt/prometheus-2.14/bin/promtool check config /opt/prometheus-2.14/config/prometheus.yml

Checking /opt/prometheus-2.14/config/prometheus.yml

  SUCCESS: 1 rule files found

Checking /opt/prometheus-2.14/config/rules/node_alerts.yml

  SUCCESS: 3 rules found

# 重新加载配置文件

[root@es01 config]# curl -X POST httP://10.0.20.11:9090/-/reload

[root@es01 config]#
测试触发告警
下载CPU压测软件下载地址:https://patrickmn.com/projects/cpuburn/
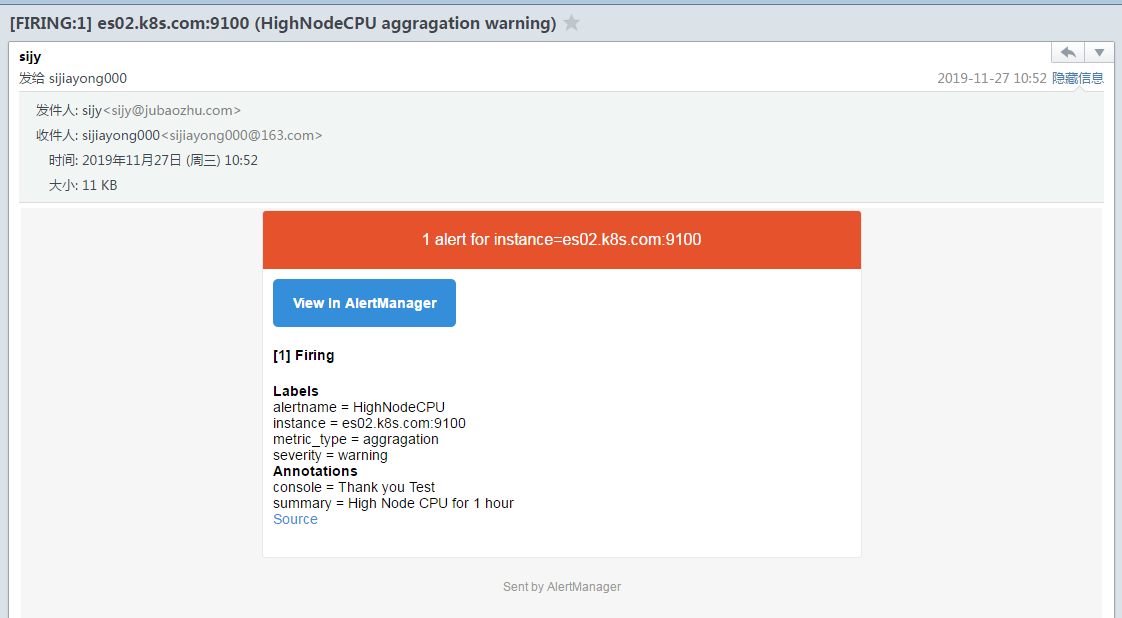
这个软件能把CPU跑满,之后prometheus会想Alertmanager发出告警,Alertmanager收到后会发送邮件。
root@es2 ~]# wget https://cdn.pmylund.com/files/tools/cpuburn/linux/cpuburn-1.0-amd64.tar.gz

--2019-11-27 10:44:33--  https://cdn.pmylund.com/files/tools/cpuburn/linux/cpuburn-1.0-amd64.tar.gz

Resolving cdn.pmylund.com (cdn.pmylund.com)... 13.35.50.33, 13.35.50.98, 13.35.50.4, ...

Connecting to cdn.pmylund.com (cdn.pmylund.com)|13.35.50.33|:443... connected.

HTTP request sent, awaiting response... 200 OK

Length: 414161 (404K) [application/x-gzip]

Saving to: ‘cpuburn-1.0-amd64.tar.gz’

100%[================================================================================================================>] 414,161      372KB/s   in 1.1s

2019-11-27 10:44:37 (372 KB/s) - ‘cpuburn-1.0-amd64.tar.gz’ saved [414161/414161]

[root@es2 ~]# tar xf cpuburn-1.0-amd64.tar.gz

[root@es2 ~]# ls

cpuburn  cpuburn-1.0-amd64.tar.gz

[root@es2 ~]# cd cpuburn

[root@es2 cpuburn]# ls

cpuburn  LICENSE  README

[root@es2 cpuburn]# ./cpuburn

Burning 4 CPUs/cores

10 seconds

20 seconds

30 seconds
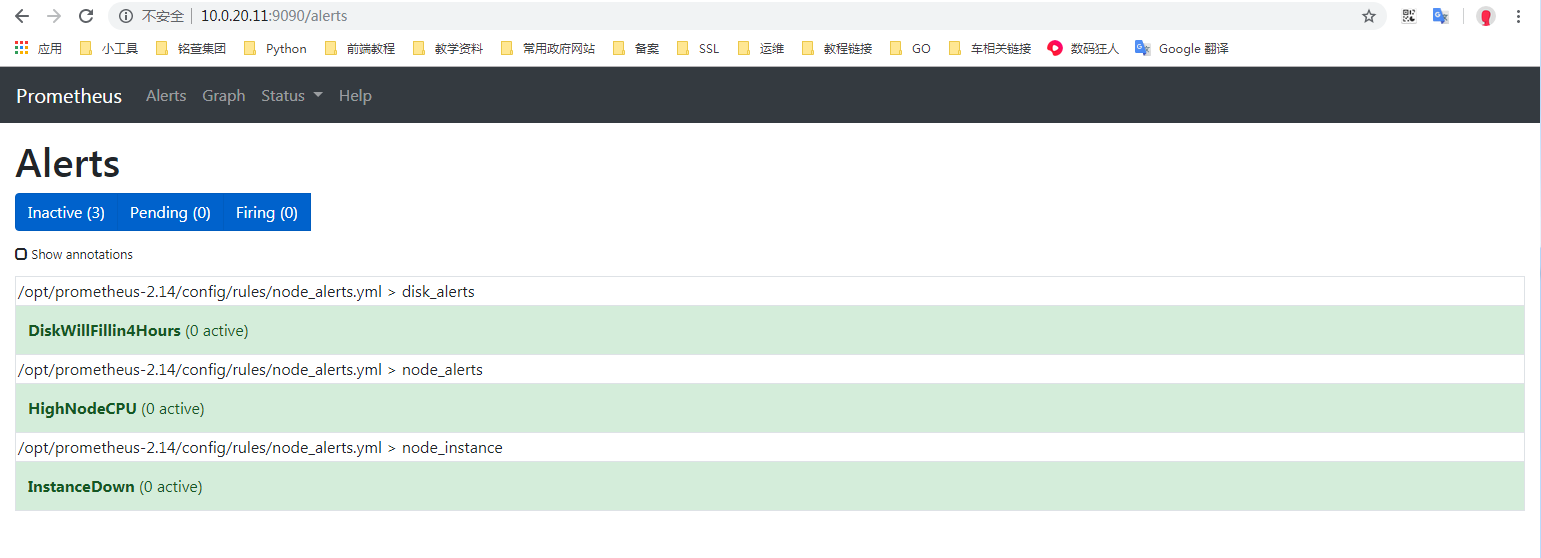
查看prometheus中alert
然后去alertmanager页面查看:
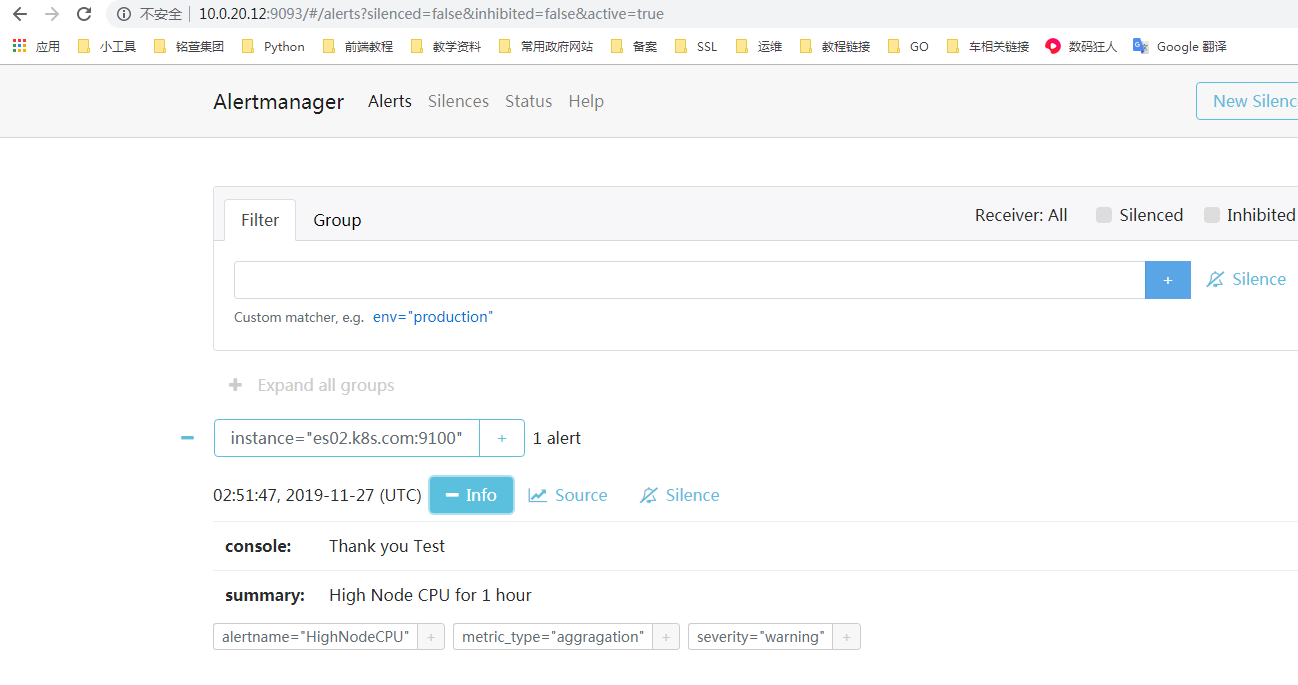
当Alertmanager收到此警告后,等待三十秒,当没有其他警告接入的时候,会把此警告信息通过邮件的形式发出。
[转帖]Alertmanager 部署配置的更多相关文章
- Alertmanager 部署配置
目录 前言 源码安装 配置 启动 配置prometheus监控Alertmanager 修改prometheus配置 重新加载配置文件 配置测试告警 修改prometheus配置 重新加载配置文件 测 ...
- Prometheus 和 Alertmanager实战配置
Prometheus时序数据库 一.Prometheus 1.Prometheus安装 1)源码安装 prometheus安装包最新版本下载地址:https://prometheus.io/downl ...
- Prometheus+alertmanager告警配置-2
prometheus 告警 prometheus 通过alertmanager进行告警 实现监控告警的步骤: 在prometheus中定义告警规则rule_files alertmanager配置告警 ...
- Prometheus Alertmanager生产配置趟过的坑总结
简介 Alertmanager 处理由客户端应用程序(如 Prometheus server)发送的警报.它负责去重(deduplicating),分组(grouping),并将它们路由(routin ...
- Jenkins部署配置简介
前段时间研究了一下自动化测试,因而接触到了Jenkins,今天有时间进行一下Jenkins部署配置相关知识的总结分享 前言:由于本次只是实验性研究,采用Windows环境,因此Jenkins可以通过下 ...
- TOMCAT的安装部署配置(配图解)
TOMCAT的安装部署配置 前提已经成功搭建配置JDK 下载好压缩包后,直接解压至某一目录下,目录中不能包含中文 双击安装文件,出现如下界面 点击[NEXT],出现如下界面 点击[I AGREE],出 ...
- PL/SQL安装部署配置(配图解)
PL/SQL安装部署配置 下载好安装包之后,双击exe程序 双击安装程序,出现如下页面 点击[NEXT],出现如下界面 选择[I Accept...],点击[NEXT],出现如下界面 选择安装路径,点 ...
- JDK的安装及部署配置(配图解)
JDK的安装及部署配置 双击安装文件,出现如下界面 点击[下一步]出现如下界面,更改安装路径(建议安装至D盘), 点击[下一步],出现如下界面,修改文件夹名. 点击[确定],耐心等待 直至出现如下界面 ...
- linux后台server开发环境的部署配置和验证(nginx+apache+php-fpm+FASTCGI(C/C++))
linux后台server开发环境部署配置 引言 背景 随着互联网业务的不断增多.开发环境变得越来越复杂,为了便于统一server端的开发部署环境,特制定本配置文档. 使用软件 CentOS 6.3( ...
- 7、Web应用程序中的安全向量 -- 使用Retail部署配置
该方法不需要胡乱地编辑各个配置设置,而是利用了ASP.NET特性:Retail部署配置. 部署配置是服务器的machine.config文件(在%windir%\Microsoft.NET\Frame ...
随机推荐
- win10 安装 AutoCAD
有些人在 win10 系统下 安装 AutoCAD 会有些小问题,不要担心,根据下面这些图片就可以解决你的问题 答案很简单,就是安装.NET Framework3.5,这里提供一种安装方法供大家参考: ...
- 文心一言 VS 讯飞星火 VS chatgpt (52)-- 算法导论6.2 4题
四.当i>A.heap-size/2 时,调用 MAX-HEAPIFY(A,i)会有什么结果? 文心一言: 当 i > A.heap-size/2 时,调用 MAX-HEAPIFY(A, ...
- 实践GoF的设计模式:代理模式
摘要: 代理模式为一个对象提供一种代理以控制对该对象的访问. 本文分享自华为云社区<[Go实现]实践GoF的23种设计模式:代理模式>,作者:元闰子 . 简介 GoF 对代理模式(Prox ...
- 使用 Zpan 搭建低成本个人私有网盘,还不限速
摘要:本文就介绍一个不限速的低成本个人网盘--ZPan,相较于老牌的私有网盘 OwnCloud 等,Zpan 有一个独有的优势:不限速. 本文分享自华为云社区<使用 Zpan 搭建低成本个人私有 ...
- 解析鸿蒙内核消息队列QueueMail接口的哼哈二将
摘要:本文带领大家一起剖析了鸿蒙轻内核的队列模块的QueueMail两个接口的源代码. 本文分享自华为云社区<鸿蒙轻内核M核源码分析系列十三(续) 消息队列QueueMail接口>,作者: ...
- IOS证书制作教程
转载:IOS证书制作教程 点击苹果证书 按钮 编辑 点击新增 编辑 输入证书密码,名称 这个密码不是账号密码,而是一个保护证书的密码,是p12文件的密码,此密码设置后没有其他地方可以找到, ...
- Building wheel for opencv-python (pyproject.toml) ,安装命令增加 --verbose 参数
安装时间较长,通过 --verbose 参数 可以看在不在继续 Mac 安装 paddlehub 出现 Building wheels for collected packages: opencv-p ...
- WCF 动态调用 动态代理
关键词:WCF动态调用.动态调用WCF.WCF使用动态代理精简代码架构.使用反射执行WCF接口 代码地址: https://gitee.com/s0611163/DynamicWCF https:// ...
- #2051:Bitset(进制转化)
Problem Description Give you a number on base ten,you should output it on base two.(0 < n < 10 ...
- AtCoder Beginner Contest 177 (个人题解,C后缀和,D并查集,E质因数分解)
补题链接:Here A - Don't be late 题意:高桥(Takahashi )现在要去距离家 \(D\) 米的地方面基,请问如果以最高速度 \(S\) 能否再 \(T\) 时刻准时到达? ...