微软Charting图表控件 System.Web.UI.DataVisuliztion.Charting
一、概述
基于.NET Framework 3.5 SP1的图表控件——Chart,可在WinForm和WebForm下使用!需要引入System.Web.DataVisualization.dll
并同时提供了大量的示例...
相关下载:
官方主页在MSDN上:
二、安装
控件的安装相对比较简单,下载完后,先执行“MSChart.exe”程序,它会自动检测你的环境,安装到系统目录中去,如果要在VS 2008环境中直接使用,那么需要安装For Vs2008的插件,MSChart_VisualStudioAddOn.exe,还有一个中文语言包MSChartLP_chs.exe。安装完后, 打开Vs2008,在建立项目的时候,你就能在工具栏中看到有一个.NET3.5的Web项目,像使用普通控件一样拖放到要使用的Web界面即可。初步研究了一下,整个图形控件主要由以下几个部份组成:
1.Annotations --图形注解集合
2.ChartAreas --图表区域集合
3.Legends --图例集合
4.Series --图表序列集合(即图表数据对象集合)
5.Titles --图标的标题集合
Annotations注解集合
Annotations是一个对图形的一些注解对象的集合,所谓注解对象,类似于对某个点的详细或者批注的说明,比如,在图片上实现各个节点的关键信息,如下图方框和黄色的小方框:
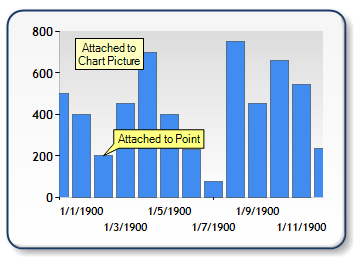
一个图形上可以拥有多个注解对象,可以添加十多种图形样式的注解对象,包括常见的箭头、云朵、矩行、图片等等注解符号,通过各个注解对象的属性,可以方便的设置注解对象的放置位置、呈现的颜色、大小、文字内容样式等常见的属性。
ChartAreas图表区域集合
ChartAreas可以理解为是一个图表的绘图区,例如,你想在一幅图上呈现两个不同属性的内容,一个是用户流量,另一个则是系统资源占用情况,那么你 要在一个图形上绘制这两种情况,明显是不合理的,对于这种情况,可以建立两个ChartArea,一个用于呈现用户流量,另一个则用于呈现系统资源的占用 情况。
当然了,图表控件并不限制你添加多少个绘图区域,你可以根据你的需要进行添加。对于每一个绘图区域,你可以需要注意的是,绘图区域只是一个可以作图的区域范围,它本身并不包含要作图形的各种属性数据。 多绘图区效果图如下,分为上下两个绘图区域,分别表示不同的绘图数据:

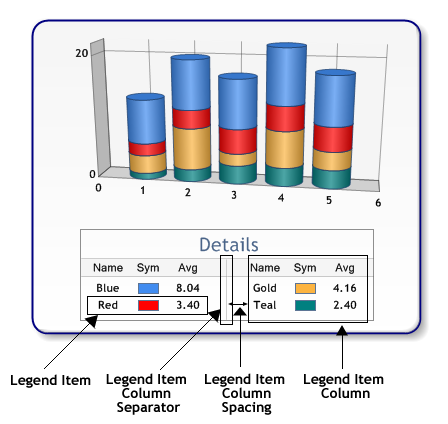
Legends图例集合
Legends是一个图例的集合,即标注图形中各个线条或颜色的含义,同样,一个图片也可以包含多个图例说明,比如像上面说的多个图表区域的方式,则可以 建立多个图例,每别说明各个绘图区域的信息,具体的图例配置说明此处就不详细说明了,可以参考一下官网的例子,写得丰富的详细了:)也上一张图例的效果图 吧~
Series图表序列
图表序列,应该是整个绘图中最关键的内容了,通俗点说,即是实际的绘图数据区域,实际呈现的图形形状,就是由此集合中的每一个图表来构成的,可以往集合里面添加多个图表,每一个图表可以有自己的绘制形状、样式、独立的数据等。
需要注意的是,每一个图表,你可以指定它的绘制区域(见ChartAreas的说明),让此图表呈现在某个绘图区域,也可以让几个图表在同一个绘图区域叠加,如下图:

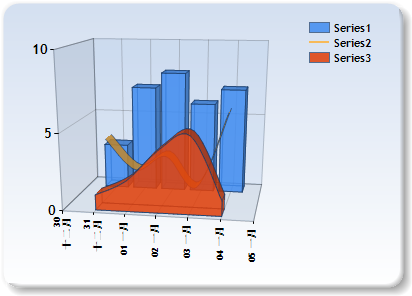
上面两幅图,分别表示了把图表放在不同的绘制区域和放在同一个绘制区域的情况。
继续回到ChartAreas章节举的例子,同时要显示用户的流量还要显示系统的占用情况,对于这种时候,应该建立两个Series,一个用于呈现用户的流量,另一个则用于呈现系统的占用情况。它们分别属于各自的绘图区域。
Titles标题合集
根据字面含义即可以理解,是图表的标题配置,同样可以添加多个标题,以及设置标题的样式及文字、位置等属性。多看一下它的属性即能明白各自的含义。
三、其它属性
相对来说,我觉得比较有用的属性有三个,分别是:Label、Tooltip以及Url链接。
Label即标签的含义,可以在图片的关键位置进行一些关键数字或文字的描述,如下图:
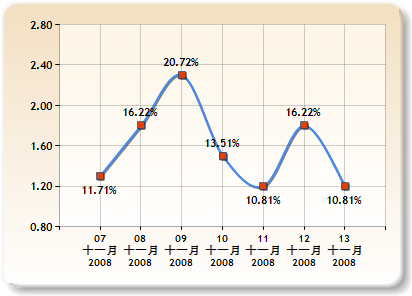
像上图:X轴和Y轴的文字便是标签,以及图表曲线中的红点上的文字,也是标签,添加了标签,可以让人更容易的对内容进行理解。
Tooltip即提示的含义,用于在各个关键点,如:标签、图形关键点、标题等当鼠标移动上去的时候,提示用户一些相关的详细或说明信息,例如上图,可以 给曲线中的每一个点增加Tooltip的属性,写上需要详细说明的内容,比如:详细的销售明细,那么,在鼠标移动到这个点的时候,会自动弹出提示信息。
Tooltip可以支持简单方式以及自定义的方式,简单方式即像平时Html页面设置此属性,在鼠标点击的时候,代到其它相应的页面去。
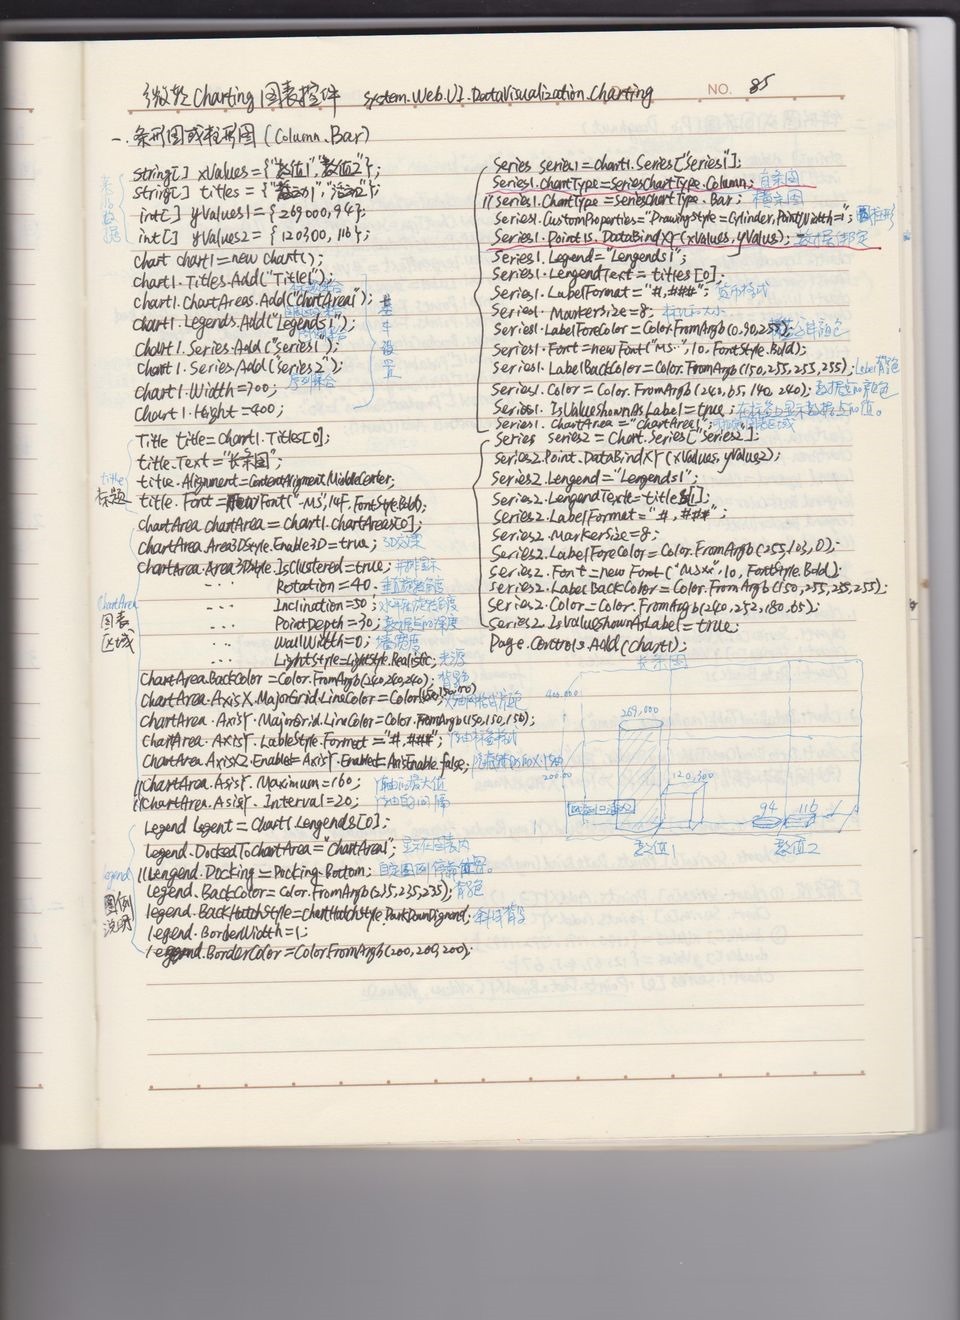
四、柱状图或条形图:(Column、Bar)
柱状图:
string[] x = new string[] { "南山大队", "福田大队", "罗湖大队", "宝安大队", "指挥处", "大帝科技", "南山大队", "福田大队", };

double[] y = new double[] { 541, 574, 345, 854, 684, 257, 541, 574, 345, 854, 684, 257 };

string[] z = new string[] { "", "", "", "", "", "", "", "", "", "", "", "" };

string[] a = new string[] { "南山大队", "福田大队", "罗湖大队", "宝安大队", "指挥处", };

double[] b = new double[] { 541, 574, 345, 854, 257 };

//标题

cht1.Titles.Add("柱状图数据分析");

cht1.Titles[0].ForeColor = Color.White;

cht1.Titles[0].Font = new Font("微软雅黑", 12f, FontStyle.Regular);

cht1.Titles[0].Alignment = ContentAlignment.TopCenter;

cht1.Titles.Add("合计:25414 宗");

cht1.Titles[1].ForeColor = Color.White;

cht1.Titles[1].Font = new Font("微软雅黑", 8f, FontStyle.Regular);

cht1.Titles[1].Alignment = ContentAlignment.TopRight;

//控件背景

cht1.BackColor = Color.Transparent;

//图表区背景

cht1.ChartAreas[0].BackColor = Color.Transparent;

cht1.ChartAreas[0].BorderColor = Color.Transparent;

//X轴标签间距

cht1.ChartAreas[0].AxisX.Interval = 1;

cht1.ChartAreas[0].AxisX.LabelStyle.IsStaggered = true;

cht1.ChartAreas[0].AxisX.LabelStyle.Angle = -45;

cht1.ChartAreas[0].AxisX.TitleFont = new Font("微软雅黑", 14f, FontStyle.Regular);

cht1.ChartAreas[0].AxisX.TitleForeColor = Color.White;

//X坐标轴颜色

cht1.ChartAreas[0].AxisX.LineColor = ColorTranslator.FromHtml("#38587a"); ;

cht1.ChartAreas[0].AxisX.LabelStyle.ForeColor = Color.White;

cht1.ChartAreas[0].AxisX.LabelStyle.Font = new Font("微软雅黑", 10f, FontStyle.Regular);

//X坐标轴标题

//cht1.ChartAreas[0].AxisX.Title = "数量(宗)";

//cht1.ChartAreas[0].AxisX.TitleFont = new Font("微软雅黑", 10f, FontStyle.Regular);

//cht1.ChartAreas[0].AxisX.TitleForeColor = Color.White;

//cht1.ChartAreas[0].AxisX.TextOrientation = TextOrientation.Horizontal;

//cht1.ChartAreas[0].AxisX.ToolTip = "数量(宗)";

//X轴网络线条

cht1.ChartAreas[0].AxisX.MajorGrid.Enabled = true;

cht1.ChartAreas[0].AxisX.MajorGrid.LineColor = ColorTranslator.FromHtml("#2c4c6d");

//Y坐标轴颜色

cht1.ChartAreas[0].AxisY.LineColor = ColorTranslator.FromHtml("#38587a");

cht1.ChartAreas[0].AxisY.LabelStyle.ForeColor = Color.White;

cht1.ChartAreas[0].AxisY.LabelStyle.Font = new Font("微软雅黑", 10f, FontStyle.Regular);

//Y坐标轴标题

cht1.ChartAreas[0].AxisY.Title = "数量(宗)";

cht1.ChartAreas[0].AxisY.TitleFont = new Font("微软雅黑", 10f, FontStyle.Regular);

cht1.ChartAreas[0].AxisY.TitleForeColor = Color.White;

cht1.ChartAreas[0].AxisY.TextOrientation = TextOrientation.Rotated270;

cht1.ChartAreas[0].AxisY.ToolTip = "数量(宗)";

//Y轴网格线条

cht1.ChartAreas[0].AxisY.MajorGrid.Enabled = true;

cht1.ChartAreas[0].AxisY.MajorGrid.LineColor = ColorTranslator.FromHtml("#2c4c6d");

cht1.ChartAreas[0].AxisY2.LineColor = Color.Transparent;

cht1.ChartAreas[0].BackGradientStyle = GradientStyle.TopBottom;

Legend legend = new Legend("legend");

legend.Title = "legendTitle";

cht1.Series[0].XValueType = ChartValueType.String;  //设置X轴上的值类型

cht1.Series[0].Label = "#VAL";                //设置显示X Y的值

cht1.Series[0].LabelForeColor = Color.White;

cht1.Series[0].ToolTip = "#VALX:#VAL";     //鼠标移动到对应点显示数值

cht1.Series[0].ChartType = SeriesChartType.Column;    //图类型(折线)

cht1.Series[0].Color = Color.Lime;

cht1.Series[0].LegendText = legend.Name;

cht1.Series[0].IsValueShownAsLabel = true;

cht1.Series[0].LabelForeColor = Color.White;

cht1.Series[0].CustomProperties = "DrawingStyle = Cylinder";

cht1.Legends.Add(legend);

cht1.Legends[0].Position.Auto = false;

//绑定数据

cht1.Series[0].Points.DataBindXY(x, y);

cht1.Series[0].Points[0].Color = Color.White;

cht1.Series[0].Palette = ChartColorPalette.Bright;
条形图:
//标题

cht3.Titles.Add("交通违法行为TOP5");

cht3.Titles[0].ForeColor = Color.White;

cht3.Titles[0].Font = new Font("微软雅黑", 12f, FontStyle.Regular);

cht3.Titles[0].Alignment = ContentAlignment.TopCenter;

cht3.Titles.Add("合计:25412 宗 ");

cht3.Titles[1].ForeColor = Color.White;

cht3.Titles[1].Font = new Font("微软雅黑", 8f, FontStyle.Regular);

cht3.Titles[1].Alignment = ContentAlignment.TopRight;

//控件背景

cht3.BackColor = Color.Transparent;

//图表区背景

cht3.ChartAreas[0].BackColor = Color.Transparent;

cht3.ChartAreas[0].BorderColor = Color.Transparent;

//X轴标签间距

cht3.ChartAreas[0].AxisX.Interval = 1;

cht3.ChartAreas[0].AxisX.LabelStyle.IsStaggered = true;

cht3.ChartAreas[0].AxisX.LabelStyle.Angle = -45;

cht3.ChartAreas[0].AxisX.TitleFont = new Font("微软雅黑", 14f, FontStyle.Regular);

cht3.ChartAreas[0].AxisX.TitleForeColor = Color.White;

//X坐标轴颜色

cht3.ChartAreas[0].AxisX.LineColor = ColorTranslator.FromHtml("#38587a"); ;

cht3.ChartAreas[0].AxisX.LabelStyle.ForeColor = Color.White;

cht3.ChartAreas[0].AxisX.LabelStyle.Font = new Font("微软雅黑", 10f, FontStyle.Regular);

//X坐标轴标题

//cht3.ChartAreas[0].AxisX.Title = "数量(宗)";

//cht3.ChartAreas[0].AxisX.TitleFont = new Font("微软雅黑", 10f, FontStyle.Regular);

//cht3.ChartAreas[0].AxisX.TitleForeColor = Color.White;

//cht3.ChartAreas[0].AxisX.TextOrientation = TextOrientation.Auto;

//cht3.ChartAreas[0].AxisX.ToolTip = "数量(宗)";

//X轴网络线条

cht3.ChartAreas[0].AxisX.MajorGrid.Enabled = true;

cht3.ChartAreas[0].AxisX.MajorGrid.LineColor = ColorTranslator.FromHtml("#2c4c6d");

//Y坐标轴颜色

cht3.ChartAreas[0].AxisY.LineColor = ColorTranslator.FromHtml("#38587a");

cht3.ChartAreas[0].AxisY.LabelStyle.ForeColor = Color.White;

cht3.ChartAreas[0].AxisY.LabelStyle.Font = new Font("微软雅黑", 10f, FontStyle.Regular);

//Y坐标轴标题

//cht3.ChartAreas[0].AxisY.Title = "数量(宗)";

//cht3.ChartAreas[0].AxisY.TitleFont = new Font("微软雅黑", 10f, FontStyle.Regular);

//cht3.ChartAreas[0].AxisY.TitleForeColor = Color.White;

//cht3.ChartAreas[0].AxisY.TextOrientation = TextOrientation.Auto;

//cht3.ChartAreas[0].AxisY.ToolTip = "数量(宗)";

//Y轴网格线条

cht3.ChartAreas[0].AxisY.MajorGrid.Enabled = true;

cht3.ChartAreas[0].AxisY.MajorGrid.LineColor = ColorTranslator.FromHtml("#2c4c6d");

cht3.ChartAreas[0].AxisY2.LineColor = Color.Transparent;

cht3.ChartAreas[0].AxisX.IsMarginVisible = false;

cht3.ChartAreas[0].Area3DStyle.Enable3D = true;

//背景渐变

cht2.ChartAreas[0].BackGradientStyle = GradientStyle.None;

//图例样式

Legend legend3 = new Legend("#VALX");

legend3.Title = "图例";

legend3.TitleBackColor = Color.Transparent;

legend3.BackColor = Color.Transparent;

legend3.TitleForeColor = Color.White;

legend3.TitleFont = new Font("微软雅黑", 10f, FontStyle.Regular);

legend3.Font = new Font("微软雅黑", 8f, FontStyle.Regular);

legend3.ForeColor = Color.White;

cht3.Series[0].XValueType = ChartValueType.String;  //设置X轴上的值类型

cht3.Series[0].Label = "#VAL";                //设置显示X Y的值

cht3.Series[0].LabelForeColor = Color.White;

cht3.Series[0].ToolTip = "#VALX:#VAL(宗)";     //鼠标移动到对应点显示数值

cht3.Series[0].ChartType = SeriesChartType.Bar;    //图类型(折线)

cht3.Series[0].Color = Color.Lime;

//cht3.Series[0].LegendText = legend3.Name;

cht3.Series[0].IsValueShownAsLabel = true;

cht3.Series[0].LabelForeColor = Color.White;

cht3.Series[0].CustomProperties = "DrawingStyle = Cylinder";

cht3.Series[0].CustomProperties = "PieLabelStyle = Outside";

//cht3.Legends.Add(legend3);

//cht3.Legends[0].Position.Auto = true;

//是否显示图例

cht3.Series[0].IsVisibleInLegend = true;

cht3.Series[0].ShadowOffset = 0;

//饼图折线

cht3.Series[0]["PieLineColor"] = "White";

//绑定数据

cht3.Series[0].Points.DataBindXY(a, b);

//cht3.Series[0].Points[0].Color = Color.White;

//绑定颜色

cht3.Series[0].Palette = ChartColorPalette.BrightPastel;

//for (int n = 0; n < x.Length; n++)

//{

//    int ptIdx = cht3.Series[0].Points.AddY(Convert.ToDouble(y[n]));

//    DataPoint pt = this.cht3.Series[0].Points[ptIdx];

//    pt.LegendText = x[n] + " " + "#PERCENT{P2}" + " [ " + "#VAL{D} 次" + " ]";//右边标签列显示的文字

//    pt.Label = x[n] + " " + "#PERCENT{P2}" + " [ " + "#VAL{D} 次" + " ]"; //圆饼外显示的信息

//    //  pt.LabelToolTip = "#PERCENT{P2}";

//    //pt.LabelBorderColor = Color.Red;//文字背景色

//}
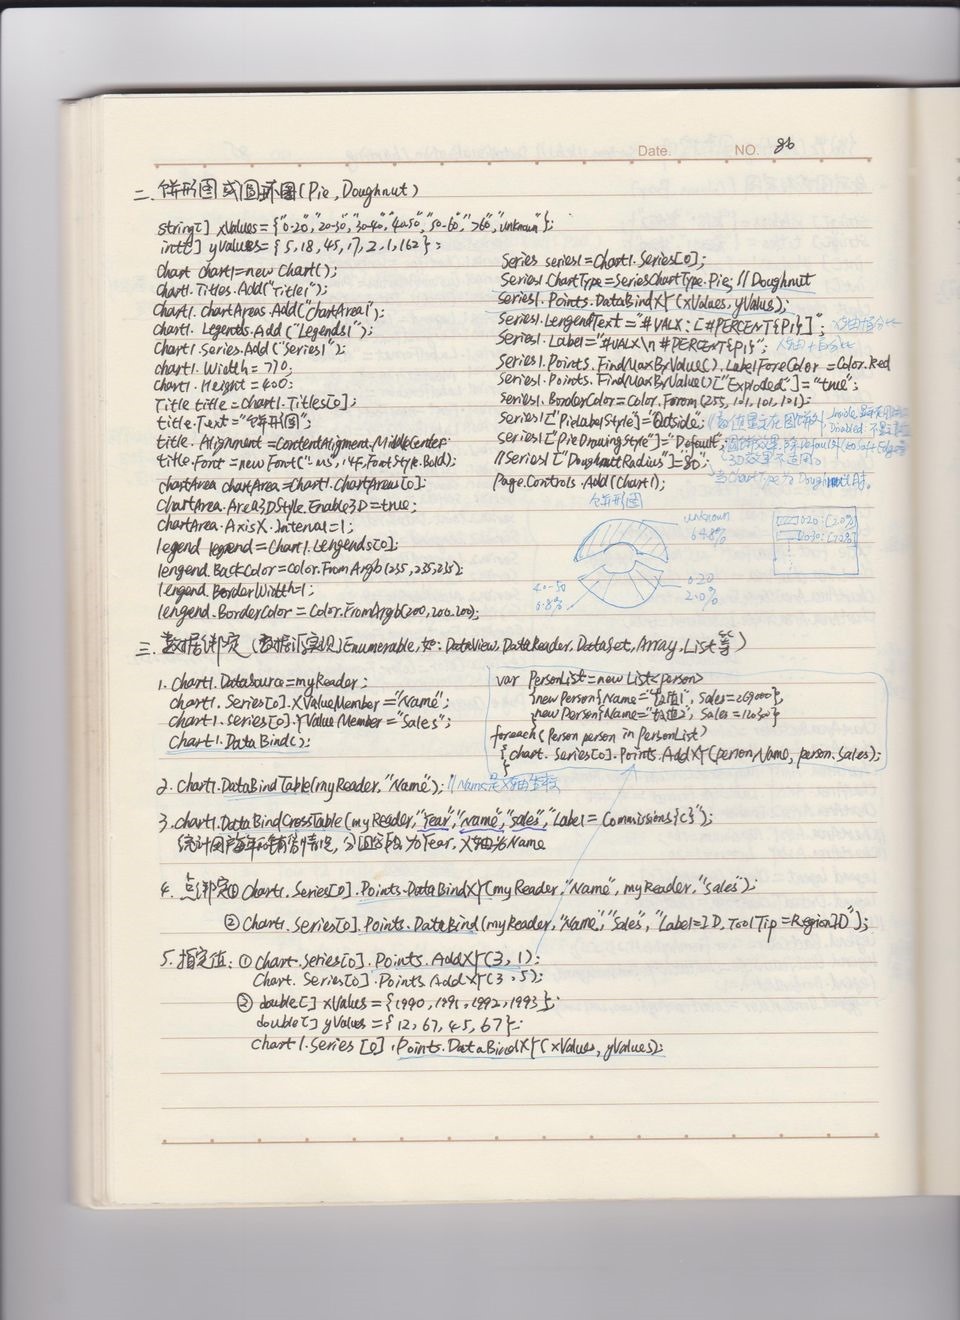
五、饼图或者圆环图(Pie、Doughnut)
//标题

cht2.Titles.Add("饼图数据分析");

cht2.Titles[0].ForeColor = Color.White;

cht2.Titles[0].Font = new Font("微软雅黑", 12f, FontStyle.Regular);

cht2.Titles[0].Alignment = ContentAlignment.TopCenter;

cht2.Titles.Add("合计:25412 宗");

cht2.Titles[1].ForeColor = Color.White;

cht2.Titles[1].Font = new Font("微软雅黑", 8f, FontStyle.Regular);

cht2.Titles[1].Alignment = ContentAlignment.TopRight;

//控件背景

cht2.BackColor = Color.Transparent;

//图表区背景

cht2.ChartAreas[0].BackColor = Color.Transparent;

cht2.ChartAreas[0].BorderColor = Color.Transparent;

//X轴标签间距

cht2.ChartAreas[0].AxisX.Interval = 1;

cht2.ChartAreas[0].AxisX.LabelStyle.IsStaggered = true;

cht2.ChartAreas[0].AxisX.LabelStyle.Angle = -45;

cht2.ChartAreas[0].AxisX.TitleFont = new Font("微软雅黑", 14f, FontStyle.Regular);

cht2.ChartAreas[0].AxisX.TitleForeColor = Color.White;

//X坐标轴颜色

cht2.ChartAreas[0].AxisX.LineColor = ColorTranslator.FromHtml("#38587a"); ;

cht2.ChartAreas[0].AxisX.LabelStyle.ForeColor = Color.White;

cht2.ChartAreas[0].AxisX.LabelStyle.Font = new Font("微软雅黑", 10f, FontStyle.Regular);

//X坐标轴标题

cht2.ChartAreas[0].AxisX.Title = "数量(宗)";

cht2.ChartAreas[0].AxisX.TitleFont = new Font("微软雅黑", 10f, FontStyle.Regular);

cht2.ChartAreas[0].AxisX.TitleForeColor = Color.White;

cht2.ChartAreas[0].AxisX.TextOrientation = TextOrientation.Horizontal;

cht2.ChartAreas[0].AxisX.ToolTip = "数量(宗)";

//X轴网络线条

cht2.ChartAreas[0].AxisX.MajorGrid.Enabled = true;

cht2.ChartAreas[0].AxisX.MajorGrid.LineColor = ColorTranslator.FromHtml("#2c4c6d");

//Y坐标轴颜色

cht2.ChartAreas[0].AxisY.LineColor = ColorTranslator.FromHtml("#38587a");

cht2.ChartAreas[0].AxisY.LabelStyle.ForeColor = Color.White;

cht2.ChartAreas[0].AxisY.LabelStyle.Font = new Font("微软雅黑", 10f, FontStyle.Regular);

//Y坐标轴标题

cht2.ChartAreas[0].AxisY.Title = "数量(宗)";

cht2.ChartAreas[0].AxisY.TitleFont = new Font("微软雅黑", 10f, FontStyle.Regular);

cht2.ChartAreas[0].AxisY.TitleForeColor = Color.White;

cht2.ChartAreas[0].AxisY.TextOrientation = TextOrientation.Rotated270;

cht2.ChartAreas[0].AxisY.ToolTip = "数量(宗)";

//Y轴网格线条

cht2.ChartAreas[0].AxisY.MajorGrid.Enabled = true;

cht2.ChartAreas[0].AxisY.MajorGrid.LineColor = ColorTranslator.FromHtml("#2c4c6d");

cht2.ChartAreas[0].AxisY2.LineColor = Color.Transparent;

//背景渐变

cht2.ChartAreas[0].BackGradientStyle = GradientStyle.None;

//图例样式

Legend legend2 = new Legend("#VALX");

legend2.Title = "图例";

legend2.TitleBackColor = Color.Transparent;

legend2.BackColor = Color.Transparent;

legend2.TitleForeColor = Color.White;

legend2.TitleFont = new Font("微软雅黑", 10f, FontStyle.Regular);

legend2.Font = new Font("微软雅黑", 8f, FontStyle.Regular);

legend2.ForeColor = Color.White;

cht2.Series[0].XValueType = ChartValueType.String;  //设置X轴上的值类型

cht2.Series[0].Label = "#VAL";                //设置显示X Y的值

cht2.Series[0].LabelForeColor = Color.White;

cht2.Series[0].ToolTip = "#VALX:#VAL(宗)";     //鼠标移动到对应点显示数值

cht2.Series[0].ChartType = SeriesChartType.Pie;    //图类型(折线)

cht2.Series[0].Color = Color.Lime;

cht2.Series[0].LegendText = legend2.Name;

cht2.Series[0].IsValueShownAsLabel = true;

cht2.Series[0].LabelForeColor = Color.White;

cht2.Series[0].CustomProperties = "DrawingStyle = Cylinder";

cht2.Series[0].CustomProperties = "PieLabelStyle = Outside";

cht2.Legends.Add(legend2);

cht2.Legends[0].Position.Auto = true;

cht2.Series[0].IsValueShownAsLabel = true;

//是否显示图例

cht2.Series[0].IsVisibleInLegend = true;

cht2.Series[0].ShadowOffset = 0;

//饼图折线

cht2.Series[0]["PieLineColor"] = "White";

//绑定数据

cht2.Series[0].Points.DataBindXY(x, y);

cht2.Series[0].Points[0].Color = Color.White;

//绑定颜色

cht2.Series[0].Palette = ChartColorPalette.BrightPastel;
六、数据绑定
啊啊
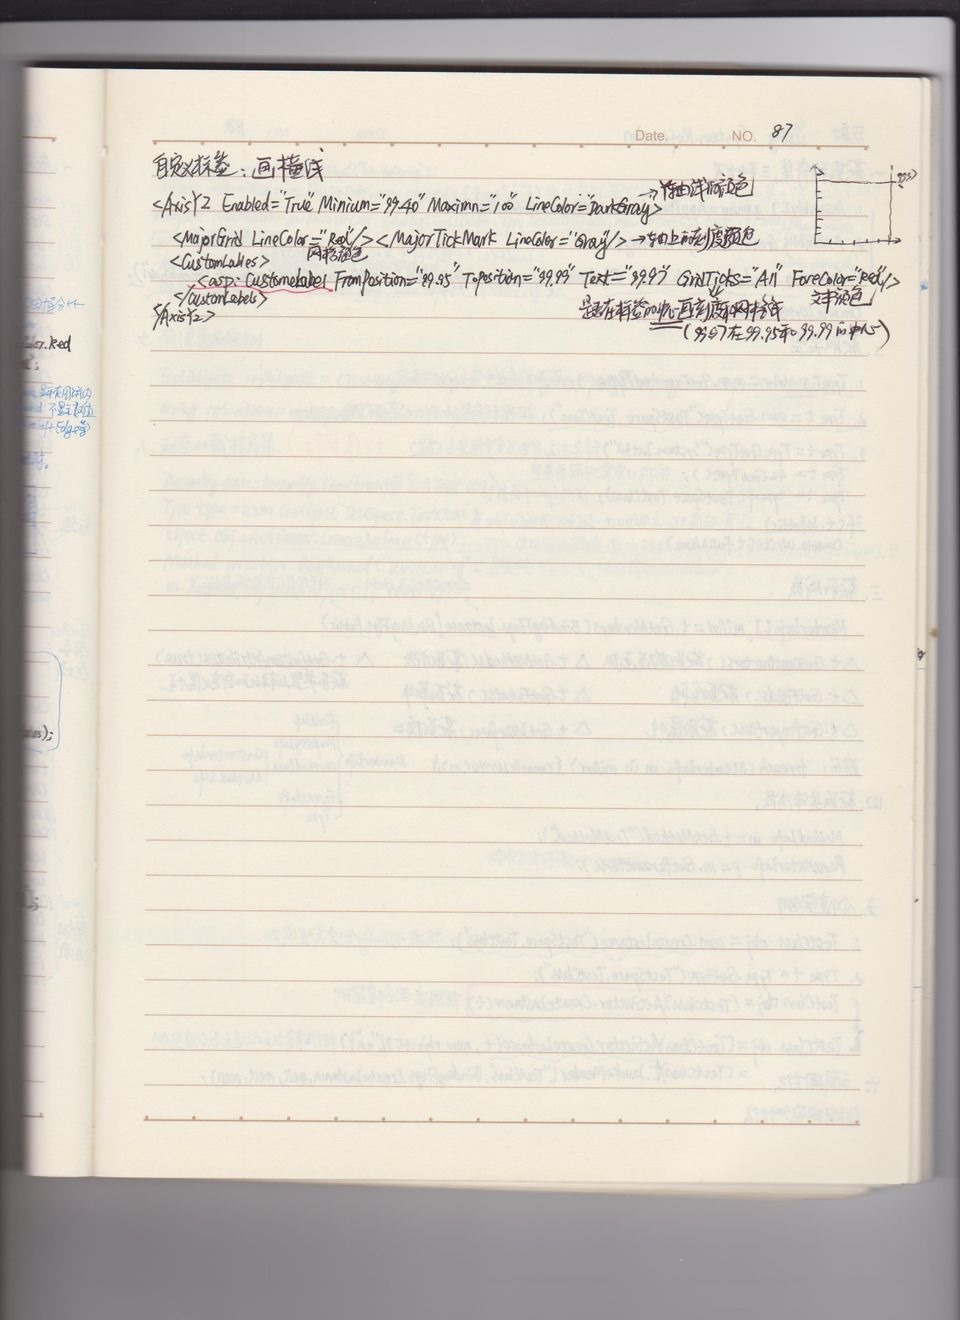
七、自定义标签:画横线:
啊啊
微软Charting图表控件 System.Web.UI.DataVisuliztion.Charting的更多相关文章
- 基类包括字段“ScriptManager1”,但其类型(System.Web.UI.ScriptManager)与控件(System.Web.UI.ScriptManager)的类型不兼容
首先说下原先的情况,就是原本老项目的Web解决方案是使用.net framework 2.0的老版本, 所以机器也安装过Microsoft ASP.NET 2.0 AJAX Extensions..A ...
- .net CHARTING图表控件下载地址
.net CHARTING是一款功能强大的图表控件,利用.NET framework和GDI+为工作于ASP.NET和Winform的C#和VB.NET开发人员提供可托管的图表解决方案,提供了多种2D ...
- asp.net微软图表控件使用示例
<configuration> <system.webServer> <handlers> <remove name="ChartImageHand ...
- 关于微软C#中的CHART图表控件的简单使用【转】
最近公司项目要用到Chart图表控件,这是一个比较老的东西了,目前网络上似乎已经不太流行这个控件,但是只要配置了相关的属性,效果还是可以的.前前后后摸索了好久,接下来谈谈这个件控件最重要的几个属性. ...
- 关于微软C#中的CHART图表控件的简单使用
最近公司项目要用到Chart图表控件,这是一个比较老的东西了,目前网络上似乎已经不太流行这个控件,但是只要配置了相关的属性,效果还是可以的.前前后后摸索了好久,接下来谈谈这个件控件最重要的几个属性. ...
- asp.net微软图表控件MsChart
前段时间,开发项目时,由于需要,需要将一些数据统计,并以图表形式显示.由于是asp.net,所以就找到了MsChart图表控件,还是挺方便实用的,分享一下. MsChart控件的主要组成如图所示 工具 ...
- 微软图表控件MsChart使用
assemblies节点下:<add assembly="System.Web.DataVisualization, Version=3.5.0.0, Culture=neutral, ...
- “System.Web.UI.WebControls.Literal”不允许使用子控件
今天在写下面的代码时遭遇错误——“System.Web.UI.WebControls.Literal”不允许使用子控件('System.Web.UI.WebControls.Literal' does ...
- .net chart(图表)控件的使用-System.Windows.Forms.DataVisualization.dll
这个案例指在介绍微软这套免费又功能强大的图表控件Microsoft Chart Controls for Microsoft .NET Framework 3.5,通过它,可让您的项目及报表,轻松套用 ...
随机推荐
- 手动添加Git Bash到右键菜单
1. 打开注册表. 2. 找到[HKEY_CLASSES_ROOT\Directory\Background]. 3. 在[Background]下如果没有[shell],则右键-新建项[shell] ...
- 图解ARP协议(五)免费ARP:地址冲突了肿么办?
一.免费ARP概述 网络世界纷繁复杂,除了各种黑客攻击行为对网络能造成实际破坏之外,还有一类安全问题或泛安全问题,看上去问题不大,但其实仍然可以造成极大的杀伤力.今天跟大家探讨的,也是技术原理比较简单 ...
- MongoDB基本用法(增删改高级查询、mapreduce)
TestCase.java package com.wujintao.mongo; import java.net.UnknownHostException; import java.util.Arr ...
- 基于标注的AOP面向切面编程
1.什么是AOP Aspect Orientied Programming的简称,即 面向(方面)切面编程 ,不改变一个组件源代码的情况下 可以对组件功能进行增强. 例如:servlet中的过滤 ...
- MySQL安装再折腾--编码的设置
一.MySQL的安装 从官网(https://dev.mysql.com/downloads/mysql/)中下载Mac OS X 10.12 (x86, 64-bit), DMG Archive(m ...
- JQuery实现获取多个input输入框的值,并存放在一个数组中
<!DOCTYPE html> <html lang="en"> <head> <meta charset="UTF-8&quo ...
- HTML绝对路径和相对路径
HTML路径: 绝对路径:从根目录开始 相对路径:../ 相对于html文件,上一级 ./ 相对于html文件,当前路径(可以省略) 文件夹名 相对于html文件,往文件里面走
- js迪杰斯特拉算法求最短路径
1.后台生成矩阵 名词解释和下图参考:https://blog.csdn.net/csdnxcn/article/details/80057574 double[,] arr = new double ...
- canvas中strokeRect的渲染问题>>strokeRect把一像素的边框渲染成两像素
> 结论写在头 var oC = document.getElementById('c1'); var oGC = oC.getContext('2d'); oGC.strokeRect(50, ...
- 从零开始安装、编译、部署 Docker
简介 主要介绍如何从基础系统debian部署docker关于docker基础知识在 相关资料 里有链接 安装docker 1.使用root用户身份添加apt源添加public key使docker的安 ...