使用bokeh-scala进行数据可视化
目录
一、前言
最近在使用spark集群以及geotrellis框架(相关文章见http://www.cnblogs.com/shoufengwei/p/5619419.html)进行分布式空间地理系统设计(暂且夸大称之为地理信息系统),虽说是空间地理信息系统但是也少不了数据可视化方面的操作,所以就想寻找一款支持大数据的可视化框架,网上查阅半天发现bokeh不错(其实是老板直接指明方向说用这款),恰好bokeh也有scala语言的封装,Github地址,于是拿来练练手,算是做个技术储备。
二、bokeh简介及胡扯
bokeh是一个python下的大数据可视化框架Github地址。其官网对其介绍如下:
Bokeh is a Python interactive visualization library that targets modern web browsers for presentation. Bokeh provides elegant, concise construction of novel graphics with high-performance interactivity over very large or streaming datasets in a quick and easy way.
根据我拙劣的英语水平翻译如下:
Bokeh是一个基于Python语言的显示于新式浏览器中的交互式的可视化类库。Bokeh提供了一种快速且简单的基于大数据以及流式数据的高性能的可交互式的优雅的简洁的图表制作。
比较拗口,总体意思就是Bokeh能够很好的支持大数据下的可交互式的数据可视化,新式浏览器应当是支持HTML5的浏览器,不过还未考证。
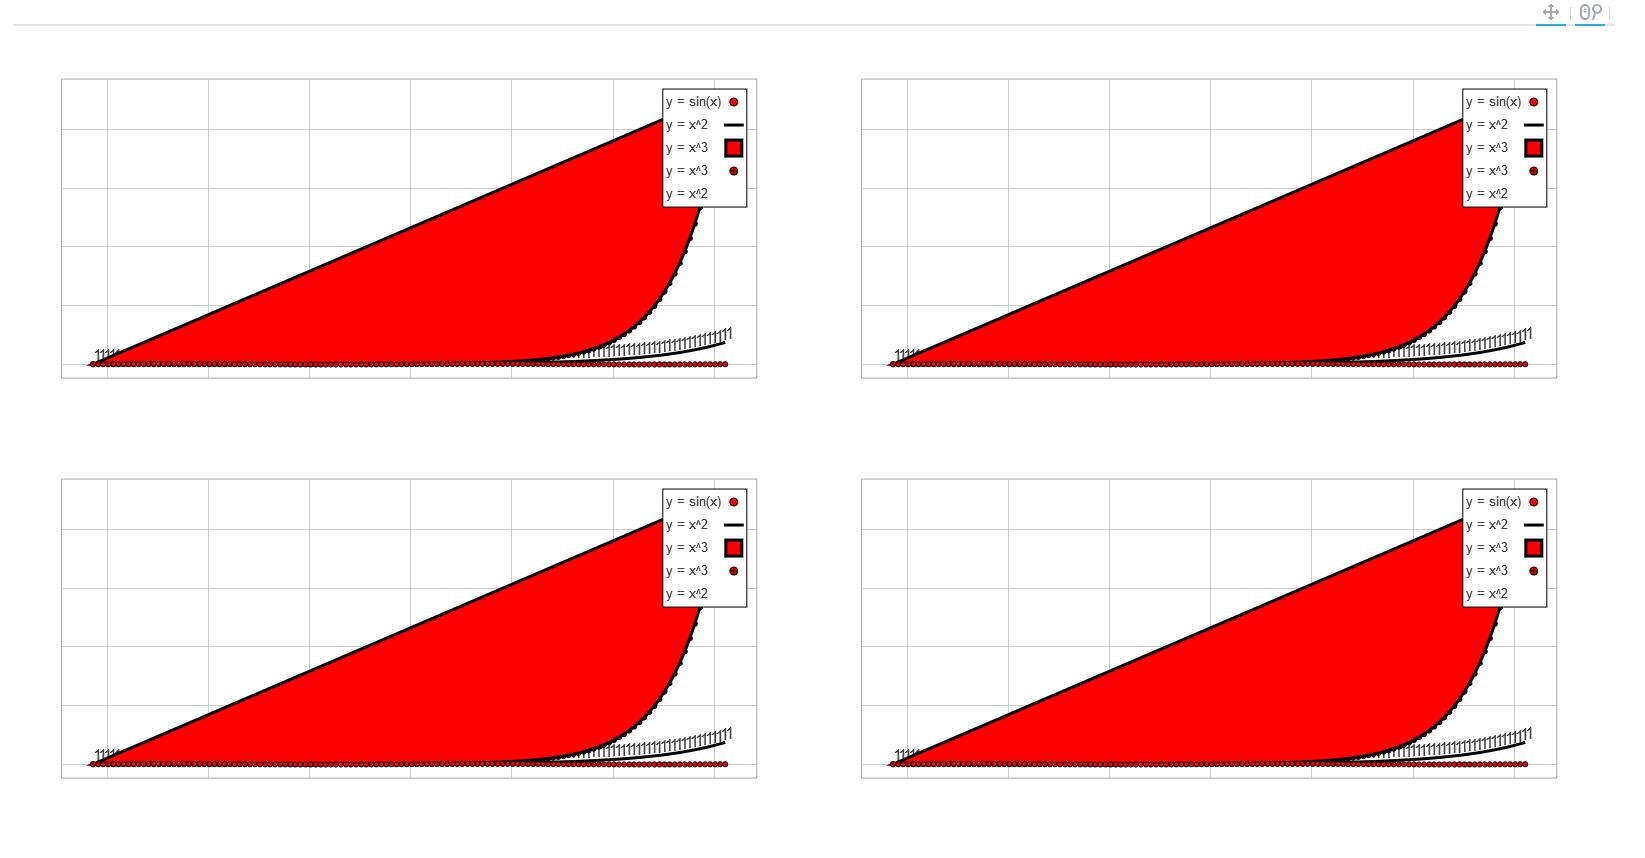
看了一下其Python代码示例,确实简单且优美,但是在看了其scala示例后,感觉写的比较死板,写起来很僵硬,没有python语言那么灵活,可能因为是在python的基础上封装的缘故,就像java的类库重写或封装成C#语言,也明显感觉不是那么舒服,更何况python是个弱类型语言。但是我觉得scala的代码其实也可以写的很优美,最近在码代码的过程中有个感觉就是实现功能很容易,但是要想代码写的漂亮看上去舒服甚至有艺术感就完全不是一件简单的事情。言归正传,我在用一个小时完成简单功能之后,又花了五六个小时进行了简单的重构、二次封装、完善,希望我的封装能用起来舒服一点,但是由于水平有限,也可能我只是画蛇添足,用起来可能还不如原来的,各位看官自行取舍。先发上几幅我做出来的效果图,各位看官可以提前有个感觉。

三、bokeh-scala基本代码
先来介绍如何使用bokeh-scala生成一个简单的图表。首先要引用其jar包,一般scala项目均采用sbt进行包管理,只需要在build.sbt文件中添加以下代码:
libraryDependencies += "io.continuum.bokeh" %% "bokeh" % "0.6"
引入之后就可以开始编写代码,首先需要定义一个数据源类,代码如下;
object source extends ColumnDataSource {

    val x = column(-2 * pi to 2 * pi by 0.1)

    val y = column(x.value.map(sin))

}
该类继承自ColumnDataSource类,很明显x、y分别代表x轴数据值范围以及x轴坐标点对应的y轴坐标数据,当然此类也可以包含多个属性,只需要在后续生成图表的时候选择对应的属性即可。本例中x为-2π到2π之间的范围,y为对应的sin值,一个简单的sin函数。
然后就是生成一个Plot对象:
val xdr = new DataRange1d

val ydr = new DataRange1d

val tools = Pan | WheelZoom

val plot = new Plot().x_range(xdr).y_range(ydr).tools(tools).width(width).height(height)
其中xdr、ydr赋值new DataRange1d表示图表的x、y方向为1维连续变化的数据。tools表示在图表上显示的工具:有平移、缩放等,此处bokeh建立了相当于其他语言中枚举的概念。然后使用new Plot()即可创建一个Plot对象,width和height表示宽和高。
有了Plot对象之后就可以生成其坐标轴,有线性、对数、时间等选择,我们以线性为例,生成坐标轴代码如下:
val axis = new LinearAxis.plot(plot).location(Location.Left)

plot.left <<= (axis :: _)
上述语句会生成一个线性的y轴。这里的第二句就是我觉得bokeh-scala代码看起来不舒服的地方,明明第一句已经为plot对象指明了位置Location.Left,却还要在第二句里再次为plot.left赋刚刚生成的值,后面还有好几处这样的例子,可能是我理解不到位。用同样的方法可以再生成x轴,只需要location赋值为Location.Below。
接下来可以使用val grid = new Grid().plot(plot).dimension(0).axis(axis)生成网格,其中axis是上一步生成的坐标轴,dimension控制方向。这里又是一处繁琐的地方,明明刚刚的axis已经是有方位的能区分x、y方向的,此处却还要显式的指明dimension,实在有点不太懂,也许是没能理解开发者的意图。
接下来才进入绘制的主题,根据上面的x、y数据范围绘制图形,这里选择很多,可以绘制圆点、线、文字等多种类型,在这里以原点为例,后面封装的代码中会再给出几种。绘制圆点的代码如下;
val circle = new Circle().x(x).y(y)

val circleGlyph = new GlyphRenderer().data_source(source).glyph(circle)
第一行的x、y就是source中对应的属性,如果没有事先import,需要使用全名称source.x,source就是上面定义的类,此处source是object类型的,所以此处直接传入,相当于单例。circleGlyph就是最终生成的图表中的一系列圆点。
接下来就是最关键的一步,将生成的坐标轴、网格、圆点等对象传递给plot。此处又是繁琐的地方,明明很多对象都是由plot生成的,为什么不能直接绑定给plot呢?不得其解。代码如下:
val renderers: (List[Renderer] => List[Renderer]) = (xaxis :: yaxis :: xgrid :: ygrid :: circleGlyph :: _)

plot.renderers <<= renderers
通过上述步骤就生成了一个完整的包含各种元素的plot,但是并没有显示出来,bokeh的显示在最开始翻译的描述中说的很清楚————要通过浏览器。最简单的方式就是直接渲染一个html文件,然后在浏览器中打开,代码如下:
val document = new Document(plot)

val html = document.save(path)

html.view()
其中path是生成的html文件存放的路径,这样就能直接将plot对象以图表的形式显示到浏览器当中。
四、我的封装
下面我将今天封装的代码贴在下面,供学习交流,又稍作修改,修改后如下:
1、BokehHelper.scala
package geotrellis.bokeh

import io.continuum.bokeh.{Line => BokehLine, _}

import scala.collection.immutable.{IndexedSeq, NumericRange}

/**

  * Created by shoufengwei on 2016/7/30.

  */

object BokehHelper {

  /**

    *

    * @param xdr

    * @param ydr

    * @param tools all Tools

    *              val panTool = new PanTool().plot(plot)

    *              val wheelZoomTool = new WheelZoomTool().plot(plot)

    *              val previewSaveTool = new PreviewSaveTool().plot(plot)

    *              val resetTool = new ResetTool().plot(plot)

    *              val resizeTool = new ResizeTool().plot(plot)

    *              val crosshairTool = new CrosshairTool().plot(plot)

    *              plot.tools := List(panTool, wheelZoomTool, previewSaveTool, resetTool, resizeTool, crosshairTool)

    * @param width

    * @param height

    */

  def getPlot(xdr: DataRange, ydr: DataRange, tools: List[Tool], width: Int = 800, height: Int = 400) = {

    new Plot().x_range(xdr).y_range(ydr).tools(tools).width(width).height(height)

  }

  def getLinearAxis(plot: Plot, position: Location): ContinuousAxis = {

    getAxis(plot, new LinearAxis, position)

  }

  /**

    * get datetime axis

    *

    * @param plot

    * @param position

    * @param formatter eg. new DatetimeTickFormatter().formats(Map(DatetimeUnits.Months -> List("%b %Y")))

    * @return

    */

  def getDatetimeAxis(plot: Plot, position: Location, formatter: DatetimeTickFormatter = new DatetimeTickFormatter().formats(Map(DatetimeUnits.Months -> List("%b %Y")))): ContinuousAxis = {

    getAxis(plot, new DatetimeAxis().formatter(formatter), position)

  }

  def getAxis(plot: Plot, axisType: ContinuousAxis, position: Location): ContinuousAxis = {

    val axis = axisType.plot(plot).location(position)

    setPlotAxis(plot, axis, position)

    setRenderer(plot, axis)

    axis

  }

  def setAxisLabel(axis: ContinuousAxis, axisLabel: String) = {

    axis.axis_label(axisLabel)

  }

  def setPlotAxis(plot: Plot, axis: ContinuousAxis, position: Location) {

    position match {

      case Location.Left => plot.left <<= (axis :: _)

      case Location.Above => plot.above <<= (axis :: _)

      case Location.Below => plot.below <<= (axis :: _)

      case Location.Right => plot.right <<= (axis :: _)

      case _ =>

    }

  }

  def getCircleGlyph(column_x: ColumnDataSource#Column[IndexedSeq, Double], column_y: ColumnDataSource#Column[IndexedSeq, Double], value: DataSource, size: Int = 5, fill_Color: Color = Color.Red, line_Color: Color = Color.Black) = {

    val circle = new Circle().x(column_x).y(column_y).size(size).fill_color(fill_Color).line_color(line_Color)

    getGlyphRenderer(value, circle)

  }

  def setCircleGlyph(plot: Plot, column_x: ColumnDataSource#Column[IndexedSeq, Double], column_y: ColumnDataSource#Column[IndexedSeq, Double], value: DataSource, size: Int = 5, fill_Color: Color = Color.Red, line_Color: Color = Color.Black) = {

    val circleGlyph = getCircleGlyph(column_x, column_y, value, size, fill_Color, line_Color)

    setRenderer(plot, circleGlyph).asInstanceOf[GlyphRenderer]

  }

  def getLineGlyph(column_x: ColumnDataSource#Column[IndexedSeq, Double], column_y: ColumnDataSource#Column[IndexedSeq, Double], value: DataSource, width: Int = 3, line_Color: Color = Color.Black) = {

    val line = new BokehLine().x(column_x).y(column_y).line_width(width).line_color(line_Color)

    getGlyphRenderer(value, line)

  }

  def setLineGlyph(plot: Plot, column_x: ColumnDataSource#Column[IndexedSeq, Double], column_y: ColumnDataSource#Column[IndexedSeq, Double], value: DataSource, width: Int = 3, line_Color: Color = Color.Black) = {

    val lineGlyph = getLineGlyph(column_x, column_y, value, width, line_Color)

    setRenderer(plot, lineGlyph).asInstanceOf[GlyphRenderer]

  }

  def getPatchGlyph(column_x: ColumnDataSource#Column[IndexedSeq, Double], column_y: ColumnDataSource#Column[IndexedSeq, Double], value: DataSource, width: Int = 3, fill_Color: Color = Color.Red, line_Color: Color = Color.Black) = {

    val patch = new Patch().x(column_x).y(column_y).line_width(width).line_color(line_Color).fill_color(fill_Color)

    getGlyphRenderer(value, patch)

  }

  def setPatchGlyph(plot: Plot, column_x: ColumnDataSource#Column[IndexedSeq, Double], column_y: ColumnDataSource#Column[IndexedSeq, Double], value: DataSource, width: Int = 3, fill_Color: Color = Color.Red, line_Color: Color = Color.Black) = {

    val patchGlyph = getPatchGlyph(column_x, column_y, value, width, fill_Color, line_Color)

    setRenderer(plot, patchGlyph).asInstanceOf[GlyphRenderer]

  }

  def getCircleCrossGlyph(column_x: ColumnDataSource#Column[IndexedSeq, Double], column_y: ColumnDataSource#Column[IndexedSeq, Double], value: DataSource, size: Int = 5, fill_Color: Color = Color.Red, line_Color: Color = Color.Black) = {

    val circleCross = new CircleCross().x(column_x).y(column_y).size(size).fill_color(fill_Color).line_color(line_Color)

    getGlyphRenderer(value, circleCross)

  }

  def setCircleCrossGlyph(plot: Plot, column_x: ColumnDataSource#Column[IndexedSeq, Double], column_y: ColumnDataSource#Column[IndexedSeq, Double], value: DataSource, size: Int = 5, fill_Color: Color = Color.Red, line_Color: Color = Color.Black) = {

    val circleCrossGlyph = getCircleCrossGlyph(column_x, column_y, value, size, fill_Color, line_Color)

    setRenderer(plot, circleCrossGlyph).asInstanceOf[GlyphRenderer]

  }

  def getTextGlyph(column_x: ColumnDataSource#Column[IndexedSeq, Double], column_y: ColumnDataSource#Column[IndexedSeq, Double], value: DataSource, size: Int = 5, fill_Color: Color = Color.Red, line_Color: Color = Color.Black) = {

    val text = new Text().x(column_x).y(column_y).text("1")

    getGlyphRenderer(value, text)

  }

  def setTextGlyph(plot: Plot, column_x: ColumnDataSource#Column[IndexedSeq, Double], column_y: ColumnDataSource#Column[IndexedSeq, Double], value: DataSource, size: Int = 5, fill_Color: Color = Color.Red, line_Color: Color = Color.Black) = {

    val textGlyph = getTextGlyph(column_x, column_y, value, size, fill_Color, line_Color)

    setRenderer(plot, textGlyph).asInstanceOf[GlyphRenderer]

  }

  def getGlyphRenderer(value: DataSource, glyph: Glyph) = {

    new GlyphRenderer().data_source(value).glyph(glyph)

  }

  /**

    *

    * @param legends eg.  val legends = List("y = sin(x)" -> List(lineGlyph, circleGlyph))

    */

  def getLegends(plot: Plot, legends: List[(String, List[GlyphRenderer])]): Legend = {

    val legend = new Legend().plot(plot).legends(legends)

    setRenderer(plot, legend)

    legend

  }

  def getLegends(plot: Plot, name: String, glyphList: List[GlyphRenderer]): Legend = {

    getLegends(plot, List(name -> glyphList))

  }

  /**

    *

    * @param plot

    * @param axis

    * @param dimension 0 means x and 1 means y

    * @return

    */

  def getGrid(plot: Plot, axis: ContinuousAxis, dimension: Int) = {

    val grid = new Grid().plot(plot).dimension(dimension).axis(axis)

    setRenderer(plot, grid)

    grid

  }

  def setRenderers(plot: Plot, renderers: List[Renderer] => List[Renderer]) = {

    plot.renderers <<= renderers

  }

  def setRenderer(plot: Plot, renderer: Renderer) = {

    val renderers: (List[Renderer] => List[Renderer]) = (renderer :: _)

    setRenderers(plot, renderers)

    renderer

  }

  /**

    * use this method just can plot one renderer

    *

    * @param plot

    * @param renderers

    */

  def setRenderers(plot: Plot, renderers: List[Renderer]) = {

    plot.renderers := renderers

  }

  /**

    * use gridplot Multiple plots in the document

    *

    * @param children every child List is one row   eg. val children = List(List(microsoftPlot, bofaPlot), List(caterPillarPlot, mmmPlot))

    * @return

    */

  def multiplePlots(children: List[List[Plot]], title: String = ""): Plot = {

    new GridPlot().children(children).title(title)

  }

  def save2Document(plot: Plot, path: String = "sample.html"): Unit = {

    val document = new Document(plot)

    val html = document.save(path)

    println(s"Wrote ${html.file}. Open ${html.url} in a web browser.")

    html.view()

  }

}
2、test.scala
package geotrellis.bokeh
import io.continuum.bokeh._
import io.continuum.bokeh.Tools._
import scala.collection.immutable.{IndexedSeq, NumericRange}
import math.{Pi => pi, sin}
/**
* Created by shoufengwei on 2016/7/29.
* http://bokeh.pydata.org/en/latest/docs/user_guide/quickstart.html
*/
object BokehTest extends App {
val xdr = new DataRange1d()
val ydr = new DataRange1d()
object source extends ColumnDataSource {
val x: ColumnDataSource#Column[IndexedSeq, Double] = column(-2 * pi to 2 * pi by 0.1)
val y = column(x.value.map(sin))
val z = column(x.value.map(Math.pow(2, _)))
val p = column(x.value.map(Math.pow(3, _)))
// val x = column(-10.0 to 10 by 0.1)
// val y = column(-10.0 to 5 by 0.1)
}
import source.{x, y, z, p}
// val plot = plotOne("全图")
// BokehHelper.save2Document(plot = plot)
val plot = plotMulitple()
BokehHelper.save2Document(plot)
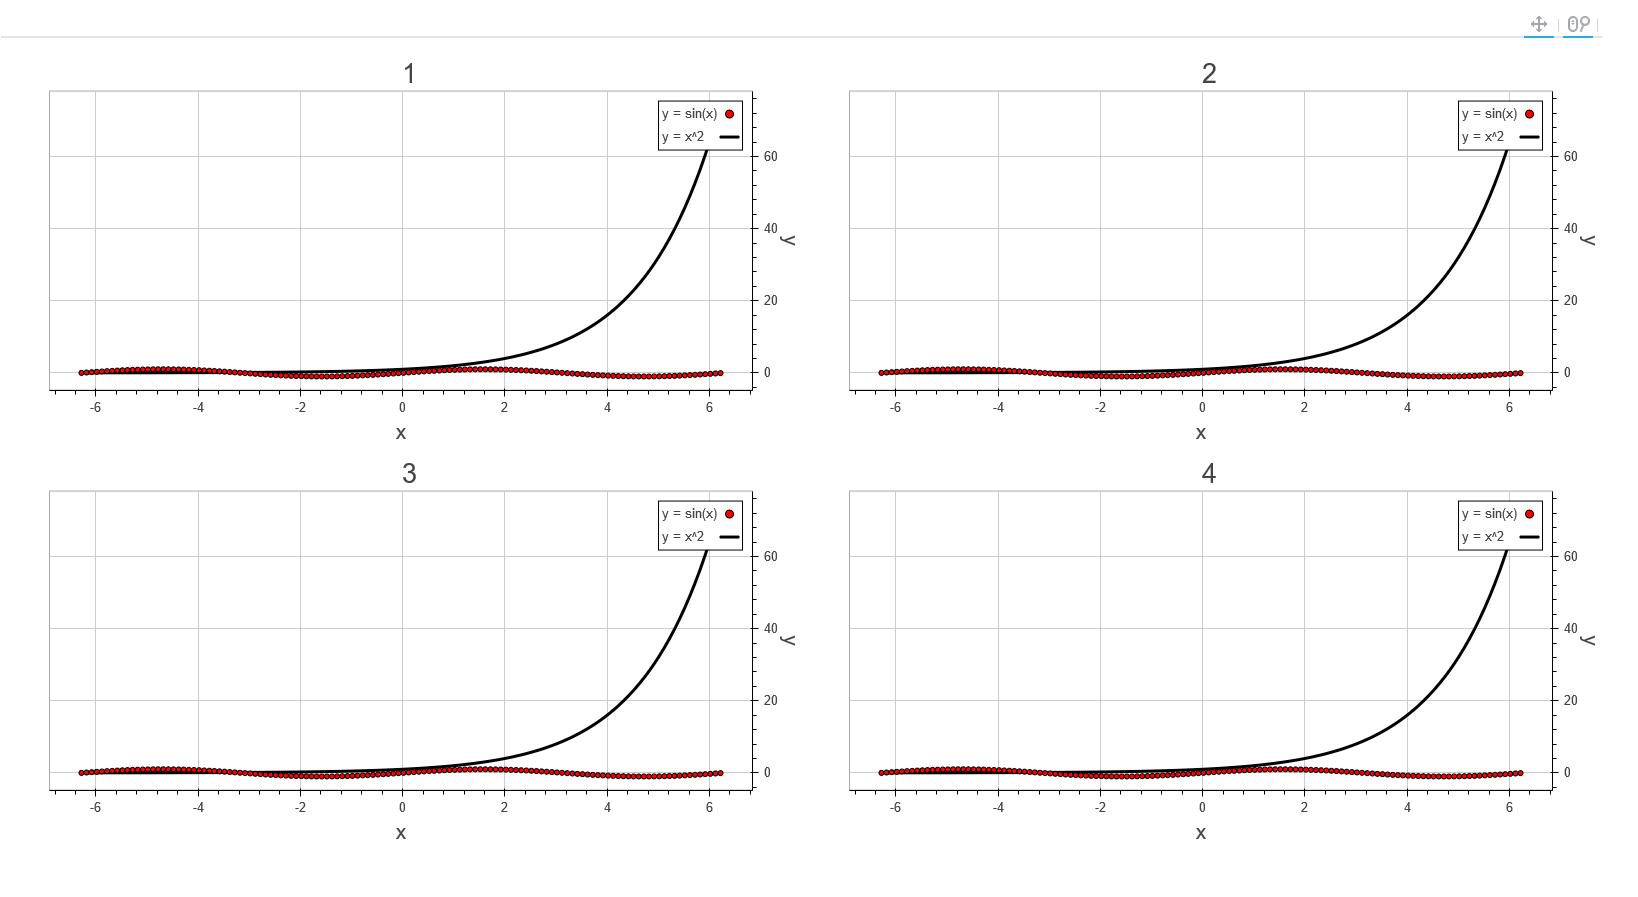
def plotMulitple() = {
val plot1 = plotOne("1")
val plot2 = plotOne("2")
val plot3 = plotOne("3")
val plot4 = plotOne("4")
BokehHelper.multiplePlots(List(List(plot1, plot2), List(plot3, plot4)), "all chart")
}
def plotOne(title: String = ""): Plot = {
val plot = BokehHelper.getPlot(xdr, ydr, Pan | WheelZoom | Crosshair)
plotBasic(plot)
val legend = plotContent(plot)
plotLegend(plot, legend)
plot.title(title)
}
def plotBasic(plot: Plot) = {
val xaxis = BokehHelper.getLinearAxis(plot, Location.Below)
BokehHelper.setAxisLabel(xaxis, "x")
val yaxis = BokehHelper.getLinearAxis(plot, Location.Right)
BokehHelper.setAxisLabel(yaxis, "y")
val xgrid = BokehHelper.getGrid(plot, xaxis, 0)
val ygrid = BokehHelper.getGrid(plot, yaxis, 1)
}
def plotContent(plot: Plot) = {
val circleGlyph = BokehHelper.setCircleGlyph(plot, x, y, source)
val lineGlyph = BokehHelper.setLineGlyph(plot, x, z, source)
val lineGlyph2 = BokehHelper.setLineGlyph(plot, x, y, source)
val patchGlyph = BokehHelper.setPatchGlyph(plot, x, p, source)
val circleCrossGlyph = BokehHelper.setCircleCrossGlyph(plot, x, p, source)
val textGlyph = BokehHelper.setTextGlyph(plot, x, z, source)
List("y = sin(x)" -> List(circleGlyph, lineGlyph2), "y = x^2" -> List(lineGlyph), "y = x^3" -> List(circleCrossGlyph, patchGlyph))
}
def plotLegend(plot: Plot, legends: List[(String, List[GlyphRenderer])]) = {
BokehHelper.getLegends(plot, legends)
}
}
此处我还是沿用了C#的习惯,各种Helper,也不知道scala中是否有更好的替代方案,或者设计模式之类。最近迷上了代码整洁之道,信奉的宗旨也是最好不写注释,当然我的水平还远远不够,所以如果上述代码有什么不明白的欢迎追问,当然如果有什么更好的代码整洁、重构、设计模式等方面的建议也请不吝赐教!以上代码test中的内容看官可以根据自己的需要自行修改!
五、总结
以上就是我总结的有关于bokeh-scala数据可视化的基础,本次并没有完全封装bokeh-scala的全部功能,后续会慢慢完善,更新该篇博客或者另设新篇。欢迎探讨、交流。
使用bokeh-scala进行数据可视化的更多相关文章
- 使用bokeh-scala进行数据可视化(2)
目录 前言 几种高级可视化图表 总结 一.前言 之前已经简单介绍过一次如何使用Bokeh-scala进行数据可视化(见使用bokeh-scala进行数据可视化),以及如何在Geotrel ...
- Spark GraphX 的数据可视化
概述 Spark GraphX 本身并不提供可视化的支持, 我们通过第三方库 GraphStream 和 Breeze 来实现这一目标 详细 代码下载:http://www.demodashi.com ...
- 【WaaCaa】一款开源科学作图/数据可视化工具 —— 诞生篇
作为一个理工男.用过了形形色色能够用于科学作图/数据可视化软件:从大学时做实验课推荐用于分析简单採集数据的 Origin; 毕业论文时用来呈现实验时序信号和离线分析脑电信号的 MATLAB.后面还发现 ...
- 数据可视化之Matplotlib的使用
1.什么是数据可视化 数据可视化在量化分析当中是一个非常关键的辅助工具,往往我们需要通过可视化技术,对我们的数据进行更清晰的展示,这样也能帮助我们理解交易.理解数据.通过数据的可视化也可以更快速的发现 ...
- Python数据可视化基础讲解
前言 本文的文字及图片来源于网络,仅供学习.交流使用,不具有任何商业用途,版权归原作者所有,如有问题请及时联系我们以作处理. 作者:爱数据学习社 首先,要知道我们用哪些库来画图? matplotlib ...
- 分形、分形几何、数据可视化、Python绘图
本系列采用turtle.matplotlib.numpy这三个Python工具,以分形与计算机图像处理的经典算法为实例,通过程序和图像,来帮助读者一步步掌握Python绘图和数据可视化的方法和技巧,并 ...
- 详解Python Streamlit框架,用于构建精美数据可视化web app,练习做个垃圾分类app
今天详解一个 Python 库 Streamlit,它可以为机器学习和数据分析构建 web app.它的优势是入门容易.纯 Python 编码.开发效率高.UI精美. 上图是用 Streamlit 构 ...
- Streamlit:快速数据可视化界面工具
目录 Streamlit简介 Streamlit使用指南 常用命令 显示文本 显示数据 显示图表 显示媒体 交互组件 侧边栏 缓存机制 Streamlit使用Hack Streamlit的替代品 相关 ...
- Webstorm+Webpack+echarts构建个性化定制的数据可视化图表&&两个echarts详细教程(柱状图,南丁格尔图)
Webstorm+Webpack+echarts ECharts 特性介绍 ECharts,一个纯 Javascript 的图表库,可以流畅的运行在 PC 和移动设备上,兼容当前绝大部分浏览器(I ...
随机推荐
- android开发中监控android软件网络请求的软件Charles使用入门
1.下载并安状软件,官网在此: http://www.charlesproxy.com/ 2.前题条件,电脑和手机必须在同一网段 3.在Charles界面选择菜单 proxy->proxy se ...
- Alamofire源码学习
Core文件夹: Alamofire.swift - - - 该文件中主要是给用户提供一些便利的调用方法,用户可以直接调用该文件中的便利方法来使用Alamofire相关功能. ...
- springMVC参数传递
web.xml文件 <?xml version="1.0" encoding="UTF-8"?><web-app xmlns:xsi=& ...
- 初识selenium--百度实例录制
Selenium 是一个web的自动化测试工具,不少学习功能自动化的朋友首选的就是Selenium,它相比QTP有许多优点(QTP笔者由于种种原因暂未使用过O(∩_∩)O哈!): ①Selenium是 ...
- mysql sql_safe_updates 不支持子查询的更新。
考虑到开发人员有时候不小心误更新数据,要求线上库的 MySQL 实例都设置 sql_safe_updates=1 来避免没有索引的 update.delete. 结果有一天开发发现下面的一个SQL 没 ...
- ubuntu共享文件配置
目标:实现windows和linux混合组成的操作 系统中可以共享文件,并可以通过机器名互相访问 安装文件共享服务 0.更改本机主机名,修改 /etc/hostname文件和/etc/hosts文件中 ...
- [ASE][Daily Scrum]11.28
昨天基本上已经完成了sprint2的task, 现在剩下一些bug还需要来修正, 然后我正式加入码代码的大军啦~ Shilin Liu 显示聊天框 Zhao Li 搭建聊天服务器 Yimin ...
- 微信公共平台开发-(.net实现)3--发送文本消息
最近,项目这边比较忙,没来得及续写,哎,先吐吐槽吧,在这个周六还得来上班,以后每个周六多要上,一天的滋味真有点受不鸟呀.还不习惯ing... 嗯,别的不说了现在开始接着上次http://www.cnb ...
- RCP:拖拽功能的实现 Drag and Drop
SWT中的拖拽是使用的org.eclipse.swt.dnd. 有三个需要密切注意的类: 1.DragSource 2.DropTarget 3.Transfer DragSource封装了需要被拖拽 ...
- node(规则引擎)
本文主要记录node的下的一个开源规则引擎nools,给出简单的实例,github地址为: https://github.com/C2FO/nools 定义规则引擎(test.nools) defin ...