Nagios监控服务
Nagios监控服务
1 案例1:常用系统监控命令
1.1 问题
本案例要求练习常用的系统监控命令完成以下任务:
- 使用vmstat命令监控内存及磁盘I/O信息
- 使用iostat命令监控CPU处理器及磁盘的I/O信息
- 使用sar命令监控系统最近的CPU/内存等活动
1.2 步骤
实现此案例需要按照如下步骤进行。
步骤一:使用vmstat命令监控内存及磁盘I/O信息
1)报告内存、交换分区、CPU等活动信息,每2秒更新一次数据
- [root@svr7 ~]# vmstat 2
- procs -----------memory---------- ---swap-- -----io---- -system-- ------cpu-----
- r b swpd free buff cache si so bi bo in cs us sy id wa st
- 2 0 0 1447960 1204 331260 0 0 422 9 59 153 1 1 98 0 0
- 0 0 0 1447944 1204 331260 0 0 0 0 9 12 0 0 100 0 0
- 0 0 0 1447944 1204 331260 0 0 0 0 9 12 0
- .. ..
2)报告一次磁盘的I/O信息
- [root@svr7 ~]# vmstat -d
- disk- ------------reads------------ ------------writes----------- -----IO------
- total merged sectors ms total merged sectors ms cur sec
- vda 7863 12 576137 2560 1427 25 12085 6142 0 3
- sr0 11 0 88 3 0 0 0 0 0 0
- dm-0 6529 0 562281 2503 356 0 7989 6480 0 3
- dm-1 141 0 2536 7 0 0 0 0 0 0
3)报告一次指定分区的I/O信息
- [root@svr7 ~]# vmstat -p /dev/vda1
- vda1 reads read sectors writes requested writes
- 1010 8792 1025 4096
步骤二:使用iostat命令监控CPU处理器及磁盘的I/O信息
1)报告一次CPU和磁盘I/O信息
- [root@svr7 ~]# iostat
- Linux 3.10.0-327.el7.x86_64 (svr7.tedu.cn) 2017年05月03日 _x86_64_ (1 CPU)
- avg-cpu: %user %nice %system %iowait %steal %idle
- 0.77 0.00 0.71 0.05 0.00 98.47
- Device: tps kB_read/s kB_wrtn/s kB_read kB_wrtn
- vda 9.85 304.60 6.45 288160 6103
- scd0 0.01 0.05 0.00 44 0
- dm-0 7.30 297.28 4.29 281232 4055
- dm-1 0.15 1.34 0.00 1268 0
2)报告CPU和磁盘I/O信息,每2秒钟采样一次
- [root@svr7 ~]# iostat 2
- Linux 3.10.0-327.el7.x86_64 (svr7.tedu.cn) 2017年05月03日 _x86_64_ (1 CPU)
- avg-cpu: %user %nice %system %iowait %steal %idle
- 0.66 0.00 0.61 0.05 0.00 98.68
- Device: tps kB_read/s kB_wrtn/s kB_read kB_wrtn
- vda 8.42 259.61 5.62 288168 6235
- scd0 0.01 0.04 0.00 44 0
- dm-0 6.25 253.37 3.77 281240 4187
- dm-1 0.13 1.14 0.00 1268 0
- avg-cpu: %user %nice %system %iowait %steal %idle
- 0.00 0.00 0.00 0.00 0.00 100.00
- Device: tps kB_read/s kB_wrtn/s kB_read kB_wrtn
- vda 0.00 0.00 0.00 0 0
- scd0 0.00 0.00 0.00 0 0
- dm-0 0.00 0.00 0.00 0 0
- dm-1 0.00 0.00 0.00 0 0
- .. ..
步骤三:使用sar命令监控系统最近的CPU/内存等活动
1)查看一次最近的系统活动完整(-A)报告
- [root@svr7 ~]# sar -A
- Linux 3.10.0-327.el7.x86_64 (svr7.tedu.cn) 2017年05月03日 _x86_64_ (1 CPU)
- 11时20分01秒
- CPU %usr %nice %sys %iowait %steal %irq %soft %guest %gnice %idle
- 11时30分01秒 all 0.17 0.00 0.11 0.01 0.00 0.00 0.00 0.00 0.00 99.71
- 11时30分01秒 0 0.17 0.00 0.11 0.01 0.00 0.00 0.00 0.00 0.00 99.71
- 平均时间: all 0.17 0.00 0.11 0.01 0.00 0.00 0.00 0.00 0.00 99.71
- 平均时间: 0 0.17 0.00 0.11 0.01 0.00 0.00 0.00 0.00 0.00 99.71
- 11时20分01秒 proc/s cswch/s
- 11时30分01秒 0.39 23.27
- 平均时间: 0.39 23.27
- 11时20分01秒 pswpin/s pswpout/s
- 11时30分01秒 0.00 0.00
- 平均时间: 0.00 0.00
- 11时20分01秒 pgpgin/s pgpgout/s fault/s majflt/s pgfree/s pgscank/s pgscand/s pgsteal/s %vmeff
- 11时30分01秒 6.30 0.35 165.40 0.03 133.94 0.00 0.00 0.00 0.00
- 平均时间: 6.30 0.35 165.40 0.03 133.94 0.00 0.00 0.00 0.00
- 11时20分01秒 tps rtps wtps bread/s bwrtn/s
- 11时30分01秒 0.38 0.27 0.11 12.59 0.70
- 平均时间: 0.38 0.27 0.11 12.59 0.70
- 11时20分01秒 frmpg/s bufpg/s campg/s
- 11时30分01秒 -4.90 0.00 1.37
- 平均时间: -4.90 0.00 1.37
- 11时20分01秒 kbmemfree kbmemused %memused kbbuffers kbcached kbcommit %commit kbactive kbinact kbdirty
- 11时30分01秒 1444844 604264 29.49 1204 277020 1547884 37.33 249044 241260 0
- 平均时间: 1444844 604264 29.49 1204 277020 1547884 37.33 249044 241260 0
- 11时20分01秒 kbswpfree kbswpused %swpused kbswpcad %swpcad
- 11时30分01秒 2097148 0 0.00 0 0.00
- 平均时间: 2097148 0 0.00 0 0.00
- .. ..
2)报告CPU活动信息,以5秒为间隔再采用3次
- [root@svr7 ~]# sar -u 5 3
- Linux 3.10.0-327.el7.x86_64 (svr7.tedu.cn) 2017年05月03日 _x86_64_ (1 CPU)
- 11时44分20秒 CPU %user %nice %system %iowait %steal %idle
- 11时44分25秒 all 0.00 0.00 0.00 0.00 0.00 100.00
- 11时44分30秒 all 0.00 0.00 0.00 0.00 0.00 100.00
- 11时44分35秒 all 0.00 0.00 0.00 0.00 0.00 100.00
- 平均时间: all 0.00 0.00 0.00 0.00 0.00 100.00
3)报告最近的磁盘I/O信息
- [root@svr7 ~]# sar -b
- Linux 3.10.0-327.el7.x86_64 (svr7.tedu.cn) 2017年05月03日 _x86_64_ (1 CPU)
- .. ..
- 11时20分01秒 tps rtps wtps bread/s bwrtn/s
- 11时30分01秒 0.38 0.27 0.11 12.59 0.70
- 11时40分01秒 0.25 0.13 0.12 15.62 0.93
- 平均时间: 0.31 0.20 0.11 14.11 0.81
案例2:搭建nagios监控服务器
2.1 问题
本案例要求搭建一台nagios监控服务器,确认Web界面可用:
- 安装nagios、nagios-plugins软件包
- 配置及访问web界面,将管理用户/密码均设为 nagiosadmin
2.2 步骤
实现此案例需要按照如下步骤进行。
步骤一:安装前的准备工作
1)安装网站平台环境、编译工具
- [root@svr7 ~]# yum -y install httpd php gd
- [root@svr7 ~]# yum -y install gcc glibc glibc-common
2)创建运行账号
- [root@svr7 ~]# groupadd nagcmd
- [root@svr7 ~]# useradd -G nagcmd nagios
- [root@svr7 ~]# gpasswd -a apache nagcmd
步骤二:编译安装nagios及nagios-plugins
1)安装nagios
- [root@svr7 ~]# tar xf ~/nagios-4.3.1.tar.gz -C /usr/src/
- [root@svr7 ~]# cd /usr/src/nagios-4.3.1/
- [root@svr7 nagios-4.3.1]# ./configure --with-command-group=nagcmd
- [root@svr7 nagios-4.3.1]# make all //编译
- [root@svr7 nagios-4.3.1]# make install //安装程序
- [root@svr7 nagios-4.3.1]# make install-init //安装控制脚本
- [root@svr7 nagios-4.3.1]# make install-config //安装配置
- [root@svr7 nagios-4.3.1]# make install-commandmode //调权限
- [root@svr7 nagios-4.3.1]# make install-webconf //部署网站配置
- [root@svr7 nagios-4.3.1]# chkconfig --add nagios //加载服务配置
2)安装nagios-plugins
- [root@svr7 ~]# tar xf ~/nagios-plugins-2.1.4.tar.gz -C /usr/src/
- [root@svr7 ~]# cd /usr/src/nagios-plugins-2.1.4/
- [root@svr7 nagios-plugins-2.1.4]# ./configure --with-nagios-user=nagios --with-nagios-group=nagcmd
- [root@svr7 nagios-plugins-2.1.4]# make
- [root@svr7 nagios-plugins-2.1.4]# make install
步骤三:启用及访问Nagios平台
1)为Nagios平台添加Web管理用户
- [root@svr7 ~]# htpasswd -c /usr/local/nagios/etc/htpasswd.users nagiosadmin //建Web管理用户
2)启用nagios、httpd服务
- [root@svr7 ~]# systemctl restart nagios //启用nagios
- [root@svr7 ~]# systemctl restart httpd //启用Web
3)访问nagios网页界面
firefox http://服务器地址/nagios/,如图-1所示。
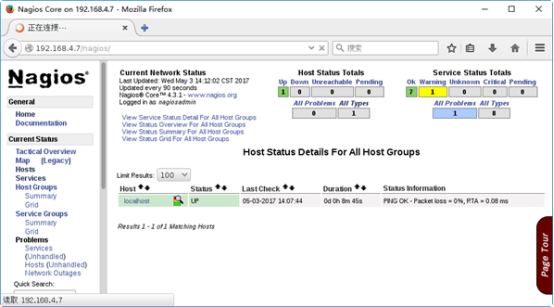
图-1
案例3:配置文件及插件使用
3.1 问题
本案例要求熟悉nagios的常用插件程序,完成以下任务:
- 使用插件 check_http 检测本机的Web端口
- 使用插件 check_tcp 检测本机的FTP服务端口
- 使用插件 check_disk 检测本机根分区使用率:可用空间低于80%报 WARNING,可用空间低于60%报 CRITICAL
3.2 步骤
实现此案例需要按照如下步骤进行。
步骤一:使用插件 check_http 检测本机的Web端口
1)关闭本机的httpd服务,执行check_http检查
- [root@svr7 ~]# /usr/local/nagios/libexec/check_http -H localhost -p 80connect to address localhost and port 80: 拒绝连接
- HTTP CRITICAL - Unable to open TCP socket
2)启动本机的httpd服务,并建立默认首页index.html
- [root@svr7 ~]# vim /var/www/html/index.html
- Default site.
- [root@svr7 ~]# systemctl restart httpd
3)再次执行check_http检查
- [root@svr7 ~]# /usr/local/nagios/libexec/check_http -H localhost -p 80
- HTTP OK: HTTP/1.1 200 OK - 302 bytes in 0.006 second response time |time=0.006236s;;;0.000000 size=302B;;;0
步骤二:使用插件check_tcp检测本机的FTP服务端口
1)未启动FTP服务时,执行check_ftp检查
- [root@svr7 ~]# /usr/local/nagios/libexec/check_ftp -H localhost -p 21
- connect to address localhost and port 21: 拒绝连接
2)安装及启动vsftpd服务以后,再次执行check_ftp检查
- [root@svr7 ~]# yum -y install vsftpd
- [root@svr7 ~]# systemctl restart vsftpd
- [root@svr7 ~]# /usr/local/nagios/libexec/check_ftp -H localhost -p 21
- FTP OK - 0.002 second response time on localhost port 21 [220 (vsFTPd 3.0.2)]|time=0.002164s;;;0.000000;10.000000
步骤三:使用插件check_disk检测本机/boot分区使用率
1)查看/boot目录所在分区的使用率
- [root@svr7 ~]# df -hT /boot
- 文件系统 类型 容量 已用 可用 已用% 挂载点
- /dev/vda1 xfs 497M 140M 358M 29% /boot
2)使用check_disk检查
可用空间低于80%报 WARNING,可用空间低于60%报 CRITICAL
- [root@svr7 ~]# /usr/local/nagios/libexec/check_disk -w 80% -c 60% -p /boot
- DISK WARNING - free space: /boot 357 MB (71% inode=99%);| /boot=139MB;99;198;0;496
3)查看实际使用率情况,调低阈值再次check_disk测试
- [root@svr7 ~]# /usr/local/nagios/libexec/check_disk -w 60% -c 40% -p /boot
- DISK OK - free space: /boot 357 MB (71% inode=99%);| /boot=139MB;297;198;0;496
案例4:监控远程主机的公有数据
4.1 问题
本案例要求在Nagios平台上添加对远程主机pc207的监控,主要包括下列服务:
- ping连通状态
- Web服务
- FTP服务
- SSH服务
4.2 步骤
实现此案例需要按照如下步骤进行。
步骤一:准备被监控主机pc207
1)正确配置IP地址,确保与主机svr7可相互ping通
- [root@pc207 ~]# ping 192.168.4.7
- PING 192.168.4.7 (192.168.4.7) 56(84) bytes of data.
- 64 bytes from 192.168.4.7: icmp_seq=1 ttl=64 time=0.621 ms
- 64 bytes from 192.168.4.7: icmp_seq=2 ttl=64 time=0.427 ms
- .. ..
2)确保已启用httpd、vsftpd、sshd服务,并关闭防火墙服务firewalld
- [root@pc207 ~]# yum -y install httpd vsftpd
- .. ..
- [root@pc207 ~]# systemctl restart httpd vsftpd sshd
- [root@pc207 ~]# systemctl disable firewalld --now
步骤二:配置监控服务器svr7
1)新建监控配置pc207.cfg,定义监控目标(主机、服务)
- [root@svr7 ~]# vim /usr/local/nagios/etc/objects/pc207.cfg
- define host {
- use linux-server
- host_name pc207
- address 172.25.0.10
- }
- define service {
- use local-service
- host_name pc207
- service_description PING
- check_command check_ping!100.0,20%!500.0,60%
- }
- define service {
- use local-service
- host_name pc207
- service_description Web Server
- check_command check_http
- }
- define service {
- use local-service
- host_name pc207
- service_description FTP Server
- check_command check_ftp
- }
- define service {
- use local-service
- host_name pc207
- service_description SSH Server
- check_command check_ssh
- }
2)调整nagios.cfg,启用pc207.cfg监控配置
- [root@svr7 ~]# vim /usr/local/nagios/etc/nagios.cfg
- .. ..
- cfg_file=/usr/local/nagios/etc/objects/pc207.cfg
3)重启nagios服务
- [root@svr7 ~]# systemctl restart nagios
步骤三:刷新Nagios管理界面,确认新增主机pc207的监控结果
1)确认Hosts下新增的主机,如图-2所示
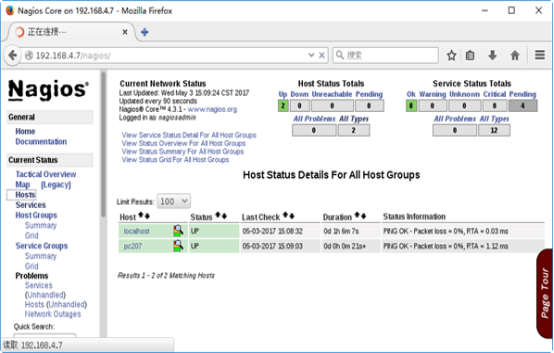
图-2
2)确认Services下新增的服务信息,如图-3所示
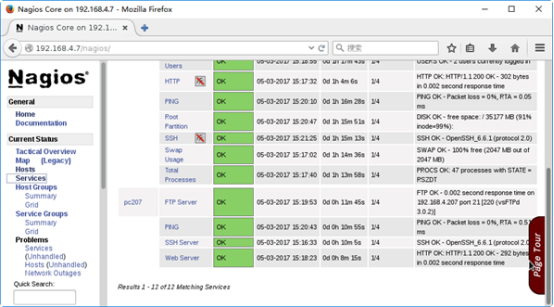
图-3
案例5:监控远程主机的私有数据
5.1 问题
本案例要求在Nagios服务器上添加对远程主机pc207上私有数据的监控,完成以下监控项目:
- 运行的进程数
- 登录的用户数
- CPU负载
- 根分区使用量
5.2 方案
Linux主机的内存信息、磁盘I/O信息等私有数据默认不对外提供,若希望从Nagios监控平台获取远程主机的私有数据,需要在被监控主机上配置启用nrpe服务。
主要工作结构:Nagios监控端(check_nrpe插件) ==> 被监控端(nrpe服务),如图-4所示。

图-4
5.3 步骤
实现此案例需要按照如下步骤进行。
步骤一:准备被监控主机pc207
1)安装nagios-plugins插件
- [root@pc207 ~]# yum -y install gcc glibc glibc-common
- [root@pc207 ~]# groupadd nagcmd
- [root@pc207 ~]# useradd -G nagcmd nagios
- [root@pc207 ~]# tar xf ~/nagios-plugins-2.1.4.tar.gz -C /usr/src/
- [root@pc207 ~]# cd /usr/src/nagios-plugins-2.1.4/
- [root@pc207 nagios-plugins-2.1.4]# ./configure --with-nagios-user=nagios --with-nagios-group=nagcmd
- [root@pc207 nagios-plugins-2.1.4]# make
- [root@pc207 nagios-plugins-2.1.4]# make install
2)安装nrpe
- [root@pc207 ~]# yum -y install openssl-devel //安装SSL头文件
- [root@pc207 ~]# tar xf nrpe-3.1.0.tar.gz -C /usr/src/
- [root@pc207 ~]# cd /usr/src/nrpe-3.1.0/
- [root@pc207 nrpe-3.1.0]# ./configure
- [root@pc207 nrpe-3.1.0]# make all //编译所有
- [root@pc207 nrpe-3.1.0]# make install //安装nrpe及插件
- [root@pc207 nrpe-3.1.0]# make install-init //安装服务
- [root@pc207 nrpe-3.1.0]# make install-config //安装配置文件
3)定义nrpe监控命令
- [root@pc207 ~]# vim /usr/local/nagios/etc/nrpe.cfg
- .. ..
- allowed_hosts=172.25.0.0/24,127.0.0.1,::1 //允许哪些主机
- command[check_users]=/usr/local/nagios/libexec/check_users -w 5 -c 10
- command[check_load]=/usr/local/nagios/libexec/check_load -w 15,10,5 -c 30,25,20
- command[check_rootdir]=/usr/local/nagios/libexec/check_disk -w 20% -c 10% -p /
- command[check_zombie_procs]=/usr/local/nagios/libexec/check_procs -w 150 -c 200 -s Z
- command[check_total_procs]=/usr/local/nagios/libexec/check_procs -w 150 -c 200
4)启用nrpe服务并测试
- [root@pc207 ~]# systemctl restart nrpe
- [root@pc207 ~]# systemctl enable nrpe
- .. ..
- [root@pc207 ~]# /usr/local/nagios/libexec/check_nrpe -H localhost
- NRPE v3.1.0-rc1 //测试连本机nrpe服务
步骤二:配置Nagios监控服务器
1)为Nagios安装check_nrpe插件
- [root@svr7 ~]# yum -y install openssl-devel
- [root@svr7 ~]# tar xf nrpe-3.1.0.tar.gz -C /usr/src/
- [root@svr7 ~]# cd /usr/src/nrpe-3.1.0/
- [root@svr7 nrpe-3.1.0]# ./configure
- [root@svr7 nrpe-3.1.0]# make all //编译所有
- [root@svr7 nrpe-3.1.0]# make install-plugin //安装check_nrpe插件
2)测试连远程的nrpe服务,并添加远程nrpe监控指令
- [root@svr7 ~]# /usr/local/nagios/libexec/check_nrpe -H 172.25.0.10
- NRPE v3.1.0-rc1 //测试连远程 的nrpe服务
- [root@svr7 ~]# vim /usr/local/nagios/etc/objects/commands.cfg
- .. ..
- define command{
- command_name check_nrpe
- command_line $USER1$/check_nrpe -H $HOSTADDRESS$ -c $ARG1$
- //-c 要求对方执行的命令
- }
3)修改监控目标配置pc207.cfg,添加对远程主机pc207私有数据的获取
- [root@svr7 ~]# vim /usr/local/nagios/etc/objects/pc207.cfg
- .. ..
- define service {
- use local-service
- host_name pc207
- service_description NRPE-Total Procs
- check_command check_nrpe!check_total_procs
- }
- define service {
- use local-service
- host_name pc207
- service_description NRPE-Users
- check_command check_nrpe!check_users
- }
步骤三:刷新Nagios管理界面,确认主机pc207的私有数据监控结果
确认pc207主机及服务监控结果,如图-5所示。
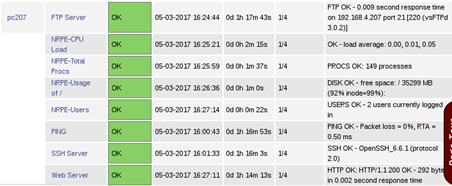
图-5
Nagios监控服务的更多相关文章
- 通过Nagios监控weblogic服务
1.前言 前段时间搭建了一套Nagios监控服务,心血来潮想自己写一个脚本,拓展Nagios插件来监控公司的weblogic服务. 环境:weblogic10.3.3.0 . CentOS6 ...
- 一步步实现Nagios监控linux主机及飞信报警
一步步实现Nagios监控linux主机及飞信报警 上篇文章介绍了在linux主机上架设nagios监控服务,并对windows主机进行服务状态变化的监控,这次我们继续上次内容. 首先实现n ...
- 自动安装脚本-------------基于LVMP搭建Nagios 监控
Mysql初始化参数(mysql-5.6.31) /usr/local/mysql/scripts/mysql_install_db --user=mysql --basedir=/usr/local ...
- linux Nagios监控
监控目标 监控目标主机分为四个部分 硬件资源 操作系统 数据库 应用软件 监控目的: 进行服务器性能调整前,知道调整什么,系统瓶颈在什么地方 被一部分必须同时监控,内容包括吞吐量,反应时间,使用率等 ...
- Nagios监控系统部署(源码)
1. 概述2. 部署Nagios2.1 创建Nagios用户组2.2 下载Nagios和Nagios-plugin源码2.3 编译安装3. 部署Nagios-plugin3.1 编译安装nagios- ...
- 【nagios监控】基于linux搭建nagios监控
nagios工作原理 nagios的功能是监控服务和主机,但是其自身并不包括这些功能,所有的监控.检测功能都是通过各种插件来完成的. 启动nagios后,它会周期性的自动调用插件去检测服务器状态,同时 ...
- Nagios监控系统部署(源码)(四)
Nagios监控系统部署(源码) 1. 概述2. 部署Nagios2.1 创建Nagios用户组2.2 下载Nagios和Nagios-plugin源码2.3 编译安装3. 部署Nagios-pl ...
- nagios监控远程主机服务可能出现的问题
1.使用插件NRPE监控命令不存在 在添加服务的时候,命令配置文件中需要传递一个参数,那么在监控服务配置文件中,需要添加一个!表示后面的为参数. 出现未定义的命令,查看被监控主机上的配置文件,添加监控 ...
- Nagios监控lvs服务
1在lvs server上安装nrpe客户端: 1.1,rpm方式安装nrpe客户端 下载地址:http://download.csdn.net/detail/mchdba/7493875 [root ...
随机推荐
- AspNetCore3.1源码解析_2_Hsts中间件
title: "AspNetCore3.1源码解析_2_Hsts中间件" date: 2020-03-16T12:40:46+08:00 draft: false --- 概述 在 ...
- sklearn-转换器与机器学习流程
一.sklearn估计器 二.机器学习开发流程 .
- java-Properties集合。
查看手册: 关键字: store() 储存. setProperty("",""); 添加. FileWriter("D:\\ja.propertie ...
- VMware 虚拟机正在使用中
1.出现报错信息: 2.找到安装目录下面的.lck后缀文件夹(如有多个则全部删除) 3.删除此文件夹 4.成功开启虚拟机
- 曹工说Spring Boot源码(25)-- Spring注解扫描的瑞士军刀,ASM + Java Instrumentation,顺便提提Jar包破解
写在前面的话 相关背景及资源: 曹工说Spring Boot源码(1)-- Bean Definition到底是什么,附spring思维导图分享 曹工说Spring Boot源码(2)-- Bean ...
- [Docker7]Harbor
harbor download harbor offline tar package wget https://github.com/vmware/harbor/releases/download/v ...
- DOM中获取元素的节点兼容IE6-8封装,带jquery源码分析children
<ul id="box"> <li>第一个节点</li> <li>第二个节点</li> <li>第三个节点& ...
- 洛谷 P5596 【XR-4】题 题解
原题链接 本题只要 推式子 就可以了. \[y^2-x^2=ax + b \] \[a x + x^2 = y^2 - b \] \[4 x^2 + 4 ax = 4 y^2 - 4b \] \[(2 ...
- Python第六章-函数04-递归函数和拉姆达表达式
五.递归函数 什么叫递归(recusive)? 你拿两个镜子互相面对着, 然后去看镜子, 会发现每个镜子中很多个镜子, 层层的嵌套, 无穷尽, 这就是一种递归! 从前有坐山, 山里有座庙, 庙里有个老 ...
- postman设置全局变量及参数化
笔者第一次记录使用过程,仅供参考 测试过程中接口的前缀都是一样的,所以我们可以将这个前缀作为全局变量来使用 首先,打开postman点击这里的小齿轮设置 在这里就可以进行变量的一个添加,添加好之后记住 ...