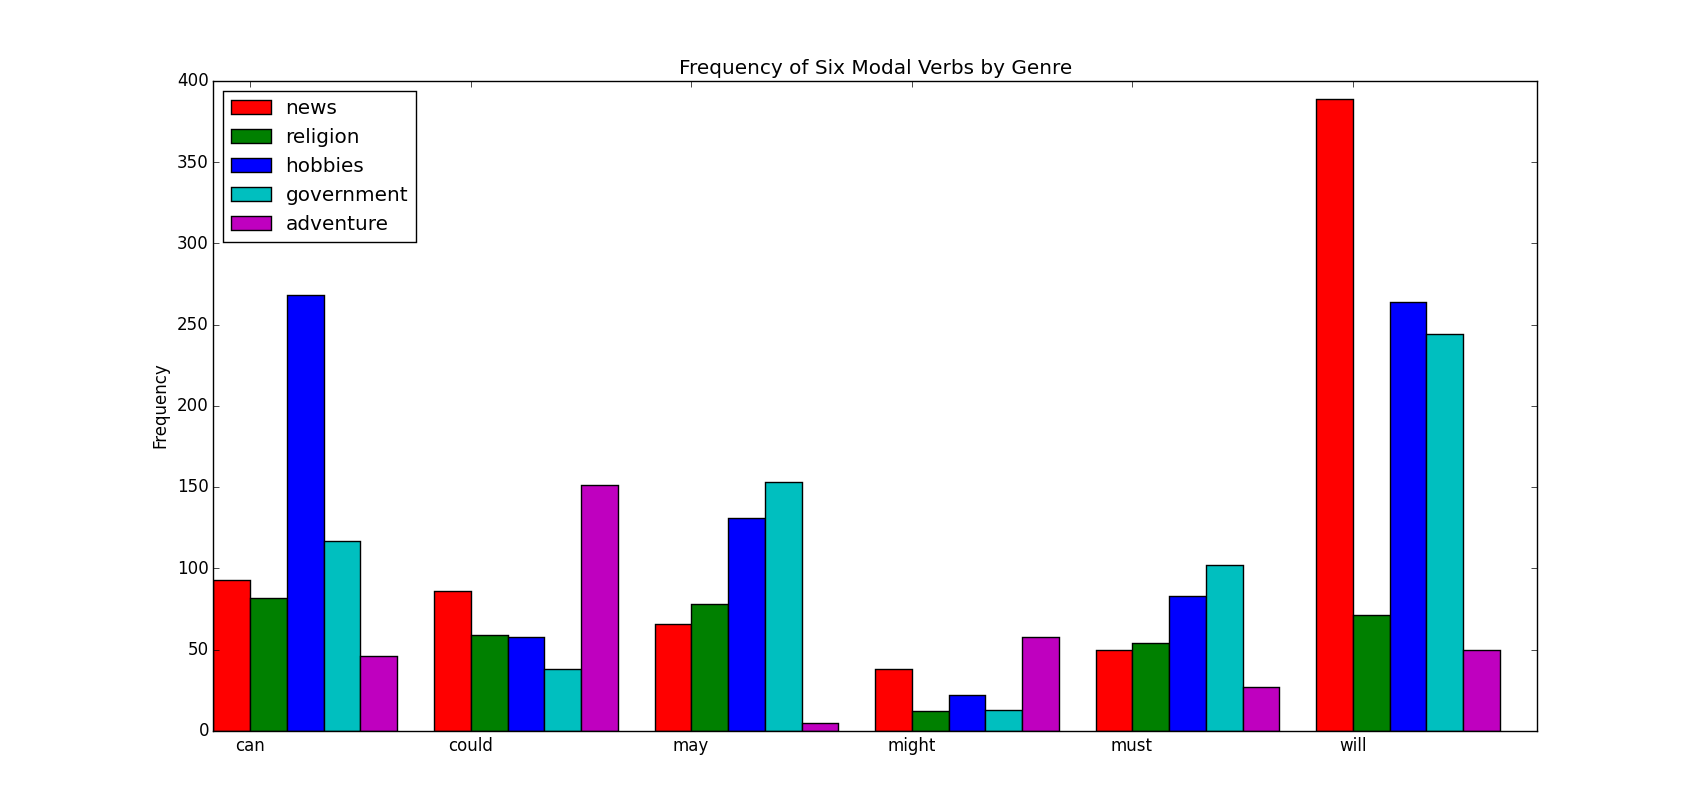
Bar Chart of Frequency of modals in different sections of the Brown Corpus
Natural Language Processing with Python
Chapter 4.8
 colors = 'rgbcmyk' # red, green, blue, cyan, magenta, yellow, black

 def bar_chart(categories, words, counts):

     "Plot a bar chart showing counts for each word by category"

     import pylab

     ind = pylab.arange(len(words))

     width = 0.1*1 / (len(categories) + 1)*10

     bar_groups = []

     for c in range(len(categories)):

         bars = pylab.bar(ind+c*width, counts[categories[c]], width,

                         color=colors[c % len(colors)])

         bar_groups.append(bars)

     pylab.xticks(ind+width, words)

     pylab.legend([b[0] for b in bar_groups], categories, loc='upper left')

     pylab.ylabel('Frequency')

     pylab.title('Frequency of Six Modal Verbs by Genre')

     pylab.show()

 def test_bar_char():

     genres = ['news', 'religion', 'hobbies', 'government', 'adventure']

     modals = ['can', 'could', 'may', 'might', 'must', 'will']

     cfdist = nltk.ConditionalFreqDist(

                 (genre, word)

                 for genre in genres

                 for word in nltk.corpus.brown.words(categories=genre)

                 if word in modals)

     counts = {}

     for genre in genres:

         counts[genre] = [cfdist[genre][word] for word in modals]

     bar_chart(genres, modals, counts)
修改了width,结果为:
Bar Chart of Frequency of modals in different sections of the Brown Corpus的更多相关文章
- Relative-Frequency|frequency|pie chart |bar chart
2.2Organizing Qualitative Data The number of times a particular distinct value occurs is called its ...
- Highcharts - Bar Chart & Column Chart
1. 条形图(Bar Chart)需要的数据格式类型如下: ["Luke Skywalker", "Darth Vader", "Yoda" ...
- Matplotlib之Bar Chart
Matplotlib之Bar Chart: import numpy as np import matplotlib.pyplot as plt data = [[300, 200, 250, 150 ...
- bubble chart|Matrix Scatter|Overlay Scatter|Scatterplots|drop-line|box plot|Stem-and-leaf plot|Histogram|Bar chart|Pareto chart|Pie chart|doughnut chart|
应用统计学 对类别数据要分类处理: Bar chart复式条形图便于对比: Pareto chart:对类别变量依据频数高低排列: Pie chart:饼图用于一个样本,可以区分类别数据 doughn ...
- 转 HighCharts笔记之: Bar Chart
最近需要做一些Web图标,研究了几个开源的第三方工具后,最后决定使用HighCharts开发: Highcharts 是一个用纯JavaScript编写的一个图表库, 能够很简单便捷的在web网站或是 ...
- matplotlib 柱状图 Bar Chart 样例及参数
def bar_chart_generator(): l = [1,2,3,4,5] h = [20, 14, 38, 27, 9] w = [0.1, 0.2, 0.3, 0 ...
- Bar Chart _Study
---恢复内容开始--- 以“3D BarChart”为例. 1.Select a theme.(选择一个主题模板) 2.Set up categories and groups.(设置类型和组) 3 ...
- plot bar chart using python
Example import matplotlib.pyplot as plt import plotly.plotly as py # Learn about API authentication ...
- Matplotlib学习---用matplotlib画柱形图,堆积柱形图,横向柱形图(bar chart)
这里利用Nathan Yau所著的<鲜活的数据:数据可视化指南>一书中的数据,学习画图. 数据地址:http://datasets.flowingdata.com/hot-dog-cont ...
随机推荐
- ref与out之间的区别整理 摘自与望楼http://blog.csdn.net/xiaoning8201/article/details/6893154
ref和out都是C#中的关键字,所实现的功能也差不多,都是指定一个参数按照引用传递. 对于编译后的程序而言,它们之间没有任何区别,也就是说它们只有语法区别. 总结起来,他们有如下语法区别: .ref ...
- 最佳死链接href= "#" VS href= "javascript:void(0);"
href= "#" 熟悉hash跳转的同学都知道,只是一个hash跳转,跳转到页面的顶部,可以发现地址栏多了一个#,点击返回会返回本页面. href= "javascri ...
- [maven] 新建项目一直提示loading archetype list
Maven's JRE is running out of memory. Under Build > Build Tools > Maven > Importing, set &q ...
- MP3拷贝程序---字节流
package cn.itcast.p7.io.bytestream.test; import java.io.BufferedInputStream; import java.io.Buffered ...
- eclipse Dynamic web project 工程目录
如图,我创建了一个work 的web project,当工程完成之后,部署在服务器上时,整个work工程会被打包成一个war包,如 除了可以在eclipse上运行,工具会帮我们自动部署在服务器上之外, ...
- 学习笔记——抽象工厂模式Abstract Factory
在工厂模式的基础上,通过为工厂类增加接口,实现其他产品的生产,而不用一类产品就增加一个工厂. 依然以<真菌世界>游戏故事类比,树作为工厂,如果现在有两类树,一类生产快速弄真菌飞机和20毫米 ...
- android apk jarsigner 签名打包
cmd 命令符打包: 规则: jarsigner -verbose -keystore 签名路径 -signedjar 签名后的apk存放路径 未签名的apk 签名文件的别名 项目如我的项目是: ...
- DHCP详细工作过程(转)
DHCP客户端通过和DHCP服务器的交互通讯以获得IP地址租约.为了从DHCP服务器获得一个IP地址,在标准情况下DHCP客户端和DHCP服务器之间会进行四次通讯.DHCP协议通讯使用端口UDP 67 ...
- USACO Section 1.3 Ski Course Design 解题报告
题目 题目描述 有N座山,每座山都有一个高度,现在由于农夫想避税,所以想把这些山的高度进行一些改变,使得最高的山与最低的山之间的高度差不超过17.每座山最多只能改变一次高度,每次改变高度都会产生一定的 ...
- jquery 事件注册 与重复事件处理
<!doctype html><html lang="us"><head><meta charset="utf-8"& ...