Jmeter之http性能测试实战 非GUI模式压测 NON-GUI模式 结果解析TPS——干货(十一)
- 性能测试计划
- 性能测试用例
- 录制脚本
- 性能测试结果
- 性能测试报告
- 性能测试监控报告
准备工作
- 从脚本已录制成功之后开始进行压测
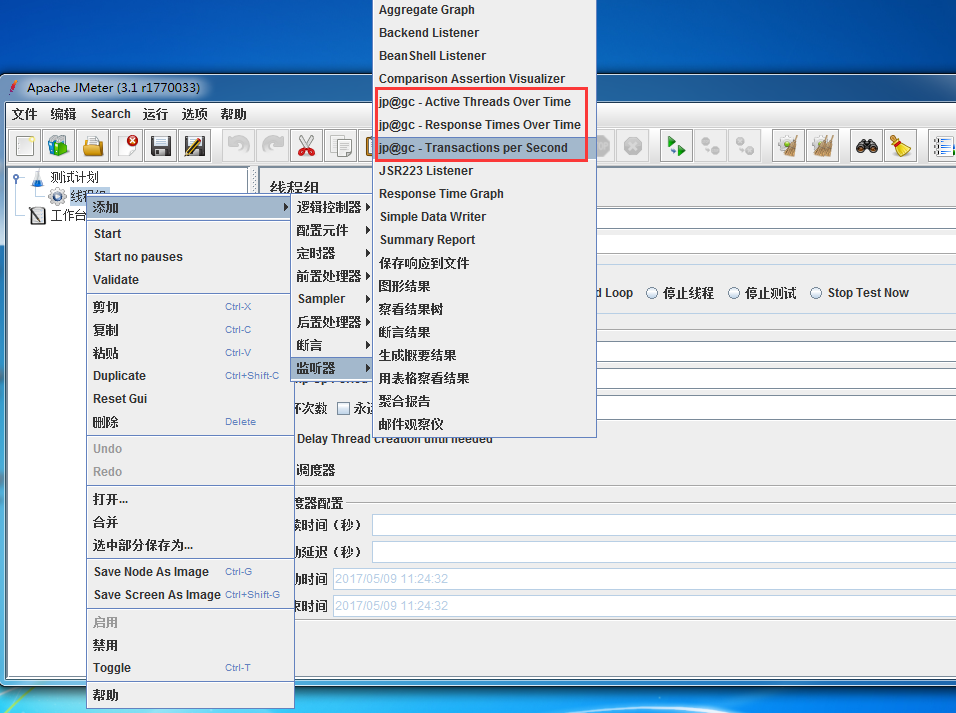
- 安装Jmeter拓展插件 查看 Transactions per Second https://jmeter-plugins.org/wiki/TransactionsPerSecond/ ←插件地址
- 在压测前先安装 Nmon监控工具在服务器linux性能监控分析及通过nmon_analyse生成分析报表
PS :安装 TPS教程
解压安装
将 jpgc-graphs-basic-2.0.zip 解压缩后只有一个 lib 目录,该目录下有一个 ext 文件夹和一个 jmeter-plugins-cmn-jmeter-0.3.jar 包,ext 文件夹中有 jmeter-plugins-graphs-basic-2.0.jar 和 jmeter-plugins-manager-0.10.jar 包。
将 lib 目录下的 jmeter-plugins-cmn-jmeter-0.3.jar 拷贝到 %JMeter%/lib 目录下,将 ext 目录下的 jmeter-plugins-graphs-basic-2.0.jar 和 jmeter-plugins-manager-0.10.jar 拷贝到 %JMeter%/lib/ext 目录下,重启 JMeter,发现已经支持 TPS、TRT 等视图了:
TPS导入解析测试报告
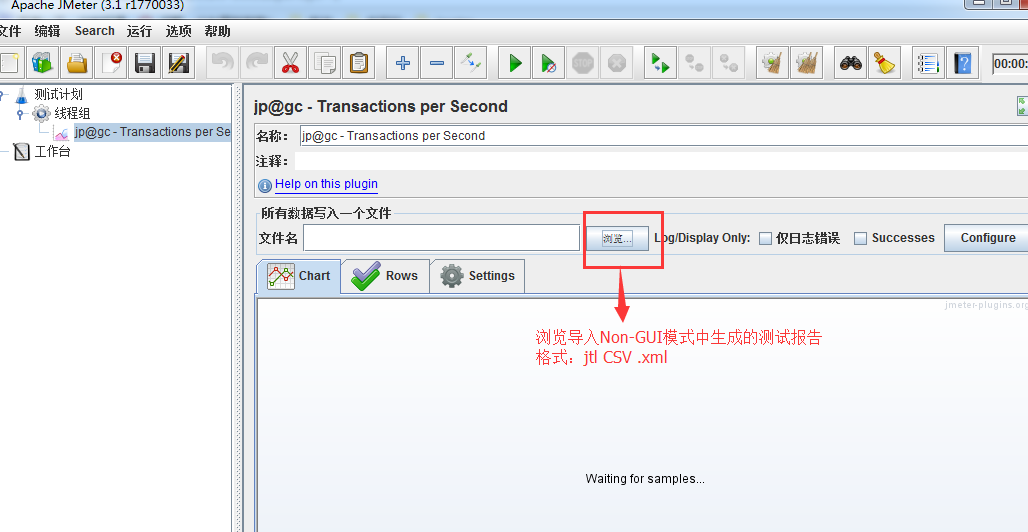
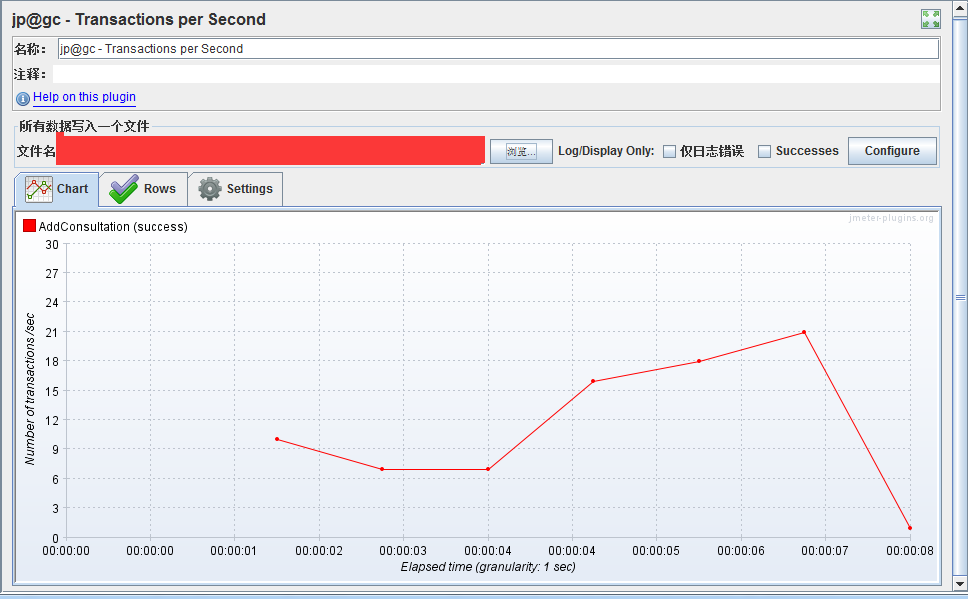
导入之后就可以看到 TPS数据了
取至Jmeter官方文档
1.0.2 Load Test running
Once your Test Plan is ready, you can start your Load Test. The first step is to configure the injectors that will run JMeter, this as for any other Load Testing tool includes:
- Correct machine sizing in terms of CPU, memory and network
- OS Tuning
- Java setup: Ensure you install the latest version of Java supported by JMeter
- Correct sizing of Java Heap. By default JMeter runs with a heap of 512MB, this might not be enough for your test and depends on your test plan and number of threads you want to run
Once everything is ready, you will use Command-line mode (called Non-GUI mode) to run it for the Load Test.
Don't run load test using GUI mode !
不要使用GUI模式运行负载测试!因为GUI模式的话会占用比较大的内存空间,并发数量上不去等等的问题
Using Non-GUI mode, you can generate a CSV (or XML) file containing results and have JMeter generate an HTML report at end of Load Test. JMeter will by default provide a summary of load test while it's running.
You can also have real-time results during your test using Backend Listener.
NON-GUI模式允许得到结果后可以在后端监听器的测试期间获得实时结果。这句话如何理解呢,见上面“TPS导入解析测试报告”
Running JMeter
To run Apache JMeter in NON_GUI
直接进入脚本路径,输入 Jmeter的启动路径
可以查看到Jmeter的相关命令帮助
小七的Jmeter路径是安装在D:\Jmeter\jmeter-3.1 所以直接进入bin目录下 找到jmeter 查看H帮助文档
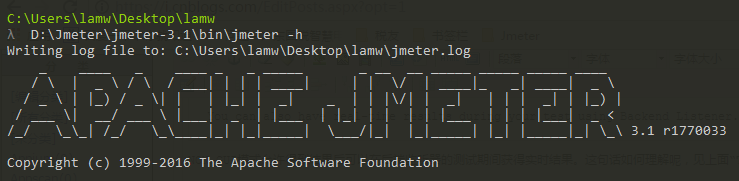
C:\Users\lamw\Desktop\lamw
λ D:\Jmeter\jmeter-3.1\bin\jmeter -h
Writing log file to: C:\Users\lamw\Desktop\lamw\jmeter.log
    _    ____   _    ____ _   _ _____       _ __  __ _____ _____ _____ ____

   / \  |  _ \ / \  / ___| | | | ____|     | |  \/  | ____|_   _| ____|  _ \

  / _ \ | |_) / _ \| |   | |_| |  _|    _  | | |\/| |  _|   | | |  _| | |_) |

 / ___ \|  __/ ___ \ |___|  _  | |___  | |_| | |  | | |___  | | | |___|  _ <

/_/   \_\_| /_/   \_\____|_| |_|_____|  \___/|_|  |_|_____| |_| |_____|_| \_\ 3.1 r1770033
Copyright (c) 1999-2016 The Apache Software Foundation
To list all command line options, open a command prompt and type:
jmeter.bat(Windows)/jmeter.sh(Linux) -?
--------------------------------------------------
To run Apache JMeter in GUI mode, open a command prompt and type:
jmeter.bat(Windows)/jmeter.sh(Linux) [-p property-file]
--------------------------------------------------
To run Apache JMeter in NON_GUI mode:
Open a command prompt (or Unix shell) and type:
jmeter.bat(Windows)/jmeter.sh(Linux) -n -t test-file [-p property-file] [-l results-file] [-j log-file]
--------------------------------------------------
To run Apache JMeter in NON_GUI mode and generate a report at end :
Open a command prompt (or Unix shell) and type:
jmeter.bat(Windows)/jmeter.sh(Linux) -n -t test-file [-p property-file] [-l results-file] [-j log-file] -e -o [Path to o
utput folder]
--------------------------------------------------
To generate a Report from existing CSV file:
Open a command prompt (or Unix shell) and type:
jmeter.bat(Windows)/jmeter.sh(Linux) -g [csv results file] -o [path to output folder (empty or not existing)]
--------------------------------------------------
To tell Apache JMeter to use a proxy server:
Open a command prompt and type:
jmeter.bat(Windows)/jmeter.sh(Linux) -H [your.proxy.server] -P [your proxy server port]
---------------------------------------------------
To run Apache JMeter in server mode:
Open a command prompt and type:
jmeter-server.bat(Windows)/jmeter-server(Linux)
---------------------------------------------------
上面包含了一些参数 可以输入 -l 查看
C:\Users\lamw\Desktop\lamw

λ  D:\Jmeter\jmeter-3.1\bin\jmeter -l

Usage

        --?

                print command line options and exit

        -h, --help

                print usage information and exit

        -v, --version

                print the version information and exit

        -p, --propfile <argument>

                the jmeter property file to use

        -q, --addprop <argument>

                additional JMeter property file(s)

        -t, --testfile <argument>

                the jmeter test(.jmx) file to run

        -l, --logfile <argument>

                the file to log samples to

        -j, --jmeterlogfile <argument>

                jmeter run log file (jmeter.log)

        -n, --nongui

                run JMeter in nongui mode

        -s, --server

                run the JMeter server

        -H, --proxyHost <argument>

                Set a proxy server for JMeter to use

        -P, --proxyPort <argument>

                Set proxy server port for JMeter to use

        -N, --nonProxyHosts <argument>

                Set nonproxy host list (e.g. *.apache.org|localhost)

        -u, --username <argument>

                Set username for proxy server that JMeter is to use

        -a, --password <argument>

                Set password for proxy server that JMeter is to use

        -J, --jmeterproperty <argument>=<value>

                Define additional JMeter properties

        -G, --globalproperty <argument>=<value>

                Define Global properties (sent to servers)

                e.g. -Gport=123

                 or -Gglobal.properties

        -D, --systemproperty <argument>=<value>

                Define additional system properties

        -S, --systemPropertyFile <argument>

                additional system property file(s)

        -L, --loglevel <argument>=<value>

                [category=]level e.g. jorphan=INFO or jmeter.util=DEBUG

        -r, --runremote

                Start remote servers (as defined in remote_hosts)

        -R, --remotestart <argument>

                Start these remote servers (overrides remote_hosts)

        -d, --homedir <argument>

                the jmeter home directory to use

        -X, --remoteexit

                Exit the remote servers at end of test (non-GUI)

        -g, --reportonly <argument>

                generate report dashboard only, from a test results file

        -e, --reportatendofloadtests

                generate report dashboard after load test

        -o, --reportoutputfolder <argument>

                output folder for report dashboard
下面我们就采用 NON_GUI模式执行脚本 如下:
--------------------------------------------------

To run Apache JMeter in NON_GUI mode and generate a report at end :

Open a command prompt (or Unix shell) and type:

jmeter.bat(Windows)/jmeter.sh(Linux) -n -t test-file [-p property-file] [-l results-file] [-j log-file] -e -o [Path to o

utput folder]

--------------------------------------------------
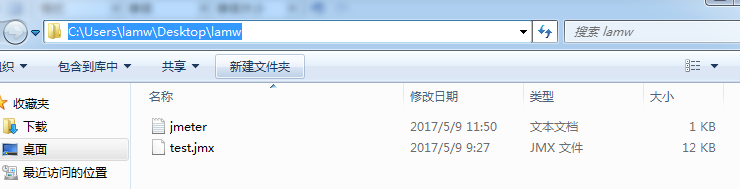
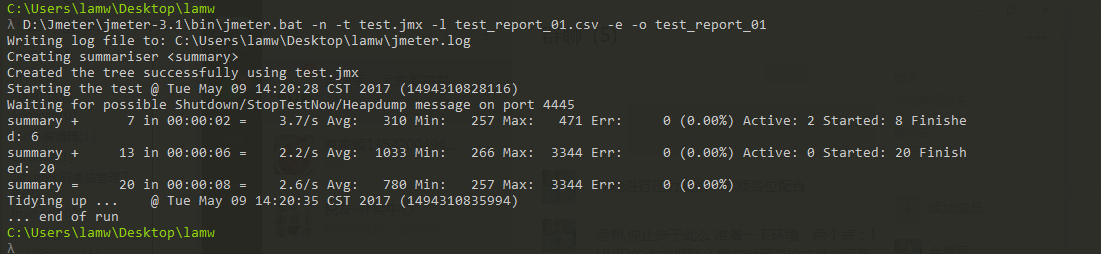
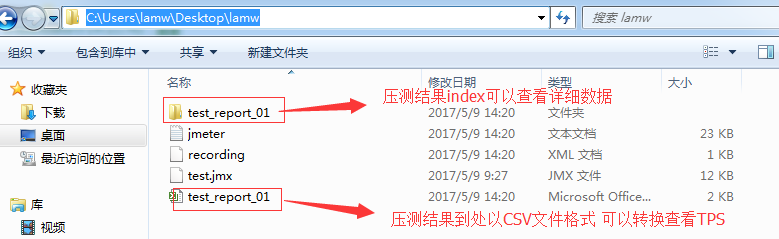
输入以下命令直接执行录制好的脚本文件

C:\Users\lamw\Desktop\lamw

λ  D:\Jmeter\jmeter-3.1\bin\jmeter.bat -n -t test.jmx -l test_report_01.csv -e -o test_report_01

命令解析:
C:\Users\lamw\Desktop\lamw 这个是测试脚本所在的文件目录
D:\Jmeter\jmeter-3.1\bin\jmeter.bat --------Jmeter.bat 的执行路径
-n, --nongui -------------以nongui模式执行
run JMeter in nongui mode
-t, --testfile <argument>-------------压测脚本文件jmx
the jmeter test(.jmx) file to run
-l, --logfile <argument>-------------将样本记录到的文件
the file to log samples to
-e, --reportatendofloadtests------------ 在加载测试后生成报告仪表板
generate report dashboard after load test
-o, --reportoutputfolder <argument>---------------- 报告仪表板的输出文件夹
output folder for report dashboard
运行脚本进行压测
当然,在运行脚本进行压测的时候 需要在服务器 先执行 采集命令
ps -ef | grep nmon 查看采集数据的进程
[root@lamw /home/lam7/nmon]# ps -ef | grep nmon
[root@lamw /home/lam7/nmon]# nmon -f -s 1 -c 60
-f 表示生成的数据文件名中有时间;
-t 输出中包括占用率较高的进程;
-s 1 表示每 1 秒采集一次数据;
-c 60 表示采集 60 次,1s*60=60秒;
至于监控的方式可以查看上面所讲的准备工作第三点
Jmeter之http性能测试实战 非GUI模式压测 NON-GUI模式 结果解析TPS——干货(十一)的更多相关文章
- Jmeter(一)非GUI模式压测(NON-GUI模式)结果解析TPS
非GUI模式压测(NON-GUI模式)结果解析TPS 准备工作 从脚本已录制成功之后开始进行压测 安装Jmeter拓展插件 查看 Transactions per Second https://jme ...
- Jmeter之http性能测试实战 NON-GUI模式 进行分布式压力测试——干货(十二)
Apache JMeter Distributed Testing Step-by-step This short tutorial explains how to use multiple syst ...
- JMeter-命令行模式压测
前言 使用非GUI模式,即命令行模式运行jmeter测试脚本能够大大缩减系统资源,今天跟小伙伴们讲一下JMeter如何在命令行模式进行压测吧! 一:配置好JDK和JMeter的环境变量(过程略) 二: ...
- Jmeter之TCP取样器(模拟数据上报压测)
TCP压测 场景:模拟硬件设备上报数据(登录,心跳,GPS定位数据/光感数据/电量数据),对这个功能进行压测 啰嗦一句:TCP压测很简单,只要调通了一个TCP,后续的逻辑判断就用逻辑控制器和正则处理就 ...
- SwingBench 字符模式压测最佳实践
之前写过<使用SwingBench 对Oracle RAC DB性能 压力测试>,使用的是最基础直观的图形模式,已经可以满足大多数需求. 但是在有些场景下,图形模式可能本身消耗资源过大,尤 ...
- my31_MGR单写模式压测以及对比普通从库记录
场景MGR单写模式三节点,db46写节点,db47/db48为读节点工具sysbencn.压测15个小时,db46上18线程纯写,12线程oltp混合测试,db48上12线程select在压测2个小时 ...
- jmeter+nmon+crontab简单的执行接口定时压测
一.概述 临时接到任务要对系统的接口进行压测,上面的要求就是:压测,并发2000 在不熟悉系统的情况下,按目前的需求,需要做的步骤: 需要有接口脚本 需要能监控系统性能 需要能定时执行脚本 二.观察 ...
- jmeter之登录接口的一次简单压测与分析
前言:登录接口的一次简单压测与分析 1.接口文档 2.配置元件 3.结果分析 1.接口文档 a.拿到接口文档 接口地址:http://localhost:8080/jpress/admin/login ...
- Jmeter系列(12)- 上传接口压测
step-1上传接口分析 上传接口源码分析:分析上传文件类型.有无大小限制.存放上传文件服务器 没有源码通过抓包工具,或者Chrome查看框架源代码 接口路径/uploadfile,接口请求POST, ...
随机推荐
- 前端构建工具gulp之基本介绍
1.基本介绍 gulp.js是一个自动化构建工具,是自动化项目的构建利器.可以对网站的资源进行优化,将开发过程中一些重复的任务通过执行命令自动完成.这样能很大的提高我们的工作效率. gulp.js是基 ...
- metasploit魔鬼训练营 (安全漏洞生命周期)
1,前期 渗透测试工程师在挖掘0day的出来的 2,前中期 在一个密封的团体里,互相交流,利用漏洞带来的价值和,金钱 3,中期 安全漏洞被披露!!黑客们快速掌握该漏洞 4,中后期 漏洞被制作成更为简单 ...
- 【Java数据结构学习笔记之一】线性表的存储结构及其代码实现
应用程序后在那个的数据大致有四种基本的逻辑结构: 集合:数据元素之间只有"同属于一个集合"的关系 线性结构:数据元素之间存在一个对一个的关系 树形结构:数据元素之间存在一个对多个关 ...
- 高可用高性能分布式文件系统FastDFS实践Java程序
在前篇 高可用高性能分布式文件系统FastDFS进阶keepalived+nginx对多tracker进行高可用热备 中已介绍搭建高可用的分布式文件系统架构. 那怎么在程序中调用,其实网上有很多栗子, ...
- 支付宝当面付开发(java)
支付宝当面付开发(java) 业务流程: 接入准备: 直接下载demo: https://doc.open.alipay.com/doc2/detail.htm?spm=a219a.7 ...
- Java中Calendar.DAY_OF_WEEK、DAY_OF_MONTH需要减一的原因
Java中对日期的处理需要用到Calendar类,其中有几个方法在使用时需要新手注意.1. 在获取月份时,Calendar.MONTH + 1 的原因(Java中Calendar.MONTH返回的数值 ...
- RSA关于加密长度限制的解决办法
RSA关于加密长度限制的解决办法 因为rsa采用分块进行加密的,所以有长度限制.如果加密信息较多,可分段加解密(不建议对大量信息rsa加密,效率低效): 正常加密情形如下: public ...
- springcloud干活之服务消费者(feign)
springcloud系列文章的第三篇 本章将继续讲述springcloud的消费者(feign) Spring Cloud Feign是一套基于Netflix Feign实现的声明式服务调用客户端. ...
- 从零开始学习前端JAVASCRIPT — 3、JavaScript基础string字符串介绍
1:字符串 JS中的任何数据类型都可以当作对象来看.所以string既是基本数据类型,又是对象. 2:声明字符串 基本数据类型:var sStr = '字符串'; 对象的方法:var oStr = n ...
- 修改nopCommerce中的实体
对已有实体增加一个属性(对Category增加一个SomeNewProperty) 最近在研究nopcommerce,这里是对官网上文档的学习 ...