
转:Remote debugging with Visual Studio 2010
Original URL http://www.codeproject.com/Articles/146838/Remote-debugging-with-Visual-Studio-2010
you may also need to set up window firewall for this. see URL https://msdn.microsoft.com/en-us/library/ee126350(v=vs.100).aspx
I've recently needed to remotely debug a .NET desktop application with Visual Studio 2010. After having read the MSDN documentation on this subject, I still missed some information. I hope that this post will fill some of these gaps and will help you configure and run the remote debugging tools.
Let’s first start with a definition of parts involved in the debugging process:
- host – is a machine on which Visual Studio is installed and on which you control the debugging process
- remote computer – is a machine on which the debuggee is run
Since the debugging process is wholly controlled from the host, there must be a listener on the remote computer that executes commands sent from Visual Studio. This listener is called Remote Debugging Monitor (msvsmon.exe). There are two possible ways to install it – you can either download and run the setup package from Microsoft or copy all the necessary files from C:\Program Files (x86)\Microsoft Visual Studio 10.0\Common7\IDE\Remote Debugger (path on my 64-bit Win7). A caveat here: If your host is x86 machine, then you have no choice but x86 package for your remote computer – there is no way you can debug a 64-bit process in a 32-bit debugger. Though you can debug 32-bit process in a 64-bit debugger.
Next step (the most boring and error prone in my opinion) is a network setup. Ideally Visual Studio and Remote Debugging Monitor should take care of the Windows Firewall settings after you run them with the elevated privileges, but life is life and you might need to get your hands dirty. Fortunately the manual configuration process is pretty well explained on MSDN sites for WinXP, Vista and Win7. The next important thing is security. You can either perform debugging in “NoAuthentication” mode (which is of course less secure) or in Windows Authentication mode. Unfortunately Windows Authentication mode requires the same account to be setup on the host and the remote computer – both usernames and passwords must be the same. If it’s a problem for you, then you are left with the “NoAuthentication” mode in which you take a risk of allowing all people to access your debugging monitor.
Having finished the configuration part, we may finally start the debugging process. Begin with starting msvsmon.exe (Remote Debugging Monitor) on the remote computer – it will communicate with Visual Studio running on the host. Let’s assume that our application is named RemoteControl.exe and is written in C#. First, we need to deploy it on the remote computer, for example into the C:\Users\concept\Desktop\RemoteControl folder (remember to copy also all the pdb files and the assemblies required by the main application). We can now either start the application under the debugger or attach the debugger to the already running process. Let’s start with the first scenario. If you have access to the application solution folder and to all the project files, then you can start the remote debugging by modifying the start project properties page:

If you don’t have access to the application solution, then you need to use the application EXE file. From File menu choose Open->Project/Solution… and find the EXE file for your application. Select the newly opened project and choose properties. Fill the page with following values:
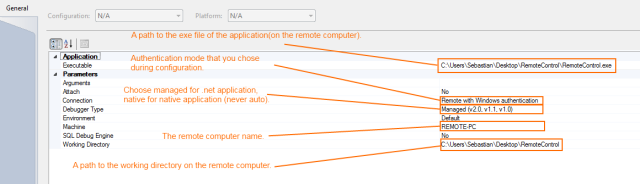
Attaching to the already started process is fairly simple: From the Debug menu, choose Attach to process…. If you are debugging in the Windows Authentication mode, set the Transport box to Default. In Qualifier field, type name of your Remote Debugging Monitor session. Usually it is your user name + @ + the remote computer name, for example Sebastian@REMOTE-PC (the session name is also displayed in the listbox after you start the msvsmon.exe).
Finally, a few words about the debugging process. Unfortunately the debugging symbol configuration differs depending on the chosen debugging engine (native, managed, mixed). When using managed debugging engine symbols must be accessible on the remote computer (so you need to deploy your application with all pdb files and set_NT_SYMBOL_PATH variable on the remote computer for .NET Framework debugging symbols). When using native debugging engine symbols are loaded from the host machine (so you must include the directory with all pdb files for your application into the Visual Studio symbols search path – Tools->Options->Debugging->Symbols). Interestingly, source files are always loaded from the host machine (in case that you don’t use any kind of source server). To summarize: remember to always choose the managed engine for your .NET applications that don’t have any interop parts. The native engine requires much more information (like symbols for all native libraries) and provides you with capabilities that are usually not necessary in debugging pure .NET application.
I haven’t touched the subject of the web applications remote debugging and running Remote Debugging Monitor as a service. Leave a comment if you wish such a post to appear in the future. 
转:Remote debugging with Visual Studio 2010的更多相关文章
- Visual Studio 2010初学者的调试指南:Mastering Debugging in Visual Studio 2010 - A Beginner's Guide
Introduction In the software development life cycle, testing and defect fixing take more time than a ...
- Win7 32bit + Matlab2013b +Visual Studio 2010联合编程配置
要建立独立运行的C应用程序,系统中需要安装Matlab.Matlab编译器.C/C++编译器以及Matlab C/C++数学库函数和图形库函数. Matlab编译器使用mbuild命令可以直接将C/C ...
- VS:101 Visual Studio 2010 Tips
101 Visual Studio 2010 Tips Tip #1 How to not accidentally copy a blank line TO – Text Editor ...
- Creating SharePoint 2010 Event Receivers in Visual Studio 2010
转:http://msdn.microsoft.com/en-us/library/gg252010(v=office.14).aspx Summary: Learn how to create a ...
- 恼人的Visual Studio 2010崩溃重启问题
上周时Visual Studio 2010突然出现崩溃现象.在源文件修改只要一编译,马上就崩溃,而且还不弹出任何异常窗口,严重影响软件开发工作. google了无数解决方案 试了下面这些方法: 1)h ...
- How To Compile Qt with Visual Studio 2010
This post is a step-by-step guide on how to compile Qt 4.x.x with MSVC 2010. Although we use Qt 4.7. ...
- Visual Studio 2010 将网站直接发布到远程站点
原文:Visual Studio 2010 将网站直接发布到远程站点 这次说下如何将web应用程序直接发布到IIS服务器站点!!! 问题的由来 本人每天要发布更新的程序,所以每次更新的时候要做的工作: ...
- ASP.NET 4 and Visual Studio 2010
https://msdn.microsoft.com/en-us/library/ee532866.aspx The topics in this section provide informatio ...
- [入门级] 基于 visual studio 2010 mvc4 的图书管理系统开发初步 (二)
[入门级] 基于 visual studio 2010 mvc4 的图书管理系统开发初步 (二) Date 周六 10 一月 2015 By 钟谢伟 Category website develop ...
随机推荐
- 网络流(二分):BZOJ 3993: [SDOI2015]星际战争
Description 3333年,在银河系的某星球上,X军团和Y军团正在激烈 地作战.在战斗的某一阶段,Y军团一共派遣了N个巨型机器人进攻X军团的阵地,其中第i个巨型机器人的装甲值为Ai.当一个巨型 ...
- Ubuntu频率较高的操作
一.切换超级用户 由于 Ubuntu 是基于 Debian 的 linux 操作系统,在默认的情况下,是没有超级用户(superuser, root)的,但有些系统操作必须有超级用户的权限才能进行,如 ...
- UVa 11178计算几何 模板题
#include<cstdio> #include<cstring> #include<cmath> #include<iostream> #inclu ...
- javaweb开发过程中的地址写法
凡是要表示web资源的地址,比如浏览器地址栏中,都是 /凡是要表示硬盘地址, 都是 \ public class ServletDemo1 extends HttpServlet { //实际开发过 ...
- Demon_背包系统(实现装备栏,背包栏,可以切换装备)
using UnityEngine; using System.Collections; public enum BoxType { Normal,//普通格子 Equip//装备栏格子 } publ ...
- 关于lucene的IndexSearcher单实例,对于索引的实时搜索
Lucene版本:3.0 一般情况下,lucene的IndexSearcher都要写成单实例,因为每次创建IndexSearcher对象的时候,它都需要把索引文件加载进来,如果访问量比较大,而索引也比 ...
- struts2入门程序
struts2入门程序 1.示例 搭建编程环境就先不说了,这里假设已经搭建好了编程环境,并且下好了strut2的jar包,接下来程序. 1.1 新建web项目 点击File->New->D ...
- SDN:软件定义网络
近期高级网络课的小组任务是在老师给定的范围内自选方向主题研究并做展示报告.我们组选了sdn.原以为这东西会是工业界无人问津的概念化产品,Google了一下却发现事实上sdn挺火的,因为它可能带来的可扩 ...
- Eclipse中使用git把项目导入到osc@git中
方便Eclipse用户使用Git把项目导入到osc@git中进行管理. Eclipse Git osc@git 一.原有项目: 项目名为TestGit 二.在osc@git上面创建一个新项目库. 填 ...
- 正则表达式中/i,/g,/ig,/gi,/m的区别和含义
正则表达式中/i,/g,/ig,/gi,/m的区别和含义 /i (忽略大小写)/g (全文查找出现的所有匹配字符)/m (多行查找)/gi(全文查找.忽略大小写)/ig(全文查找.忽略大小写)