
【默默努力】react-drag-grid
先放项目地址:https://github.com/Bilif/react-drag-grid
项目运行效果
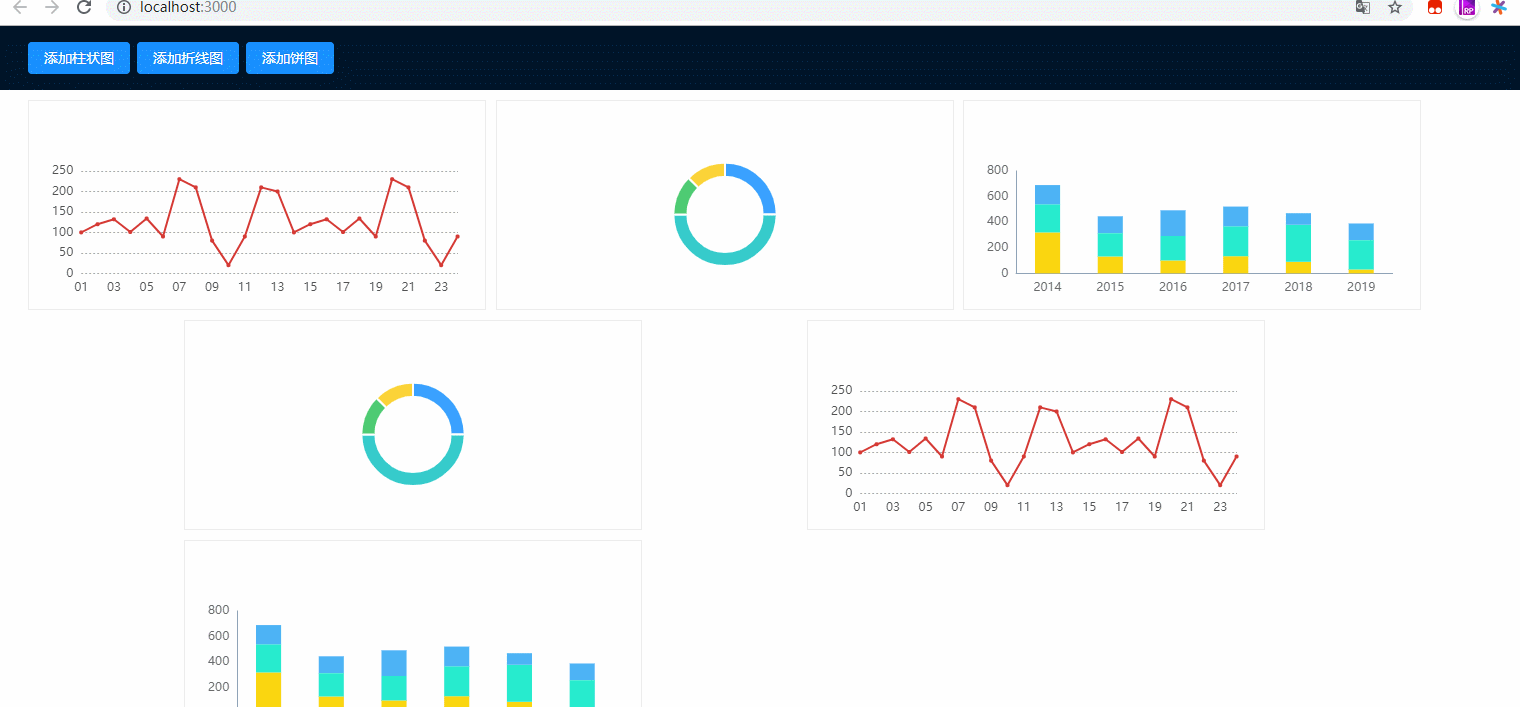
感谢无私开源的程序员
先看项目入口文件
//index.js

import React from 'react';

import ReactDOM from 'react-dom';

import './index.css';

import App from './App';

import * as serviceWorker from './serviceWorker';

ReactDOM.render(<App />, document.getElementById('root'));

// If you want your app to work offline and load faster, you can change

// unregister() to register() below. Note this comes with some pitfalls.

// Learn more about service workers: https://bit.ly/CRA-PWA

serviceWorker.unregister();
可以看到主要内容主要在App.js中
接下来我们来看App.js
//App.js

import React from 'react';

import './App.css';

import DragLayout from './DragLayout';

function App() {

  return (

    <DragLayout></DragLayout>

  );

}

export default App;
我们可以看到App中主要引用的是DragLayout组件
也就是核心功能点在DragLayout组件中
在DragLayout中我们会看到引用了一些组件
比如antd,用来布局以及样式
react-grid-layout是一个好用的拖拽、自适应布局 react 插件
它的使用方法为
import { WidthProvider, Responsive } from "react-grid-layout";

const ResponsiveReactGridLayout = WidthProvider(Responsive);
在React的render方法中渲染可拖拽布局。ResponsiveReactGridLayout组件有多个属性。
cols:定义了响应式布局划分成几列。
rowHeight:响应式布局中组件的行高。
onLayoutChange:当响应式布局中的组件发生拖拽或者放大缩小时触发该函数。
     <ResponsiveReactGridLayout

            className="layout"

            {...this.props}

            layouts={this.state.layouts}

            onLayoutChange={(layout, layouts) =>

              this.onLayoutChange(layout, layouts)

            }

          >

            {this.generateDOM()}

          </ResponsiveReactGridLayout>
使用echarts-for-react插件可以在React中调用echarts接口直接渲染出Echarts图表,只要传入相关的参数和数据即可。
安装
npm install --save echarts-for-react]

npm install --save echarts
使用
  let component = (

        <ReactEcharts

          option={option}

          notMerge={true}

          lazyUpdate={true}

          style={{width: '100%',height:'100%'}}

        />

      )
这边将三种图封装在了chart中
//chart.js

export function getBarChart() {

  const option = {

    tooltip: {

      trigger: 'axis',

      axisPointer: { // 坐标轴指示器,坐标轴触发有效

        type: 'shadow' // 默认为直线,可选为:'line' | 'shadow'

      }

    },

    grid: {

      left: '3%',

      right: '4%',

      bottom: '3%',

      containLabel: true

    },

    xAxis: [{

      type: 'category',

      data: ['2014', '2015', '2016', '2017', '2018', '2019'],

      axisLine:{

        lineStyle:{

          color:'#8FA3B7',//y轴颜色

        }

      },

      axisLabel: {

        show: true,

        textStyle: {

          color: '#6D6D6D',

        }

      },

      axisTick: {show: false}

    }],

    yAxis: [{

      type: 'value',

      splitLine:{show: false},

      //max: 700,

      splitNumber: 3,

      axisTick: {show: false},

      axisLine:{

        lineStyle:{

          color:'#8FA3B7',//y轴颜色

        }

      },

      axisLabel: {

        show: true,

        textStyle: {

          color: '#6D6D6D',

        }

      },

    }],

    series: [

      {

        name: 'a',

        type: 'bar',

        barWidth: '40%',

        itemStyle: {

          normal: {

            color: '#FAD610'

          }

        },

        stack: '信息',

        data: [320, 132, 101, 134, 90, 30]

      },

      {

        name: 'b',

        type: 'bar',

        itemStyle: {

          normal: {

            color: '#27ECCE'

          }

        },

        stack: '信息',

        data: [220, 182, 191, 234, 290, 230]

      },

      {

        name: 'c',

        type: 'bar',

        itemStyle: {

          normal: {

            color: '#4DB3F5'

          }

        },

        stack: '信息',

        data: [150, 132, 201, 154, 90, 130]

      }

    ]

  };

  return option;

}

export function getLineChart() {

  //option

  const option = {

    color: ['#D53A35'],

    tooltip: {

      trigger: 'axis',

      //formatter: "{b} <br> 合格率: {c}%"

    },

    grid: {

      left: '3%',

      right: '4%',

      bottom: '3%',

      containLabel: true

    },

    xAxis: {

      type: 'category',

      name: '',

      boundaryGap: false,

      axisLine:{

        show:false,

        lineStyle:{

          color:'#525252'

        }

      },

      axisTick:{

        show:false

      },

      axisLabel:{

        color:'#525252'

      },

      data: ['01', '02', '03', '04', '05', '06', '07','08','09','10','11','12','13','14','15','16','17','18','19','20','21','22','23','24']

    },

    yAxis: {

      type: 'value',

      name: '',

      axisLine:{

        show:false,

      },

      axisTick:{

        show:false

      },

      axisLabel:{

        color:'#525252'

      },

      splitLine:{

        lineStyle:{

          type:'dotted',

          color:'#AAA'//F3F3F3

        }

      }

    },

    series: [{

      name: 'a',

      type: 'line',

      symbol: 'circle',

      data: [100,120, 132, 101, 134, 90, 230, 210,80,20,90,210,200,100,120, 132, 101, 134, 90, 230, 210,80,20,90]

    }

    ]

  };

  return option;

}

export function getPieChart() {

  //option

  const option = {

    color: ['#3AA1FF', '#36CBCB', '#4ECB73', '#FBD338'],

    tooltip: {

      trigger: 'item',

      formatter: '{a} <br/>{b}: {c} ({d}%)'

    },

    grid: {

      left: '3%',

      right: '4%',

      bottom: '3%',

      containLabel: true

    },

    series: [{

      name: '消费能力',

      type: 'pie',

      radius: ['40%', '55%'],

      center: ['50%', '55%'],

      avoidLabelOverlap: true,

      itemStyle: {

        normal: {

          borderColor: '#FFFFFF',

          borderWidth: 2

        }

      },

      label: {

        normal: {

          show: false,

        },

      },

      labelLine: {

        normal: {

          show: false

        }

      },

      data: [{

        name: 'a',

        value: '20'

      }, {

        name: 'b',

        value: '40'

      }, {

        name: 'c',

        value: '10'

      }, {

        name: 'd',

        value: '10'

      }]

    }]

  };

  return option;

}
通过generateDOM函数生成布局中的组件,首先先遍历组件数组,通过每个组件的类型判断生产柱状图组件,
折线组件,还是饼图组件。每个组件必须定义一个全局唯一的key值。data-grid为每一个组件绑定了其属性。
  generateDOM = () => {

    return _.map(this.state.widgets, (l, i) => {

      let option;

      if (l.type === 'bar') {

        option = getBarChart();

      }else if (l.type === 'line') {

        option = getLineChart();

      }else if (l.type === 'pie') {

        option = getPieChart();

      }

      let component = (

        <ReactEcharts

          option={option}

          notMerge={true}

          lazyUpdate={true}

          style={{width: '100%',height:'100%'}}

        />

      )

      return (

        <div key={l.i} data-grid={l}>

          <span className='remove' onClick={this.onRemoveItem.bind(this, i)}>x</span>

          {component}

        </div>

      );

    });

  };
通过addItem函数来新增组件。
每个组件属性如下:
x: 组件在x轴坐标
y: 组件在y轴坐标
w: 组件宽度
h: 组件高度
i: 组件key值
addItem(type,widgetId) {

    const addItem = {

      x: (this.state.widgets.length * 2) % (this.state.cols || 12),

      y: Infinity, // puts it at the bottom

      w: 2,

      h: 2,

      i: widgetId || new Date().getTime().toString(),

    };

    this.setState(

      {

        widgets: this.state.widgets.concat({

          ...addItem,

          type,

        }),

      },

    );

  };
通过onRemoveItem函数来移除增组件。
onRemoveItem(i) {

    console.log(this.state.widgets)

    this.setState({

      widgets: this.state.widgets.filter((item,index) => index !=i)

    });

  }
DragLayout.js全部代码为
//DragLayout

import React, { PureComponent } from 'react';

import { Layout,Button } from 'antd';

import { WidthProvider, Responsive } from "react-grid-layout";

import _ from "lodash";

import ReactEcharts from 'echarts-for-react';

import { getBarChart,getLineChart,getPieChart } from "./chart";

const ResponsiveReactGridLayout = WidthProvider(Responsive);

const { Header, Content} = Layout;

export default class DragLayout extends PureComponent {

  static defaultProps = {

    cols: { lg: 12, md: 10, sm: 6, xs: 4, xxs: 2 },

    rowHeight: 100,

  };

  constructor(props) {

    super(props);

    this.state = {

      layouts: this.getFromLS("layouts") || {},

      widgets:[]

    }

  }

  getFromLS(key) {

    let ls = {};

    if (global.localStorage) {

      try {

        ls = JSON.parse(global.localStorage.getItem("rgl-8")) || {};

      } catch (e) {

        /*Ignore*/

      }

    }

    return ls[key];

  }

  saveToLS(key, value) {

    if (global.localStorage) {

      global.localStorage.setItem(

        "rgl-8",

        JSON.stringify({

          [key]: value

        })

      );

    }

  }

  generateDOM = () => {

    return _.map(this.state.widgets, (l, i) => {

      let option;

      if (l.type === 'bar') {

        option = getBarChart();

      }else if (l.type === 'line') {

        option = getLineChart();

      }else if (l.type === 'pie') {

        option = getPieChart();

      }

      let component = (

        <ReactEcharts

          option={option}

          notMerge={true}

          lazyUpdate={true}

          style={{width: '100%',height:'100%'}}

        />

      )

      return (

        <div key={l.i} data-grid={l}>

          <span className='remove' onClick={this.onRemoveItem.bind(this, i)}>x</span>

          {component}

        </div>

      );

    });

  };

  addChart(type) {

    const addItem = {

      x: (this.state.widgets.length * 3) % (this.state.cols || 12),

      y: Infinity, // puts it at the bottom

      w: 3,

      h: 2,

      i: new Date().getTime().toString(),

    };

    this.setState(

      {

        widgets: this.state.widgets.concat({

          ...addItem,

          type,

        }),

      },

    );

  };

  onRemoveItem(i) {

    console.log(this.state.widgets)

    this.setState({

      widgets: this.state.widgets.filter((item,index) => index !=i)

    });

  }

  onLayoutChange(layout, layouts) {

    this.saveToLS("layouts", layouts);

    this.setState({ layouts });

  }

  render() {

   return(

     <Layout>

      <Header style={{ position: 'fixed', zIndex: 1, width: '100%','padding': '0 30px' }}>

        <Button type="primary" style={{'marginRight':'7px'}} onClick={this.addChart.bind(this,'bar')}>添加柱状图</Button>

        <Button type="primary" style={{'marginRight':'7px'}} onClick={this.addChart.bind(this,'line')}>添加折线图</Button>

        <Button type="primary" style={{'marginRight':'7px'}} onClick={this.addChart.bind(this,'pie')}>添加饼图</Button>

      </Header>

      <Content style={{ marginTop: 44 }}>

        <div style={{ background: '#fff', padding: 20, minHeight: 800 }}>

          <ResponsiveReactGridLayout

            className="layout"

            {...this.props}

            layouts={this.state.layouts}

            onLayoutChange={(layout, layouts) =>

              this.onLayoutChange(layout, layouts)

            }

          >

            {this.generateDOM()}

          </ResponsiveReactGridLayout>

        </div>

      </Content>

    </Layout>

   )}

}
部分讲解内容学习自博客:https://juejin.im/post/5cda5719e51d453a36384923
【默默努力】react-drag-grid的更多相关文章
- 2018.5.2(7:20到的办公室开始早课 阮一峰的JS) 所有的默默努力都是为了让自己看起来毫不费力
continue语句用于立即终止本轮循环,返回循环结构的头部,开始下一轮循环. break语句用于跳出代码块或循环. 标签(label) JavaScript 语言允许,语句的前面有标签(label) ...
- 【默默努力】PixelFire
先放下我玩游戏的效果图: 关于游戏最后的结束部分其实我还没有截图,看着挺好看的,后面的效果 再放作者大大的项目地址:https://github.com/panruiplay/PixelFire 接下 ...
- 【默默努力】fishingGame
这个捕鱼游戏挺有意思的,通过发射子弹,打鱼.打鱼的子弹会消耗金币,但是打鱼如果打到了鱼,就会奖励金币的数量. 我如果写这个的话,应该会画一个 背景海底,然后生成很多鱼的图片,还要有一个大炮,金币.大炮 ...
- 【默默努力】h5-game-heroVSmonster
先放下作者大大的项目地址:https://github.com/yangyunhe369/h5-game-heroVSmonster 然后游戏的效果为 截动图的按键与游戏按键应该冲突,我就截几张图片了 ...
- 【默默努力】h5-game-blockBreaker
先放下游戏的效果,我不太会玩游戏 然后放下无私开源的作者大大的地址:https://github.com/yangyunhe369/h5-game-blockBreaker 这个游戏的话,我觉得应该是 ...
- 【默默努力】ig-wxz-and-hotdog
这个是一个非常跟热点的小游戏,思聪吃热狗.这个游戏的话,我感觉思路还挺简单的,天上会掉热狗和障碍物, 思聪在下面张开嘴巴,进行左右移动,接热狗.如果吃到的是热狗就得一分,如果思聪吃到的不是热狗,是障碍 ...
- 【默默努力】vue-pc-app
最近在github上面看到了一个团队的项目,真的非常赞.他们进行vue-cli的二次开发,将项目用自己的方式打包. 今天的这个开源项目地址为:https://github.com/tffe-team/ ...
- 【招聘App】—— React/Nodejs/MongoDB全栈项目:信息完善&用户列表
前言:最近在学习Redux+react+Router+Nodejs全栈开发高级课程,这里对实践过程作个记录,方便自己和大家翻阅.最终成果github地址:https://github.com/66We ...
- react-native聊天室|RN版聊天App仿微信实例|RN仿微信界面
一.前言 9月,又到开学的季节.为每个一直默默努力的自己点赞!最近都沉浸在react native原生app开发中,之前也有使用vue/react/angular等技术开发过聊天室项目,另外还使用RN ...
随机推荐
- Python字典列表字段重组形成新的字典
最近遇到这样一个需求,需要将字典列表中的字段进行重组,形成一个新的字典.举个例子吧: l1 = [{"x": 22, "y": 22, "demand ...
- C#利用栈实现字符串运算解析
附上参考文章链接:https://blog.csdn.net/qq_34831781/article/details/80104219 本人整合修复一些bug后的代码 using System; us ...
- https://segmentfault.com 一个学习网站
https://segmentfault.com一个学习网站
- 剑指offer——31序列化二叉树
题目描述 请实现两个函数,分别用来序列化和反序列化二叉树 二叉树的序列化是指:把一棵二叉树按照某种遍历方式的结果以某种格式保存为字符串,从而使得内存中建立起来的二叉树可以持久保存.序列化可以基于先 ...
- 剑指offer——29顺时针打印矩阵
题目描述 输入一个矩阵,按照从外向里以顺时针的顺序依次打印出每一个数字,例如,如果输入如下4 X 4矩阵: 1 2 3 4 5 6 7 8 9 10 11 12 13 14 15 16 则依次打印出数 ...
- 剑指offer——28对称的二叉树
题目描述 请实现一个函数,用来判断一颗二叉树是不是对称的.注意,如果一个二叉树同此二叉树的镜像是同样的,定义其为对称的. 题解: 使用正常前序遍历与反向的前序遍历进行比较结果即可,注意,需将空 ...
- LightOJ 1341 - Aladdin and the Flying Carpet
题目链接:http://lightoj.com/volume_showproblem.php?problem=1341 题意:给你地毯面积和最小可能边的长度,让你求有几种组合的可能. 题解:这题就厉害 ...
- 43个实例xHTML+CSS(DIV+CSS)网页及导航布局
在中国,很多前端开发初学者都会把xHTML+CSS页面制作说成DIV+CSS,甚至很多人都还不知道xHTML+CSS是什么意思,只知道盲目的追求DIV+CSS,但在国外,是没有DIV+CSS这个概念的 ...
- git mac安装
1.git安装包安装 去官网下载最行的git版本 安装即可 https://git-scm.com/download/mac 但是一般的git仓库需要sshkey来做验证 下面奉上具体的命令: 需要生 ...
- OC开发系列-@property和@synthesize
property和synthesize 创建一个Person类.提供成员属性的_age和_height的setter和getter方法. #import <Foundation/Foundati ...