Highcharts 动态图
Highcharts 动态图
每秒更新曲线图
chart.events
chart.event 属性中添加 load 方法(图表加载事件)。在 1000 毫秒内随机产生数据点并生成图表。
chart: {

   events: {

      load: function () {

         // 图表每秒更新一次

         var series = this.series[0];

         setInterval(function () {

            var x = (new Date()).getTime(), // 当期时间

            y = Math.random();

            series.addPoint([x, y], true, true);

         }, 1000);

      }

   }

}
实例
文件名:highcharts_dynamic_spline.htm
<html>

<head>

<meta charset="UTF-8" />

<title>Highcharts 教程 | 菜鸟教程(runoob.com)</title>

<script src="http://apps.bdimg.com/libs/jquery/2.1.4/jquery.min.js"></script>

<script src="http://code.highcharts.com/highcharts.js"></script></head>

<body>

<div id="container" style="width: 550px; height: 400px; margin: 0 auto"></div>

<script language="JavaScript">

$(document).ready(function() {

   var chart = {

      type: 'spline',

      animation: Highcharts.svg, // don't animate in IE < IE 10.

      marginRight: 10,

      events: {

         load: function () {

            // set up the updating of the chart each second

            var series = this.series[0];

            setInterval(function () {

               var x = (new Date()).getTime(), // current time

               y = Math.random();

               series.addPoint([x, y], true, true);

            }, 1000);

         }

      }

   };

   var title = {

      text: 'Live random data'

   };

   var xAxis = {

      type: 'datetime',

      tickPixelInterval: 150

   };

   var yAxis = {

      title: {

         text: 'Value'

      },

      plotLines: [{

         value: 0,

         width: 1,

         color: '#808080'

      }]

   };

   var tooltip = {

      formatter: function () {

      return '<b>' + this.series.name + '</b><br/>' +

         Highcharts.dateFormat('%Y-%m-%d %H:%M:%S', this.x) + '<br/>' +

         Highcharts.numberFormat(this.y, 2);

      }

   };

   var plotOptions = {

      area: {

         pointStart: 1940,

         marker: {

            enabled: false,

            symbol: 'circle',

            radius: 2,

            states: {

               hover: {

                 enabled: true

               }

            }

         }

      }

   };

   var legend = {

      enabled: false

   };

   var exporting = {

      enabled: false

   };

   var series= [{

      name: 'Random data',

      data: (function () {

         // generate an array of random data

         var data = [],time = (new Date()).getTime(),i;

         for (i = -19; i <= 0; i += 1) {

            data.push({

               x: time + i * 1000,

               y: Math.random()

            });

         }

         return data;

      }())

   }];

   var json = {};

   json.chart = chart;

   json.title = title;

   json.tooltip = tooltip;

   json.xAxis = xAxis;

   json.yAxis = yAxis;

   json.legend = legend;

   json.exporting = exporting;

   json.series = series;

   json.plotOptions = plotOptions;Highcharts.setOptions({

      global:{

         useUTC:false}});

   $('#container').highcharts(json);});</script></body></html>
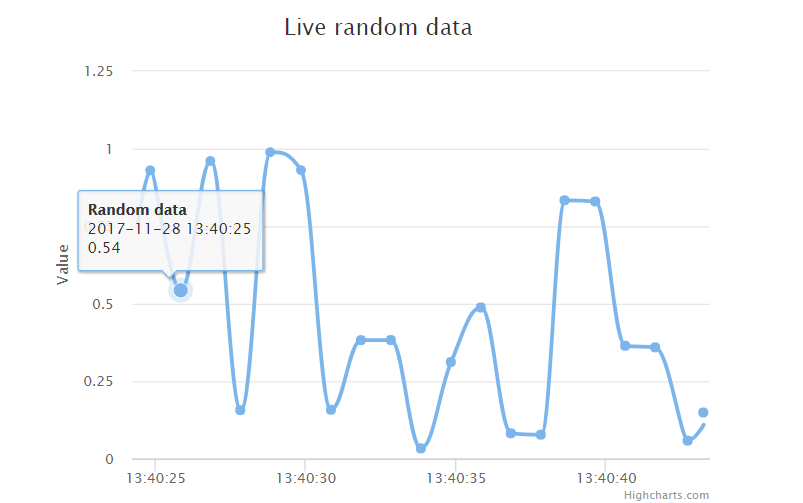
以上实例输出结果为:
通过点击添加数据
chart.events
在 chart.event 属性中添加 click 方法(整个图表的绘图区上所发生的点击事件)。该方法在图表绘图区上发生点击时会添加新的数据点。
chart: {

   events: {

      click: function (e) {

         // 获取点击坐标和数据项

         var x = e.xAxis[0].value,

         y = e.yAxis[0].value,

         series = this.series[0];

         // 添加点击的坐标

         series.addPoint([x, y]);

      }

   }

}
实例
文件名:highcharts_dynamic_click.htm
<html>

<head>

<title>Highcharts 教程 | 菜鸟教程(runoob.com)</title>

   <script src="http://apps.bdimg.com/libs/jquery/2.1.4/jquery.min.js"></script>

   <script src="/try/demo_source/highcharts.js"></script>

</head>

<body>

<div id="container" style="width: 550px; height: 400px; margin: 0 auto"></div>

<script language="JavaScript">

$(document).ready(function() {

   var chart = {

      type: 'scatter',

      margin: [70, 50, 60, 80],

      events: {

         click: function (e) {

            // find the clicked values and the series

            var x = e.xAxis[0].value,

            y = e.yAxis[0].value,

            series = this.series[0];

            // Add it

            series.addPoint([x, y]);

         }

      }

   };

   var title = {

      text: 'User supplied data'

   };

   var subtitle = {

      text: 'Click the plot area to add a point. Click a point to remove it.'

   };

   var xAxis = {

      gridLineWidth: 1,

      minPadding: 0.2,

      maxPadding: 0.2,

      maxZoom: 60

   };

   var yAxis = {

      title: {

         text: 'Value'

      },

      minPadding: 0.2,

      maxPadding: 0.2,

      maxZoom: 60,

      plotLines: [{

         value: 0,

         width: 1,

         color: '#808080'

      }]

   };

   var legend = {

      enabled: false

   };

   var exporting = {

      enabled: false

   };

   var plotOptions = {

      series: {

         lineWidth: 1,

         point: {

            events: {

               'click': function () {

                  if (this.series.data.length > 1) {

                     this.remove();

                  }

               }

            }

         }

      }

   };


   var series= [{

      data: [[20, 20], [80, 80]]

   }];

   var json = {};

   json.chart = chart;

   json.title = title;

   json.subtitle = subtitle;

   json.xAxis = xAxis;

   json.yAxis = yAxis;

   json.legend = legend;

   json.exporting = exporting;

   json.series = series;

   json.plotOptions = plotOptions;

   $('#container').highcharts(json);

});

</script>

</body>

</html>
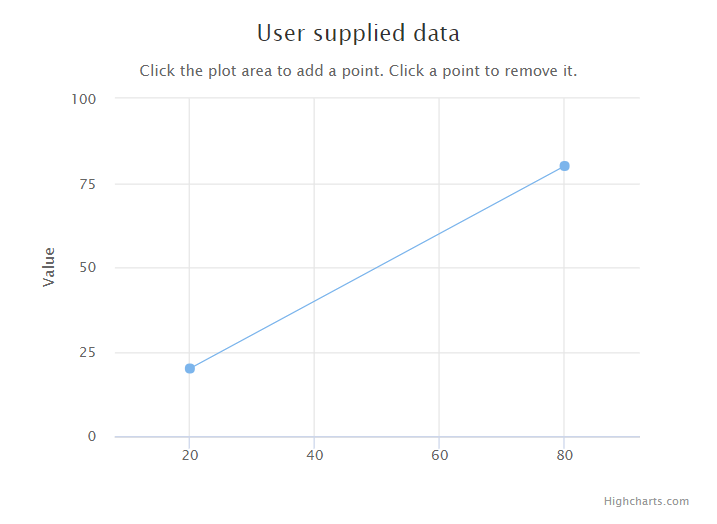
以上实例输出结果为:
Highcharts 动态图的更多相关文章
- HighChartS cpu利用率动态图(Java版)
来源:http://www.cnblogs.com/haifg/p/3217699.html 最近项目需要监控服务器cpu的利用率,并做成动态图.在网上查找了一些资料,最终选择了HighChart ...
- Wpf 中使用gif格式的动态图
第一种方法:使用winform插件 <WindowsFormsHost xmlns:wf="clr-namespace:System.Windows.Forms;assembly=S ...
- 在sublime text 中的Emmet快捷键动态图演示
Emmet的前身是大名鼎鼎的Zen coding,如果你从事Web前端开发的话,对该插件一定不会陌生.它使用仿CSS选择器的语法来生成代码,大大提高了HTML/CSS代码编写的速度,比如下面的演示: ...
- GIMP也疯狂之动态图的制作(四)
本篇文章为gimp制作动态图的第四篇.在之前的基础上简单的拓展了下思路.就能做出蛮实用的动态图.本文将介绍两个动态图.第一个为在一张静态图上添加动态图,第二个图为修改部分渐变. 效果: 素材: 其实, ...
- GIMP也疯狂之动态图的制作(三)
Note:本篇文章内容为linux下利用gimp和其它工具组合完成截取制作GIF图的一种实现,制作更为灵活,但并不方便,如果不需要那么高的定制性,并追求方便高效.可以使用类似QQ影音之类的软件,自带截 ...
- iOS开发中在UIWebView中添加Gif动态图
开发是一件很有趣的事,偶尔在程序中添加一些小东西,会给你的应用增色不少.比如,当你的某些功能暂时还不准备上线时,可以先一个放展示Gif动态图的UIWebView上去,既可以告诉用户APP以后会有的功能 ...
- 那些过目不忘的无线端交互设计(DRIBBBLE GIF动态图)
Dribbble精选:Dribbble上令人惊叹的无线端交互设计!来自全球牛人们的奇思妙想,新颖动人的交互在这一张张GIF动态图上一览无余!当然界面一样打动人心,腾出手点赞的同时!记得另存哟:) 作者 ...
- GIF动态图制作
GIF动态图制作 博客写了也有一阵了,一直好奇大牛的博客里demo的动态图是怎么做的,今天抽空研究了一下,找了一个软件,以后再发现有好的工具再继续推荐 GIF制作工具--LICEcap 效果要比下面的 ...
- 4.14Python数据处理篇之Matplotlib系列(十四)---动态图的绘制
目录 目录 前言 (一)需求分析 (二)随机数的动态图 1.思路分析: 2.源代码: 2.输出效果: 目录 前言 学习matplotlib已经到了尾声,没有必要再继续深究下去了,现今只是学了一些基础的 ...
随机推荐
- The 15th UESTC Programming Contest Preliminary D - Destr0y City cdoj1558
地址:http://acm.uestc.edu.cn/#/problem/show/1558 题目: D - Destr0y City Time Limit: 3000/1000MS (Java/Ot ...
- SqlHelper简单实现(通过Expression和反射)9.Sql表述对象SqlSession
此类是整个SqlHelper的另一个核心,基本思想就是通过EntityHelper,ObjectHelper和ExpressionHelper获取拼接Select语句的全部元素,拼接出完整Select ...
- 647. Palindromic Substrings(马拉车算法)
问题 求一个字符串有多少个回文子串 Input: "abc" Output: 3 Input: "aaa" Output: 6 思路和代码(1)--朴素做法 用 ...
- centos7下配置iptables实现外网访问内网服务器
说明:Centos 7 默认的防火墙是 firewall,安装iptables之前需关闭Firewall 外网机器:外网ip:120.25.71.183内网ip:10.1.1.23 内网机器:内网ip ...
- 使用Node.js快速搭建简单的静态文件服务器
做前端有时会采用一些复杂框架,在文件系统中直接打开页面(用file:///方式打开),往往会报跨域的错,类似于“XMLHttpRequest cannot load ...(文件名). Cross o ...
- JAVA学习笔记之JAVA 对象引用以及赋值
关于对象与引用之间的一些基本概念. 初学Java时,在很长一段时间里,总觉得基本概念很模糊.后来才知道,在许多Java书中,把对象和对象的引用混为一谈.可是,如果我分不清对象与对象引用, 那实在没 ...
- jquery阻止事件冒泡的方法
$("table tbody").click(function(e) { e.preventDefault(); //阻止自身的事件,并不能阻止冒泡 e.stopPropagati ...
- MBR主引导记录
LBA的寻址方式可以让我们支持2TB,这是因为分区相对起始扇区号(分区项08-11个字节)和分区最大扇区数(分区项12-15个字节)的位数都是32bit.也就是0xFFFFFFFF*512/1024/ ...
- 20145328 《Java程序设计》第10周学习总结
20145328 <Java程序设计>第10周学习总结 资料学习内容总结 网络编程 13.1 网络概述 网络编程技术是当前一种主流的编程技术,随着联网趋势的逐步增强以及网络应用程序的大量出 ...
- 20145331《Java程序设计》第5周学习总结
20145331<Java程序设计>第5周学习总结 教材学习内容总结 第八章 概述 Java异常机制主要依赖于try.catch.finally.throw.throws五个关键字. 语法 ...