简单4步,利用Prometheus Operator实现自定义指标监控
本文来自Rancher Labs
在过去的文章中,我们花了相当大的篇幅来聊关于监控的话题。这是因为当你正在管理Kubernetes集群时,一切都会以极快的速度发生变化。因此有一个工具来监控集群的健康状态和资源指标极为重要。
在Rancher 2.5中,我们引入了基于Prometheus Operator的新版监控,它可以提供Prometheus以及相关监控组件的原生Kubernetes部署和管理。Prometheus Operator可以让你监控集群节点、Kubernetes组件和应用程序工作负载的状态和进程。同时,它还能够通过Prometheus收集的指标来定义告警并且创建自定义仪表盘,通过Grafana可以轻松地可视化收集到的指标。你可以访问下列链接获取更多关于新版监控组件的细节:
https://rancher.com/docs/rancher/v2.x/en/monitoring-alerting/v2.5/
新版本的监控也采用prometheus-adapter,开发人员可以利用其基于自定义指标和HPA扩展他们的工作负载。
在本文中,我们将探索如何利用Prometheus Operator来抓取自定义指标并利用这些指标进行高级工作负载管理。
安装Prometheus
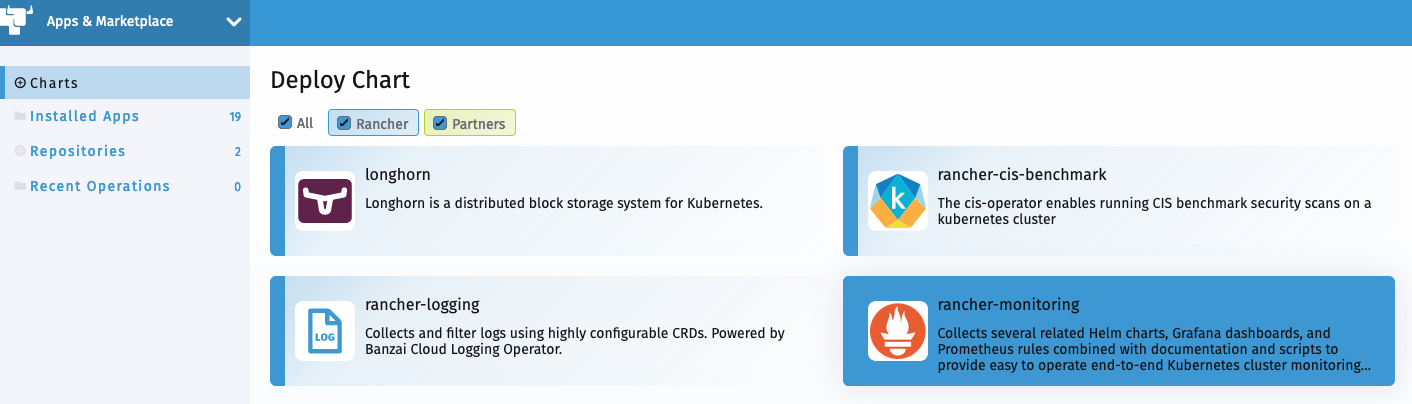
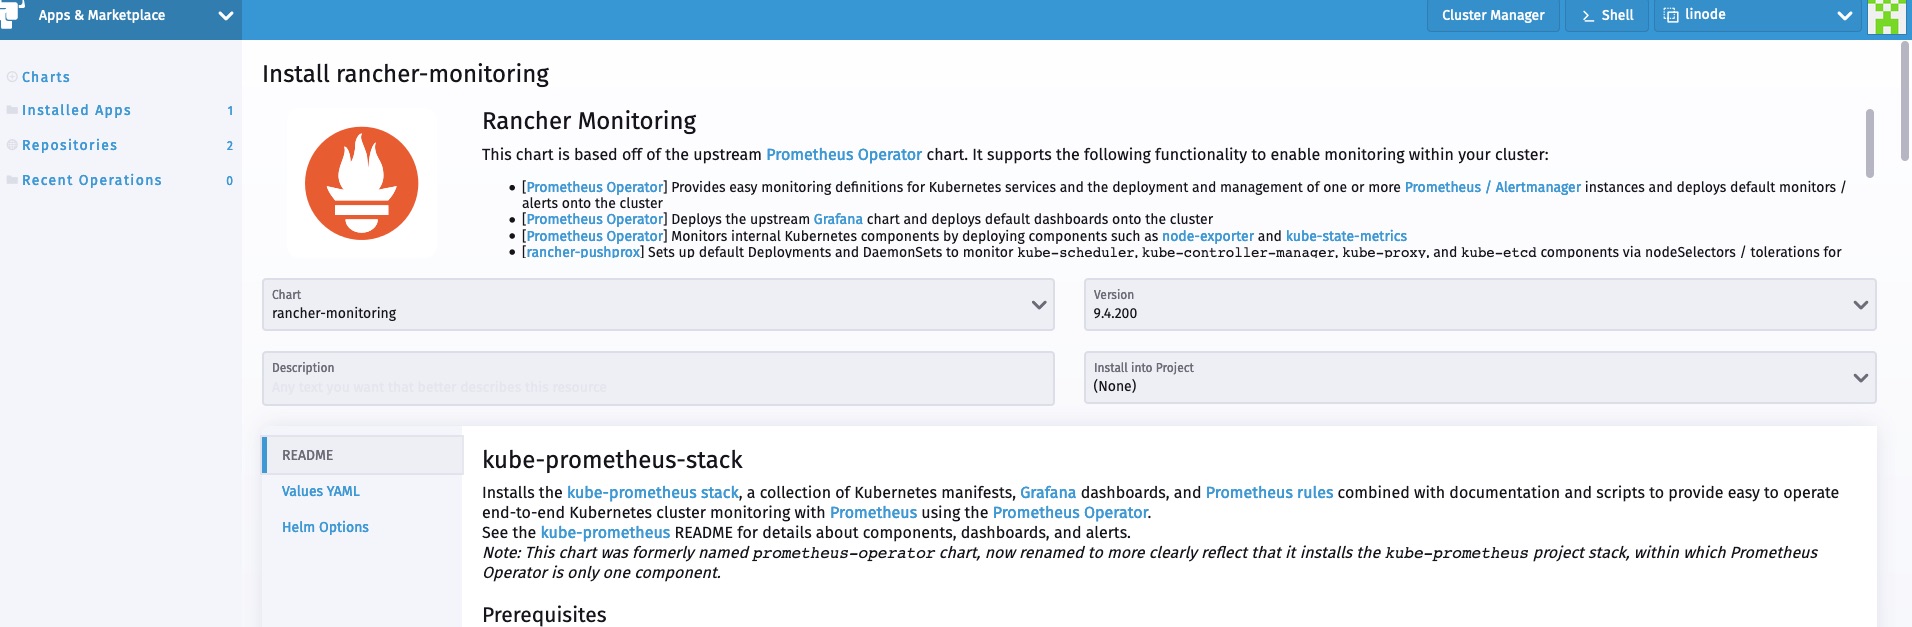
在Rancher 2.5中安装Prometheus极为简单。仅需访问Cluster Explorer -> Apps并安装rancher-monitoring即可。
你需要了解以下默认设置:
prometheus-adapter将会作为chart安装的一部分启用ServiceMonitorNamespaceSelector留为空,允许 Prometheus 在所有命名空间中收集 ServiceMonitors
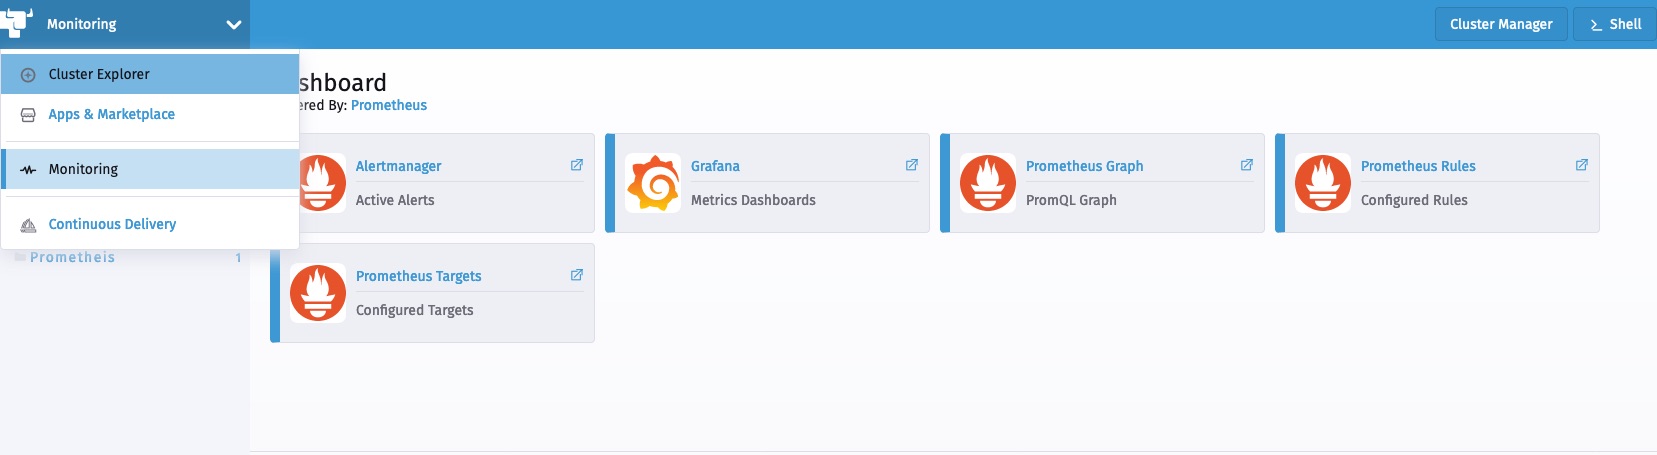
安装完成后,我们可以从Cluster Explorer访问监控组件。
部署工作负载
现在让我们部署一个从应用层暴露自定义指标的示例工作负载。该工作负载暴露了一个简单的应用程序,该应用程序已经使用Prometheus client_golang库进行了检测,并在/metric端点上提供了一些自定义指标。
它有两个指标:
http_requests_total
http_request_duration_seconds
以下manifest部署了工作负载、相关服务以及访问该工作负载的ingress:
apiVersion: apps/v1

kind: Deployment

metadata:

  labels:

    app.kubernetes.io/name: prometheus-example-app

  name: prometheus-example-app

spec:

  replicas: 1

  selector:

    matchLabels:

      app.kubernetes.io/name: prometheus-example-app

  template:

    metadata:

      labels:

        app.kubernetes.io/name: prometheus-example-app

    spec:

      containers:

      - name: prometheus-example-app

        image: gmehta3/demo-app:metrics

        ports:

        - name: web

          containerPort: 8080

---

apiVersion: v1

kind: Service

metadata:

  name: prometheus-example-app

  labels:

    app.kubernetes.io/name: prometheus-example-app

spec:

  selector:

    app.kubernetes.io/name: prometheus-example-app

  ports:

    - protocol: TCP

      port: 8080

      targetPort: 8080

      name: web

---

apiVersion: networking.k8s.io/v1beta1

kind: Ingress

metadata:

    name: prometheus-example-app

spec:

    rules:

    - host: hpa.demo

      http:

        paths:

        - path: /

          backend:

            serviceName: prometheus-example-app

            servicePort: 8080
部署ServiceMonitor
ServiceMonitor是一个自定义资源定义(CRD),可以让我们声明性地定义如何监控一组动态服务。
你可以访问以下链接查看完整的ServiceMonitor规范:
现在,我们来部署ServiceMonitor,Prometheus用它来收集组成prometheus-example-app Kubernetes服务的pod。
kind: ServiceMonitor

metadata:

  name: prometheus-example-app

spec:

  selector:

    matchLabels:

      app.kubernetes.io/name: prometheus-example-app

  endpoints:

  - port: web
如你所见,现在用户可以在Rancher监控中浏览ServiceMonitor。

不久之后,新的service monitor和服务相关联的pod应该会反映在Prometheus服务发现中。
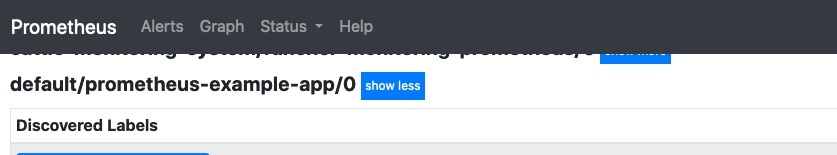
我们也能够在Prometheus中看到指标。

部署Grafana仪表盘
在Rancher 2.5中,监控可以让用户将Grafana仪表盘存储为cattle-dashboards命名空间中的ConfigMaps。
用户或集群管理员现在可以在这一命名空间中添加更多的仪表盘以扩展Grafana的自定义仪表盘。
Dashboard ConfigMap Example
apiVersion: v1

kind: ConfigMap

metadata:

  name: prometheus-example-app-dashboard

  namespace: cattle-dashboards

  labels:

    grafana_dashboard: "1"

data:

  prometheus-example-app.json: |

    {

    "annotations": {

        "list": [

        {

            "builtIn": 1,

            "datasource": "-- Grafana --",

            "enable": true,

            "hide": true,

            "iconColor": "rgba(0, 211, 255, 1)",

            "name": "Annotations & Alerts",

            "type": "dashboard"

        }

        ]

    },

    "editable": true,

    "gnetId": null,

    "graphTooltip": 0,

    "links": [],

    "panels": [

        {

        "aliasColors": {},

        "bars": false,

        "dashLength": 10,

        "dashes": false,

        "datasource": null,

        "fieldConfig": {

            "defaults": {

            "custom": {}

            },

            "overrides": []

        },

        "fill": 1,

        "fillGradient": 0,

        "gridPos": {

            "h": 9,

            "w": 12,

            "x": 0,

            "y": 0

        },

        "hiddenSeries": false,

        "id": 2,

        "legend": {

            "avg": false,

            "current": false,

            "max": false,

            "min": false,

            "show": true,

            "total": false,

            "values": false

        },

        "lines": true,

        "linewidth": 1,

        "nullPointMode": "null",

        "percentage": false,

        "pluginVersion": "7.1.5",

        "pointradius": 2,

        "points": false,

        "renderer": "flot",

        "seriesOverrides": [],

        "spaceLength": 10,

        "stack": false,

        "steppedLine": false,

        "targets": [

            {

            "expr": "rate(http_requests_total{code=\"200\",service=\"prometheus-example-app\"}[5m])",

            "instant": false,

            "interval": "",

            "legendFormat": "",

            "refId": "A"

            }

        ],

        "thresholds": [],

        "timeFrom": null,

        "timeRegions": [],

        "timeShift": null,

        "title": "http_requests_total_200",

        "tooltip": {

            "shared": true,

            "sort": 0,

            "value_type": "individual"

        },

        "type": "graph",

        "xaxis": {

            "buckets": null,

            "mode": "time",

            "name": null,

            "show": true,

            "values": []

        },

        "yaxes": [

            {

            "format": "short",

            "label": null,

            "logBase": 1,

            "max": null,

            "min": null,

            "show": true

            },

            {

            "format": "short",

            "label": null,

            "logBase": 1,

            "max": null,

            "min": null,

            "show": true

            }

        ],

        "yaxis": {

            "align": false,

            "alignLevel": null

        }

        },

        {

        "aliasColors": {},

        "bars": false,

        "dashLength": 10,

        "dashes": false,

        "datasource": null,

        "description": "",

        "fieldConfig": {

            "defaults": {

            "custom": {}

            },

            "overrides": []

        },

        "fill": 1,

        "fillGradient": 0,

        "gridPos": {

            "h": 8,

            "w": 12,

            "x": 0,

            "y": 9

        },

        "hiddenSeries": false,

        "id": 4,

        "legend": {

            "avg": false,

            "current": false,

            "max": false,

            "min": false,

            "show": true,

            "total": false,

            "values": false

        },

        "lines": true,

        "linewidth": 1,

        "nullPointMode": "null",

        "percentage": false,

        "pluginVersion": "7.1.5",

        "pointradius": 2,

        "points": false,

        "renderer": "flot",

        "seriesOverrides": [],

        "spaceLength": 10,

        "stack": false,

        "steppedLine": false,

        "targets": [

            {

            "expr": "rate(http_requests_total{code!=\"200\",service=\"prometheus-example-app\"}[5m])",

            "interval": "",

            "legendFormat": "",

            "refId": "A"

            }

        ],

        "thresholds": [],

        "timeFrom": null,

        "timeRegions": [],

        "timeShift": null,

        "title": "http_requests_total_not_200",

        "tooltip": {

            "shared": true,

            "sort": 0,

            "value_type": "individual"

        },

        "type": "graph",

        "xaxis": {

            "buckets": null,

            "mode": "time",

            "name": null,

            "show": true,

            "values": []

        },

        "yaxes": [

            {

            "format": "short",

            "label": null,

            "logBase": 1,

            "max": null,

            "min": null,

            "show": true

            },

            {

            "format": "short",

            "label": null,

            "logBase": 1,

            "max": null,

            "min": null,

            "show": true

            }

        ],

        "yaxis": {

            "align": false,

            "alignLevel": null

        }

        }

    ],

    "schemaVersion": 26,

    "style": "dark",

    "tags": [],

    "templating": {

        "list": []

    },

    "time": {

        "from": "now-15m",

        "to": "now"

    },

    "timepicker": {

        "refresh_intervals": [

        "5s",

        "10s",

        "30s",

        "1m",

        "5m",

        "15m",

        "30m",

        "1h",

        "2h",

        "1d"

        ]

    },

    "timezone": "",

    "title": "prometheus example app",

    "version": 1

    }
现在,用户应该能够在Grafana中访问prometheus example app的仪表盘。
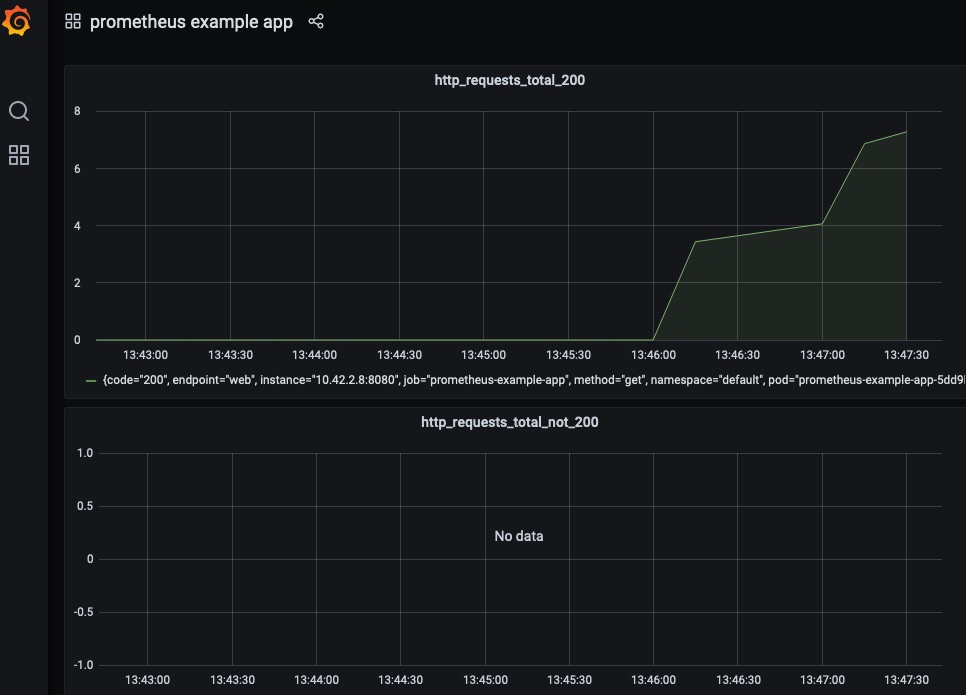
自定义指标的HPA
这一部分假设你已经将prometheus-adapter作为监控的一部分安装完毕了。实际上,在默认情况下,监控安装程序会安装prometheus-adapter。
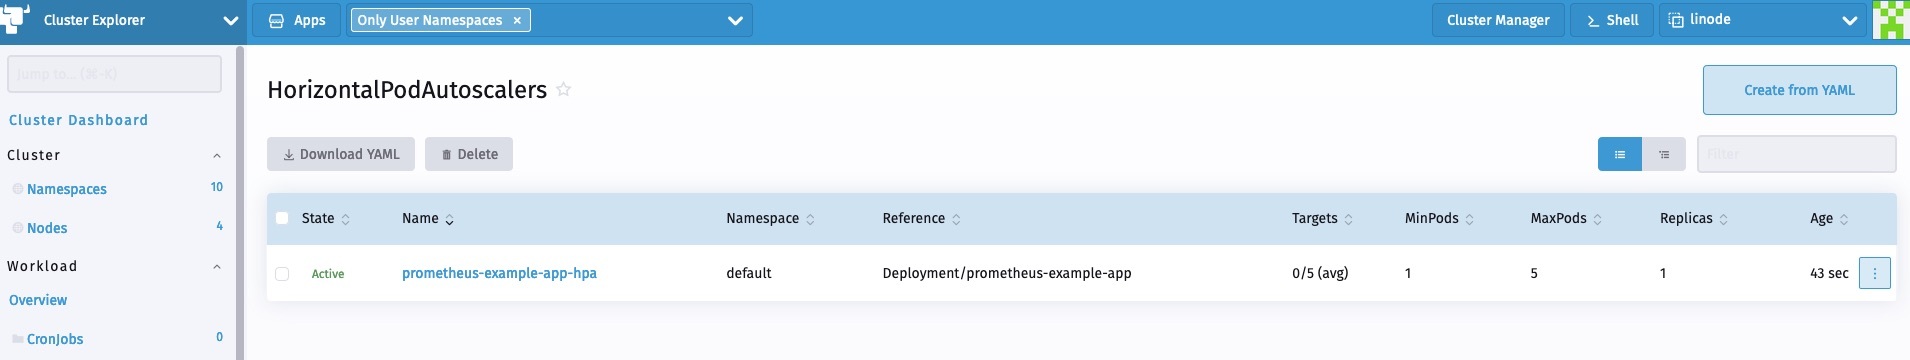
用户现在可以创建一个HPA spec,如下所示:
apiVersion: autoscaling/v2beta2

kind: HorizontalPodAutoscaler

metadata:

  name: prometheus-example-app-hpa

spec:

  scaleTargetRef:

    apiVersion: apps/v1

    kind: Deployment

    name: prometheus-example-app

  minReplicas: 1

  maxReplicas: 5

  metrics:

  - type: Object

    object:

        describedObject:

            kind: Service

            name: prometheus-example-app

        metric:

            name: http_requests

        target:

            averageValue: "5"

            type: AverageValue
你可以查看以下链接获取关于HPA的更多信息:
https://kubernetes.io/docs/tasks/run-application/horizontal-pod-autoscale/
我们将使用自定义的http_requests_total指标来执行pod自动伸缩。
现在我们可以生成一个样本负载来查看HPA的运行情况。我可以使用hey进行同样的操作。
hey -c 10 -n 5000 http://hpa.demo
总 结
在本文中,我们探讨了Rancher 2.5中新监控的灵活性。开发人员和集群管理员可以利用该堆栈来监控它们的工作负载,部署可视化,并利用Kubernetes内可用的高级工作负载管理功能。
简单4步,利用Prometheus Operator实现自定义指标监控的更多相关文章
- Golang 基于Prometheus Node_Exporter 开发自定义脚本监控
Golang 基于Prometheus Node_Exporter 开发自定义脚本监控 公司是今年决定将一些传统应用从虚拟机上迁移到Kubernetes上的,项目多而乱,所以迁移工作进展缓慢,为了建立 ...
- 基于 prometheus 的微服务指标监控
基于prometheus的微服务指标监控 服务上线后我们往往需要对服务进行监控,以便能及早发现问题并做针对性的优化,监控又可分为多种形式,比如日志监控,调用链监控,指标监控等等.而通过指标监控能清晰的 ...
- Kubernetes 监控:Prometheus Adpater =》自定义指标扩缩容
使用 Kubernetes 进行容器编排的主要优点之一是,它可以非常轻松地对我们的应用程序进行水平扩展.Pod 水平自动缩放(HPA)可以根据 CPU 和内存使用量来扩展应用,前面讲解的 HPA 章节 ...
- Kubernetes 监控:Prometheus Operator
安装 前面的章节中我们学习了用自定义的方式来对 Kubernetes 集群进行监控,基本上也能够完成监控报警的需求了.但实际上对上 Kubernetes 来说,还有更简单方式来监控报警,那就是 Pro ...
- Prometheus Operator 自动发现和持久化
Prometheus Operator 自动发现和持久化 之前在 Prometheus Operator 下面自定义一个监控选项,以及自定义报警规则的使用.那么我们还能够直接使用前面课程中的自动发现功 ...
- prometheus operator 部署
prometheus operator 部署自定义记录 环境: k8s 1.11集群版本,kubeadm部署 docker 17.3.2版本 Centos 7系统 阿里云服务器 operator 源码 ...
- Kubernetes 监控方案之 Prometheus Operator(十九)
目录 一.Prometheus 介绍 1.1.Prometheus 架构 1.2.Prometheus Operator 架构 二.Helm 安装部署 2.1.Helm 客户端安装 2.2.Tille ...
- 部署 Prometheus Operator - 每天5分钟玩转 Docker 容器技术(179)
本节在实践时使用的是 Prometheus Operator 版本 v0.14.0.由于项目开发迭代速度很快,部署方法可能会更新,必要时请参考官方文档. 下载最新源码 git clone https: ...
- Prometheus Operator - 每天5分钟玩转 Docker 容器技术(177)
前面我们介绍了 Kubernetes 的两种监控方案 Weave Scope 和 Heapster,它们主要的监控对象是 Node 和 Pod.这些数据对 Kubernetes 运维人员是必须的,但还 ...
随机推荐
- PyQt+moviepy音视频剪辑实战1:多视频合成顺序播放或同屏播放的视频文件
专栏:Python基础教程目录 专栏:使用PyQt开发图形界面Python应用 专栏:PyQt入门学习 老猿Python博文目录 老猿学5G博文目录 一.引言 在<moviepy音视频剪辑:音视 ...
- Python使用property函数和使用@property装饰器定义属性访问方法的异同点分析
Python使用property函数和使用@property装饰器都能定义属性的get.set及delete的访问方法,他们的相同点主要如下三点: 1.定义这些方法后,代码中对相关属性的访问实际上都会 ...
- PyQt学习随笔:重写setData方法截获Model/View中视图数据项编辑的注意事项
根据<PyQt学习随笔:Model/View中视图数据项编辑变动实时获取变动数据的方法>可以重写从PyQt的Model类继承的setData方法来实时截获View中对数据的更改,但需要注意 ...
- PyQt(Python+Qt)学习随笔:QAbstractItemView的SelectionBehavior属性
老猿Python博文目录 老猿Python博客地址 一.概述 SelectionBehavior属性用于控制选择行为操作的数据单位,是指选择时选中数据是按行.按列还是按项来选择.SelectionBe ...
- Go语言的context包从放弃到入门
目录 一.Context包到底是干嘛用的 二.主协程退出通知子协程示例演示 主协程通知子协程退出 主协程通知有子协程,子协程又有多个子协程 三.Context包的核心接口和方法 context接口 e ...
- 使用docker与宿主机文件互相拷贝
1.从容器里面拷文件到宿主机 示例:容器名为s2-061_struts2_1,要从容器里面拷贝的文件路为:/usr/local/tomcat/webapps/test/js/test.js, 现在要将 ...
- JavaSE04-Switch&循环语句
1.Switch 格式: 1 switch (表达式) { 2 case 1: 3 语句体1; 4 break; 5 case 2: 6 语句体2; 7 break; 8 ... 9 default: ...
- Spark内核-部署模式
Master URL Meaning local 在本地运行,只有一个工作进程,无并行计算能力. local[K] 在本地运行,有K个工作进程,通常设置K为机器的CPU核心数量. local[*] 在 ...
- 网站开发学习Python实现-Django项目部署-同步之前写的博客(6.2.2)
@ 目录 1.说明 2.思路 3.代码 关于作者 1.说明 之前写的博客都在csdn和博客园中 要将博客同步到自己的博客网站中 因为都是使用markdown格式书写的,所以直接爬取上传就完事 2.思路 ...
- Python高级语法-多继承MRO相关-多继承顺序(4.5.1)
@ 目录 1.说明 2.代码 关于作者 1.说明 使用类的魔法方法__mro__ 可以查看他的父类调用顺序 还有调用父类的构造方法的时候,使用super调用,里面有C3算法支持,不会重复调用相同的祖先 ...