gnuplot examples
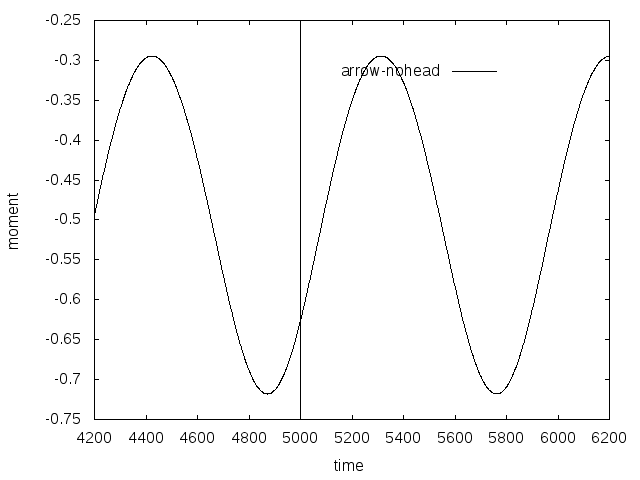
add dashed vertical line
#set terminal pdf

#set output 'c_p_tsr5.5_sine_udf_e387.pdf'

set terminal postscript eps enhanced color font 20 size 8in, 6in

set out 'vertical_line.eps'

#set terminal X11

set autoscale

unset log

unset label

unset pm3d

set key at graph .8, .9

set key spacing 1.2

set xtic auto

set ytic auto

set xlabel  "time"

set xrange [*:*]

# r0 initial pulse

set yrange [*:*]

set ylabel "moment"

set style line 1 lt 1 lc rgb "black" lw 1

set style line 2 lt 2 lc rgb "red" lw 4

set style line 3 lt 3 lc rgb "purple" lw 3

set style line 4 lt 4 lc rgb "blue" lw 3

set style line 5 lt 5 lc rgb "black" lw 2

set style line 6 lt 6 lc rgb "brown" lw 3

# vertical line

set arrow 1 from 5000,-0.75 to 5000,-0.25 nohead dt "."

plot "cm-sine-udf.out"  using 1:3 t "arrow-nohead" ls 1 with lines
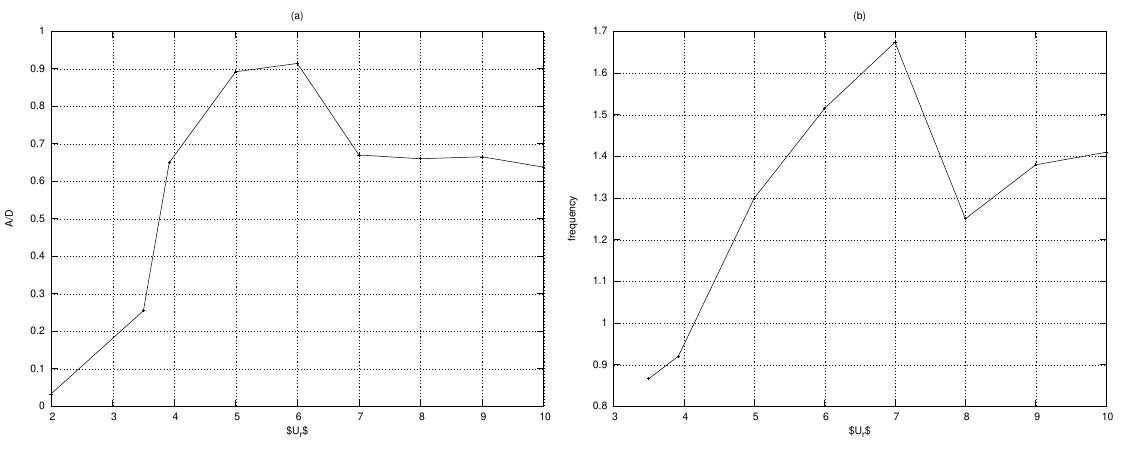
two figures side by side
# multiplot
#set terminal svg  font "Arial"enhanced size 700, 600

#set output "multiplt1.svg"

# eps

set terminal postscript eps font 10 size 7.5in, 6in

set out 'multiplt1.eps'

set style line 1  linecolor rgb "black"  linewidth 1.000 lt 1 pointtype 1 ps 0.5

set style line 2  linecolor rgb "black"  linewidth 2.000 lt 2 pointtype 3 ps 0.

set size 1.0, 0.5

set origin 0.0, 0.0

set multiplot

set grid

unset key

set angles radians

set samples 250

#####################  -- figure 1

set xtic auto

set ytic auto

set size 0.5, 0.5

set origin 0.0, 0.0

set title "(a)"

set xlabel "$U_r$"

set ylabel "A/D"

set label 1 "Damping =.1,.2,.3,.4,.5,.707,1.0,2.0" at .14,17

set xrange [*:*]

set yrange [*:*]

plot  "amp.txt"  using 1:8 t "0.0"  ls 1 with linespoints

#######################  -- figure 2

set xtic auto

set ytic auto

set size 0.5,0.5

set origin 0.5,0.0

set title "(b)"

set label 1 ""

set xlabel "$U_r$"

set ylabel "frequency"

set xrange [*:*]

set yrange [*:*]

plot  "fre.txt"  using 1:2 title "0.005"  ls 1 with linespoints

unset multiplot
single plot
Code:
# set terminal jpeg
# set output 'alfa_epp_a7.jpg'
# set terminal postscript eps font 20
# set out 'alfa_tsr_e387.eps'
set terminal pdf
set output 'alfa_tsr_e387.pdf'
# set terminal X11
set autoscale
unset log
unset label
unset pm3d
set key ins vert
set key samplen 1
set key at graph 1, 0.9
set key spacing 1
set xtic auto
set ytic auto
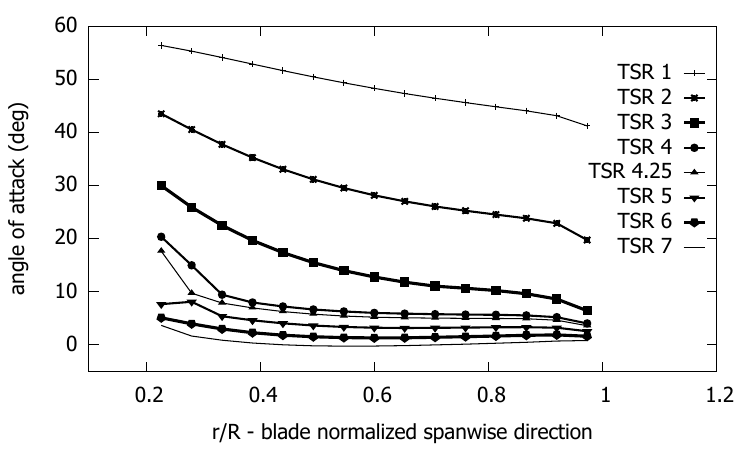
set xlabel "r/R - blade normalized spanwise direction"
set xrange [0.1:1.2]
# r0 initial pulse
set yrange [-5:*]
set ylabel "angle of attack (deg)"
set style line 1 linecolor rgb "black" linewidth 1.000 lt 1 pointtype 1 ps 0.5
set style line 2 linecolor rgb "black" linewidth 2.000 lt 2 pointtype 3 ps 0.5
set style line 3 linecolor rgb "black" linewidth 3.000 lt 3 pointtype 5 ps 0.5
set style line 4 linecolor rgb "black" linewidth 2.000 lt 4 pointtype 7 ps 0.5
set style line 5 linecolor rgb "black" linewidth 1.000 lt 5 pointtype 9 ps 0.5
set style line 6 linecolor rgb "black" linewidth 2.000 lt 6 pointtype 11 ps 0.5
set style line 7 linecolor rgb "black" linewidth 3.000 lt 7 pointtype 13 ps 0.5
set style line 7 linecolor rgb "black" linewidth 3.000 lt 7 pointtype 15 ps 0.5 plot "e387_bem/fort.101" using 1:2 t "TSR 1" ls 1 with linespoints,\
"e387_bem/fort.105" using 1:2 t "TSR 2" ls 2 with linespoints ,\
"e387_bem/fort.110" using 1:2 t "TSR 3" ls 3 with linespoints ,\
"e387_bem/fort.114" using 1:2 t "TSR 4" ls 4 with linespoints ,\
"e387_bem/fort.115" using 1:2 t "TSR 4.25" ls 5 with linespoints ,\
"e387_bem/fort.118" using 1:2 t "TSR 5" ls 6 with linespoints ,\
"e387_bem/fort.122" using 1:2 t "TSR 6" ls 7 with linespoints ,\
"e387_bem/fort.127" using 1:2 t "TSR 7" ls 8 with lines
output:
Code
#set terminal jpeg
#set output 'alfa.jpg'
set terminal postscript eps font 24
set out 'U_vs_X_tsr5.eps'
#set terminal X11
set autoscale
unset log
unset label
unset pm3d
set key at graph .99, .58
set key spacing 1
set xtic auto
set ytic auto
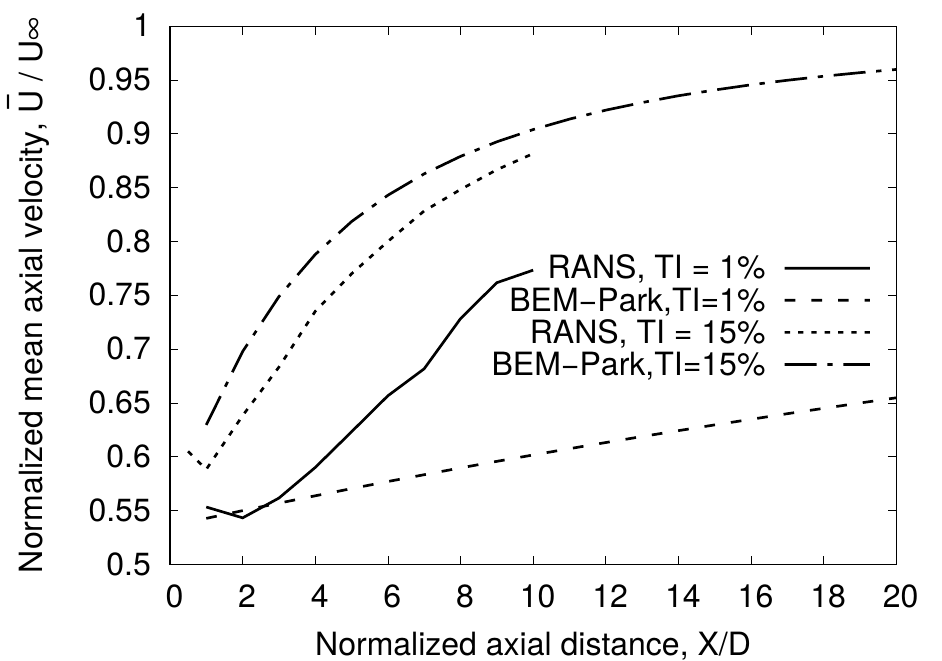
set xlabel "Normalized axial distance, X/D"
set xrange [*:*]
# r0 initial pulse
set yrange [*:*]
set ylabel "Normalized mean axial velocity, ~U{0.8-} / U{/Symbol \245}"
set style line 1 lt 1 lc rgb "black" lw 4 pt 1 ps 2
set style line 2 lt 2 lc rgb "black" lw 4 pt 3 ps 2
set style line 3 lt 3 lc rgb "black" lw 4 pt 5 ps 2
set style line 4 lt 4 lc rgb "black" lw 4 pt 7 ps 2
set style line 5 lt 5 lc rgb "black" lw 4
set style line 6 lt 6 lc rgb "brown" lw 4
#set label 1 "TSR 5" at graph .8, .9
plot "cfd/area_averaged_axial_mean_velocity_TI_1.txt" using 1:6 t "RANS, TI = 1%" ls 1 with lines,\
"park_model/wave_axial_velocity_tsr5_park_TI_1.txt" using 1:2 t "BEM-Park,TI=1%" ls 2 with lines,\
"cfd/area_averaged_axial_mean_velocity_TI_15.txt" using 1:6 t "RANS, TI = 15%" ls 3 with lines,\
"park_model/wave_axial_velocity_tsr5_park_TI_15.txt" using 1:2 t "BEM-Park,TI=15%" ls 4 with lines
example 2
important code
set key out horiz center top
#set terminal jpeg
#set output 'coeff_epp.jpg'
#set terminal png
#set output 'coeff_epp.png'
set terminal postscript eps font 24
set out 'coeff_naca0012.eps'
#set terminal X11
set autoscale
unset log
unset label
unset pm3d
set key out horiz center top
set xtic auto
set ytic auto
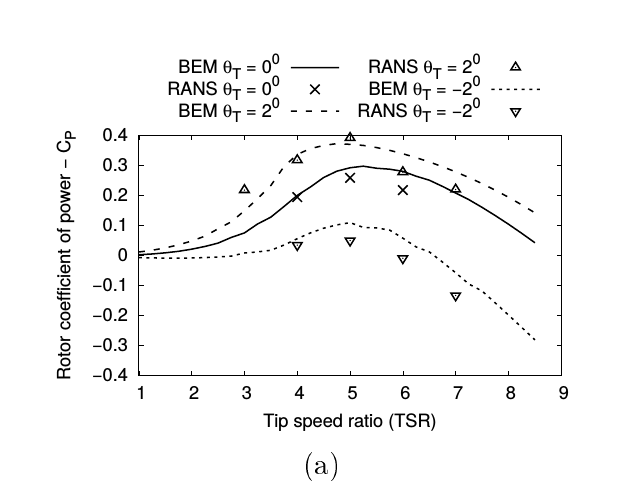
set xlabel "Tip speed ratio (TSR)"
set xrange [1:*]
# r0 initial pulse
set yrange [-0.4:0.4]
set ylabel "Rotor coefficient of power - C_P"
set style line 1 lt 1 lc rgb "black" lw 4 pointtype 2 pointsize 2
set style line 2 lt 2 lc rgb "black" lw 4 pointtype 7 pointsize 2
set style line 3 lt 3 lc rgb "black" lw 4 pointtype 6 pointsize 2
set style line 4 lt 4 lc rgb "black" lw 4 pointtype 8 pointsize 2
set style line 5 lt 5 lc rgb "black" lw 4 pointtype 10 pointsize 2
set style line 6 lt 6 lc rgb "brown" lw 4 pointtype 12 pointsize 2
set pointsize 2
set bars 3
plot "naca0012/re_135k/zero/coeff.plt" using 1:4 t "BEM {/Symbol q}_T = 0^{0}" ls 1 with lines ,\
"RANS/Cp_Ct_tsr_one_untwist.dat" using 1:2 t "RANS {/Symbol q}_T = 0^{0}" ls 1 with points ,\
"naca0012/re_135k/fwd_2/coeff.plt" using 1:4 t "BEM {/Symbol q}_T = 2^{0}" ls 2 with lines,\
"RANS/Cp_one_front_eldad_blade.dat" using 1:2 t "RANS {/Symbol q}_T = 2^{0}" ls 4 with points,\
"naca0012/re_135k/rear_2/coeff.plt" using 1:4 t "BEM {/Symbol q}_T = -2^{0}" ls 3 with lines,\
"RANS/Cp_Ct_tsr_one_rear.dat" using 1:2 t "RANS {/Symbol q}_T = -2^{0}" ls 5 with points
gnuplot examples的更多相关文章
- NS3 利用Gnuplot生成拥塞窗口例子fifth.cc的png图像
参考链接:一个ns-3的Gnuplot例子 命令: (1)首先将fifth.cc拷贝到scratch目录下(由于环境变量的因素,./waf编译只对scratch目录下的文件有效,也可以忽略此步,直接. ...
- Js: Extensible Calendar Examples
http://ext.ensible.comhttps://github.com/bmoeskau/Extensiblehttps://github.com/TeamupCom/extensibleh ...
- Selenium Xpath Tutorials - Identifying xpath for element with examples to use in selenium
Xpath in selenium is close to must required. XPath is element locator and you need to provide xpath ...
- https://github.com/chenghuige/tensorflow-exp/blob/master/examples/sparse-tensor-classification/
https://github.com/chenghuige/tensorflow-exp/blob/master/examples/sparse-tensor-classification/ ...
- gnuplot: 一种更为简洁的曲线,柱状图绘图软件
gnuplot: 一种更为简洁的曲线,柱状图绘图软件 gnuplot: 一种更为简洁的曲线,柱状图绘图软件 Zhong Xiewei Wed Jun 25 gnuplot简单介绍 关于gnuplot的 ...
- (转载)SQL Reporting Services (Expression Examples)
https://msdn.microsoft.com/en-us/library/ms157328(v=SQL.100).aspx Expressions are used frequently in ...
- Examples of MIB Variables - SNMP Tutorial
30.5 Examples of MIB Variables Versions 1 and 2 of SNMP each collected variables together in a singl ...
- DataBinding examples
Databinding in Windows Forms demo (CSWinFormDataBinding) /************************************* Modu ...
- https://developers.google.com/maps/documentation/javascript/examples/places-autocomplete-addressform
https://developers.google.com/maps/documentation/javascript/examples/places-autocomplete-addressform
随机推荐
- 【前端】JavaScript表达式-新手必看
转载请注明出处:http://www.cnblogs.com/shamoyuu/p/6145384.html 一.什么是表达式 表达式就是JavaScript里一个短句,JavaScript解释器会将 ...
- 【161】BASH相关文章链接
---恢复内容开始--- 1. Linux cat命令详解 --<cat>-- 新建文件 file1.txt,随便输入几行文字 cat 'file1.txt' #显示 'file1.tx ...
- Ruby和Swift的Range
意义 Swift Ruby [1, 2, 3, 4, 5] 1...5 1..5 [1, 2, 3, 4] 1..<5 1...5 ...
- E20170610-hm
presence n. 出席; 仪表; 风度; 鬼魂,神灵; defence n. 防御; 辩护; 防御工事; 后卫; phyle n. 种族,宗族; race n. 赛跑; 民族; 人种; ...
- 开车旅行 2012年NOIP全国联赛提高组(倍增+set)
开车旅行 2012年NOIP全国联赛提高组 时间限制: 1 s 空间限制: 128000 KB 题目等级 : 钻石 Diamond 题目描述 Description 小A 和小B决定利用 ...
- Akka源码分析-Akka-Streams-Materializer(1)
本博客逐步分析Akka Streams的源码,当然必须循序渐进,且估计会分很多篇,毕竟Akka Streams还是比较复杂的. implicit val system = ActorSystem(&q ...
- [HAOI2006]均分数据
题解 今天下午刚学了模拟退火 借这个题来总结下模拟退火的要注意的问题吧 1 : \(eps\)不要设的太大 2 : 初温\(T\)在2000左右就差不多可以了 3 : 注意题目要求是要求最大值还是最小 ...
- 51nod 1029 大数除法
1029 大数除法 基准时间限制:4 秒 空间限制:131072 KB 分值: 160 难度:6级算法题 收藏 关注 给出2个大整数A,B,计算A / B和A Mod B的结果. Input 第1 ...
- Android Error:Failed to resolve: com.afollestad:material-dialogs:
背景: 同事把Android项目直接考给了我...我在Android Studio上运行,然后提示: Error:Failed to resolve: com.afollestad:material- ...
- Selenium基于Python web自动化基础一 -- 基础汇总及简单操作
Selenium是UI层WEB端的自动化测试框架,也是目前市面上比较流行的自动化测试框架. ui层自动化测试本质是什么?模拟用户的真实操作行为. 基础汇总: 导入所需要的模块 from seleniu ...