
Matplotlib 绘制误差条图
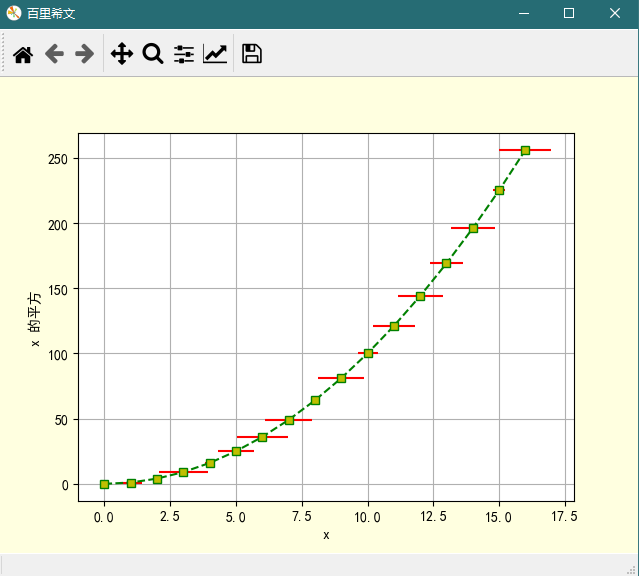
1、自变量的误差条
代码
import numpy as np

import matplotlib.pyplot as plt

plt.rcParams['font.sans-serif'] = 'SimHei'   # 使图形中的中文正常编码显示

plt.rcParams['axes.unicode_minus'] = False   # 使坐标轴刻度表签正常显示正负号

# 生成数据

x = np.arange(17)

error = np.random.rand(17)

y = np.power(x, 2)

# 设置画板属性

plt.figure('百里希文', facecolor='lightyellow')

# 绘制图形

plt.plot(x, y, 'gs--', mfc='y')

plt.errorbar(x, y, fmt='None', xerr=error, ecolor='r')

# 增加图形元素

plt.xlabel('x')

plt.ylabel('x 的平方')

plt.grid(1, axis='both')

plt.show()
图形
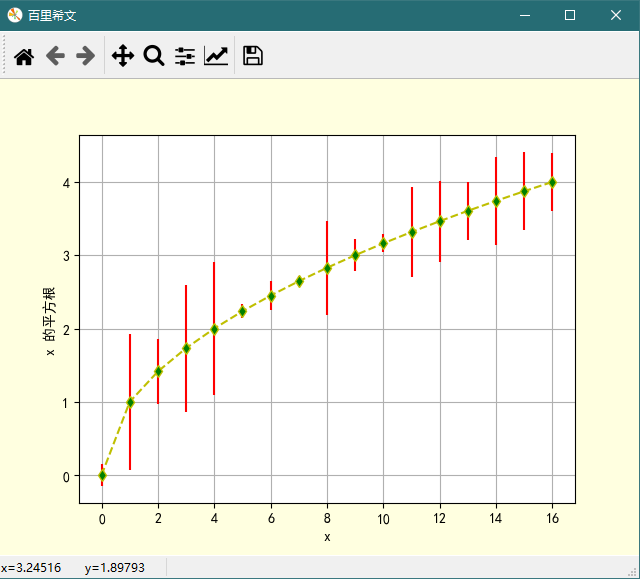
2、应变量的误差条
代码
import numpy as np

import matplotlib.pyplot as plt

plt.rcParams['font.sans-serif'] = 'SimHei'   # 使图形中的中文正常编码显示

plt.rcParams['axes.unicode_minus'] = False   # 使坐标轴刻度表签正常显示正负号

# 生成数据

x = np.arange(17)

error = np.random.rand(17)

y = np.sqrt(x)

# 设置画板属性

plt.figure('百里希文', facecolor='lightyellow')

# 绘制图形

plt.plot(x, y, 'yd--', mfc='g')

plt.errorbar(x, y, fmt='None', yerr=error, ecolor='r')

# 增加图形元素

plt.xlabel('x')

plt.ylabel('x 的平方根')

plt.grid(1, axis='both')

plt.show()
图形
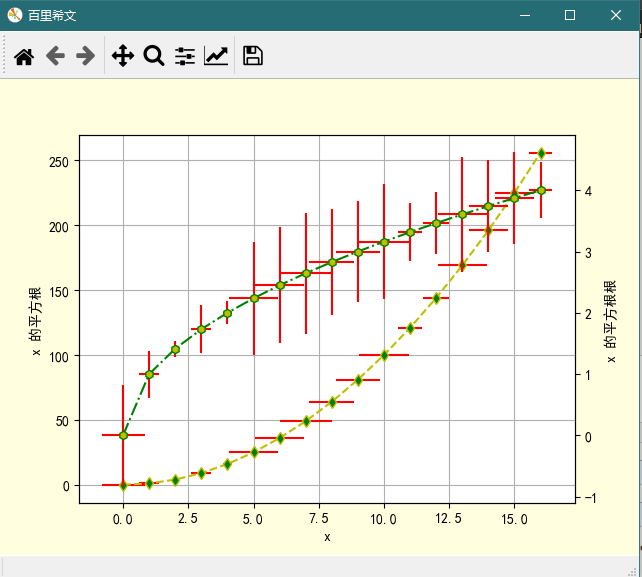
3 、混合图形
代码
import numpy as np

import pandas as pd

import matplotlib.pyplot as plt

plt.rcParams['font.sans-serif'] = 'SimHei'   # 使图形中的中文正常编码显示

plt.rcParams['axes.unicode_minus'] = False   # 使坐标轴刻度表签正常显示正负号

# 生成数据

x = np.arange(17)

error = np.random.rand(17)

y1 =np.power(x, 2)

y2 = np.sqrt(x)

# 设置画板属性

plt.figure('百里希文', facecolor='lightyellow')

# 在第一个坐标系绘制图形

ax = plt.gca()

ax.plot(x, y1, 'yd--', mfc='g')

ax.errorbar(x, y1, fmt='None', yerr=error, xerr=error, ecolor='r', marker='d')

ax.set_ylabel('x 的平方根')

ax.set_xlabel('x')

ax.xaxis.grid(1, 'both')

ax.yaxis.grid(1, 'both')

# 添加第二个 y 轴, 在第二坐标系绘图

ax2 = ax.twinx()

ax2.plot(x, y2, 'gh-.', mfc='y')

ax2.errorbar(x, y2, fmt='None', yerr=error, xerr=error, ecolor='r')

ax2.set_ylabel('x 的平方根根')

plt.show()
图形
。。。。
Matplotlib 绘制误差条图的更多相关文章
- 【转】使用Python matplotlib绘制股票走势图
转载出处 一.前言 matplotlib[1]是著名的python绘图库,它提供了一整套绘图API,十分适合交互式绘图.本人在工作过程中涉及到股票数据的处理如绘制K线等,因此将matplotlib的使 ...
- Python学习(一) —— matplotlib绘制三维轨迹图
在研究SLAM时常常需要对其输出的位姿进行复现以检测算法效果,在ubuntu系统中使用Python可以很好的完成相关的工作. 一. Ubuntu下Python的使用 在Ubuntu下使用Python有 ...
- matplotlib 绘制多个图——两种方法
import numpy as np import matplotlib.pyplot as plt #创建自变量数bai组du x= np.linspace(0,2*np.pi,500) #创建函数 ...
- 使用matplotlib绘制多轴图
一个绘图对象(figure)可以包含多个轴(axis),在Matplotlib中用轴表示一个绘图区域,可以将其理解为子图.上面的第一个例子中,绘图对象只包括一个轴,因此只显示了一个轴(子图).我们可以 ...
- R语言与医学统计图形-【12】ggplot2几何对象之条图
ggplot2绘图系统--几何对象之条图(包括误差条图) 1.条图 格式: geom_bar(mapping = , data = , stat = 'count', #统计变换默认计数 positi ...
- 用matplotlib绘制带误差的条形图及中英文字体设置
#!/usr/bin/env python3 ## 以下是一个带误差条的条形图的例子,演示了误差条形图的绘制及中英文字体设置 import numpy as np import matplotlib ...
- 1 matplotlib绘制折线图
from matplotlib import pyplot as plt #设置图形大小 plt.figure(figsize=(20,8),dpi=80) plt.plot(x,y,color=&q ...
- python使用matplotlib在一个图形中绘制多个子图以及一个子图中绘制多条动态折线问题
在讲解绘制多个子图之前先简单了解一下使用matplotlib绘制一个图,导入绘图所需库matplotlib并创建一个等间隔的列表x,将[0,2*pi]等分为50等份,绘制函数sin(x).当没有给定x ...
- python使用matplotlib绘制折线图教程
Matplotlib是一个Python工具箱,用于科学计算的数据可视化.借助它,Python可以绘制如Matlab和Octave多种多样的数据图形.下面这篇文章主要介绍了python使用matplot ...
随机推荐
- 容错框架之Hystrix小记
微服务框架下,一个服务依赖于很多服务.在高并发访问下,系统所依赖的服务的稳定性对系统的影响非常大,依赖有很多不可控的因素,比如网络连接变慢,资源突然繁忙,暂时不可用,服务脱机等,一个被调用服务出问题可 ...
- [LeetCode] 897. Increasing Order Search Tree 递增顺序查找树
Given a tree, rearrange the tree in in-order so that the leftmost node in the tree is now the root o ...
- [LeetCode] 45. Jump Game II 跳跃游戏之二
Given an array of non-negative integers, you are initially positioned at the first index of the arra ...
- Linux挖矿程序kworkerds分析
0×00 背景概述 近日,同伴的一台Linux服务器中了kworkerds挖矿程序,随即对挖矿程序进行了处理与分析. 0×01服务器现状 进入服务器之后通过top命令,没有发现有占用CPU资源过高的进 ...
- oracle--DBWN
一,DBWN功能 将脏数据写盘 二,什么情况下会触发DBWN的进程呢? 1) check pointer:有检查点, 2) 脏数据达到阀值:达到buffer内存的10%即要将脏数据写到磁盘: 这就是造 ...
- cloudstack4.11 centos7 安装文档
centos 7.x cloudstack 4.11 提示:生产环境 建议用ceph 块存储为主存储, 这里测试使用的是nfs主存储 组件 172.16.19.116 cloudstack ...
- SqlServer 通过日志恢复数据库
前期工作 查看数据属性,确保下条件: 1.数据库属性->选项->恢复模式=完整 2.建好库以后.一个数据库完整的数据备份 3.到出事期间日志没有你间断 4.记录出事的准确时间 一.数据准备 ...
- 微信小程序常用样式汇总
本文系转载: 原文作者:chenzheng8975 原文地址:https://www.cnblogs.com/chenzheng8975/p/9605186.html 微信小程序常用样式汇总 小程序特 ...
- 剑指Offer_Java_顺时针打印矩阵(二维数组)
顺(逆)时针打印矩阵 算法思想: 简单来说,就是不断地收缩矩阵的边界 定义四个变量代表范围,up(初始0).down(初始-行高).left(初始-0).right(初始-列宽), 向右走存入整行的值 ...
- .NET CORE 控制台应用程序配置log4net日志文件
使用文件格式记录日志 1.新建一个.NET CORE控制台应用程序,添加log4net.dll引用,打开工具->NuGet包管理器->管理解决方案的NuGet程序包. 2.在NuGet-解 ...