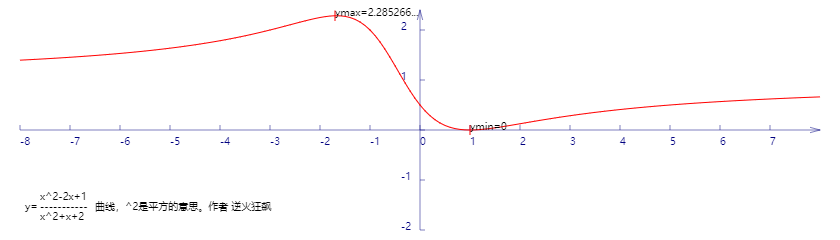
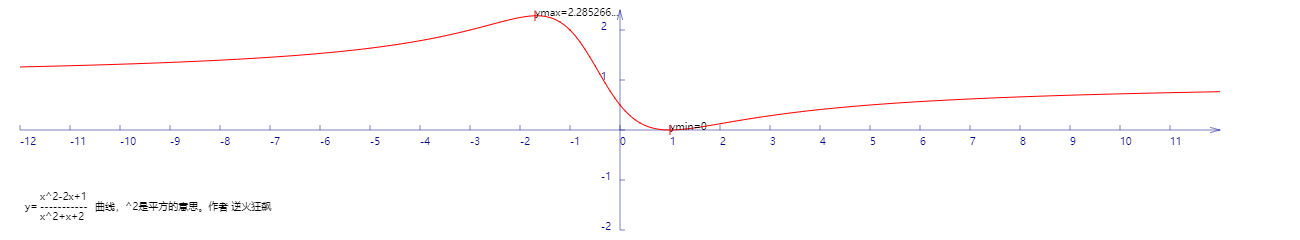
绘制函数y=(x^2-2x+1)/(x^2+x+2)的曲线
代码:
<!DOCTYPE html>
<html lang="utf-8">
<meta http-equiv="Content-Type" content="text/html; charset=utf-8"/>
<head>
     <title>函数曲线勾画</title>
    </head>

     <body onload="draw()">
        <canvas id="myCanvus" width="1300px" height="240px" style="border:1px dashed black;">
            出现文字表示你的浏览器不支持HTML5
        </canvas>
     </body>
</html>
<script type="text/javascript">
<!--
    function draw(){
        var canvas=document.getElementById("myCanvus");
        var canvasWidth=1300;
        var canvasHeight=240;

        var context=canvas.getContext("2d");

        context.fillStyle = "white";
        context.fillRect(0, 0, canvasWidth, canvasHeight);

        context.strokeStyle = "black";
        context.fillStyle = "black";

        //context.save();

        // 进行坐标变换:把原点放在左下角,东方为X轴正向,北方为Y轴正向
        var offsetY=110;// Y向偏移值,正值向上偏,用来画坐标轴
        var offsetX=620;// X向偏移值,正值向右偏,用来画坐标轴

        context.save();
        context.translate(0+offsetX,canvasHeight-offsetY);
        context.rotate(getRad(180));
        context.scale(-1,1);

        drawAxisX(context);
        drawAxisY(context);
        drawCurve(context);

        context.restore();

        context.fillText("x^2-2x+1",40,200);
        context.fillText("-----------",40,210);
        context.fillText("x^2+x+2",40,220);
        context.fillText("y=",25,210);
        context.fillText("曲线,^2是平方的意思。作者 逆火狂飙",95,210);
    }

    function drawCurve(ctx){
        var cds=[{}];// 初始化cds为空json

        var x,y;
        for(x=-12;x<=12;x+=0.1){
            y=(x*x-2*x+1)/(x*x+x+2);
            var arr={"x":x,"y":y};
            cds.push(arr);
        }

        // 将数组里面的点一段段连线
        var ymax=-4,ymin=4,xmax,xmin;

        ctx.strokeStyle = "red";
        ctx.beginPath();

        for(var i=0; i<cds.length; i++)
        {
            //console.log("x="+cds[i].x*50+" y="+cds[i].y*50);
            ctx.lineTo(cds[i].x*50,cds[i].y*50);

            // 求y最大值
            if(cds[i].y>ymax){
                ymax=cds[i].y;
                xmax=cds[i].x;
            }

            // 求y最小值
            if(cds[i].y<ymin){
                ymin=cds[i].y;
                xmin=cds[i].x;
            }
        }

        ctx.stroke();
        ctx.closePath();

        // 极大值
        ctx.beginPath();
        ctx.moveTo(xmax*50,ymax*50-5);
        ctx.lineTo(xmax*50,ymax*50+5);

        ctx.save();
        ctx.scale(1,-1);
        ctx.fillText("ymax="+cutShort(ymax.toString(),8),xmax*50,-ymax*50);
        ctx.restore();

        ctx.stroke();
        ctx.closePath();

        // 极小值
        ctx.beginPath();
        ctx.moveTo(xmin*50,ymin*50-5);
        ctx.lineTo(xmin*50,ymin*50+5);

        ctx.save();
        ctx.scale(1,-1);
        ctx.fillText("ymin="+ymin,xmin*50,-ymin*50);
        ctx.restore();

        ctx.stroke();
        ctx.closePath();
    }

    function drawAxisX(ctx){
        ctx.save();

        ctx.lineWidth=0.5;
        ctx.strokeStyle='navy';
        ctx.fillStyle='navy';

        var start=-600;
        var end=600;

        // 画轴
        ctx.beginPath();
        ctx.moveTo(start, 0);
        ctx.lineTo(end, 0);
        ctx.stroke();
        ctx.closePath();

        // 画箭头
        ctx.beginPath();
        ctx.moveTo(end-Math.cos(getRad(15))*10, Math.sin(getRad(15))*10);
        ctx.lineTo(end, 0);
        ctx.lineTo(end-Math.cos(getRad(15))*10, -Math.sin(getRad(15))*10);
        ctx.stroke();
        ctx.closePath();

        // 画刻度
        var x,y;
        y=5;
        for(x=start;x<end;x+=50){
            ctx.beginPath();
            ctx.moveTo(x, 0);
            ctx.lineTo(x, y);

            ctx.stroke();
            ctx.closePath();
        }

        // 写文字
        var i=0;
        for(x=start;x<end;x+=50){
            ctx.save();
            ctx.scale(1,-1);
            ctx.fillText(x/50,x,y+10);
            ctx.restore();
        }

        ctx.restore();
    }

    function drawAxisY(ctx){
        ctx.save();

        ctx.lineWidth=0.5;
        ctx.strokeStyle='navy';
        ctx.fillStyle='navy';

        var start=-100;
        var end=120;

        // 画轴
        ctx.beginPath();
        ctx.moveTo(0, start);
        ctx.lineTo(0, end);
        ctx.stroke();
        ctx.closePath();

        // 画箭头
        ctx.beginPath();
        ctx.moveTo(Math.sin(getRad(15))*10, end-Math.cos(getRad(15))*10);
        ctx.lineTo(0, end);
        ctx.lineTo(-Math.sin(getRad(15))*10, end-Math.cos(getRad(15))*10);
        ctx.stroke();
        ctx.closePath();

        // 画刻度
        var x,y;
        x=5;
        for(y=start;y<end;y+=50){
            ctx.beginPath();
            ctx.moveTo(x, y);
            ctx.lineTo(0, y);

            ctx.stroke();
            ctx.closePath();
        }

        // 写文字
        x=-19;
        for(y=start;y<end;y+=50){
            ctx.save();

            ctx.scale(1,-1);

            if(y!=0){
                ctx.fillText(-y/50,x,y);
            }

            ctx.restore();
        }

        ctx.restore();
    }

    function getRad(degree){
        return degree/180*Math.PI;
    }

    function cutShort(str,length){
        if(str.length>length){
            str=str.substr(0,length)+"...";
        }

        return str;
    }
//-->
</script>
绘制函数y=(x^2-2x+1)/(x^2+x+2)的曲线的更多相关文章
- 绘制函数 y=x^2-2x-3/2x^2+2x+1 的曲线
代码: <!DOCTYPE html> <html lang="utf-8"> <meta http-equiv="Content-Type ...
- 求函数 y=x^2-2x-3/2x^2+2x+1 的极值
解:展开函数式得到2yx2+2xy+y=x2-2x-3 继而得到(2y-1)x2+(2y+2)x+(y+3)=0 将上式看作x的二次方程,y组成了方程的系数. 只有Δ>=0,x才有实值. Δ=( ...
- MATLAB绘制函数图
序言 Matlab可以根据用户给出的数据绘制相应的函数图.对于单个2D函数图,需要给出一个行向量x作为函数图上离散点集的横坐标,以及一个与x列数一样的横坐标y作为函数图上点集的纵坐标. 向量x和y的取 ...
- 2017年全国卷3的21题与2018年全国卷3的21题命题背景是同一个函数$y=\frac{2x}{\ln(x+1)}$(再次瞎谈)
2017年四川高考数学(全国卷3)理科21题第1问 已知函数\(f(x)=x-1-a\ln x\) (1)若\(f(x)\geqslant 0\),求\(a\)的值\(.\) 该不等式等价于$a\ln ...
- 学习windows编程 day3 之窗口绘画二:边框绘制函数
#include <windows.h> LRESULT CALLBACK WndProc(HWND hwnd, UINT message, WPARAM wParam, LPARAM l ...
- python之绘制函数pyplot初探
我们想将我们手里的数据通过图形的方式展示出来,这样我们更直观的,更可以发现数据带给我们的信息.今天给大家介绍要给python中pyplot绘制函数.一般我们想将手里的数据绘制成图形,分为四大步:1.准 ...
- 使用神经网络来拟合函数y = x^3 +b
我们使用一个三层的小网络来,模拟函数y = x^3+b函数 import tensorflow as tf import numpy as np import matplotlib.pyplot as ...
- 函数 y=x^x的分析
关于函数 y=xx的分析: 由图像得,y在负无穷大到0图像处处不连续,故y的定义域为(0,正无穷大): 故该函数不就是y=e^(lnxx)吗? 1.定义域:我们变形一下,y=e^(xlnx),显然是0 ...
- 2、函数y=f(x)
/* Note:Your choice is C IDE */ #include "stdio.h" /* 3.函数y=f(x)可表示为: */ void main() { int ...
随机推荐
- win7家庭版如何获得管理员权限?
1.首先,打开你的命令提示符,输入cmd.有一点非常重要,如图所示,我们必须“以管理员的方式打开”.只有以管理员身份打开,那么接下来要敲打的命令才会成功. 2. 打开命令提示符后,在输入框输入net ...
- json_decode转码无效
由于最近从原来常用的utf-8的字符转到了gbk:所以,在用json_decode的时候遇到了返回为空: 经查找发现是json_decode和json_encode只针对utf8字符串有效: 于是用到 ...
- 最全python面试题
Python语言特性 1 Python的函数参数传递 看两个例子: a = 1 def fun(a): a = 2 fun(a) print a # 1 a = [] def fun(a): a.ap ...
- HDU 6119 2017百度之星初赛B 小小粉丝度度熊 (二分)
小小粉丝度度熊 Time Limit: 2000/1000 MS (Java/Others) Memory Limit: 32768/32768 K (Java/Others)Total Sub ...
- (转) HA的几种方案
数据库HA 一般把数据库层面的HA,和应用层面HA分开考虑 数据库一般采用数据库产品提供的HA方案,比如Oracle的RAC,mysql的集群,mongodb的replica set等 无HA的运 ...
- 苹果Itools
韩梦飞沙 韩亚飞 313134555@qq.com yue31313 han_meng_fei_sha
- 【BZOJ 3993】【SDOI 2015】序列统计
http://www.lydsy.com/JudgeOnline/problem.php?id=3992 这道题好难啊. 第一眼谁都能看出来是个dp,设\(f(i,j)\)表示转移到第i位时前i位的乘 ...
- xcoj 1103 插线板(树链刨分求最大子段和)
1103: 插线板 时间限制: 1 Sec 内存限制: 128 MB提交: 14 解决: 7 标签提交统计讨论版EditTestData 题目描述 从前有一堆古老的插线板,任意两个插线板之间只有一 ...
- 【计算几何】【凸包】Gym - 101164H - Pub crawl
平面上n个点,点之间沿直线走,规划一条路线,每次只能往左半平面的点走,走过最多的点. 显然所有的点都能走过. n^2的暴力显然是每次找左边与其所形成夹角最小的点,但这样过不了(卡常数?). 或者每轮不 ...
- 【插头dp】CDOJ1690 这是一道比CCCC简单题难的简单题
最裸的插头dp,可参见大白书. #include<cstdio> #include<cstring> using namespace std; #define MOD 1000 ...