
《DSP using MATLAB》示例Example5.8

代码:
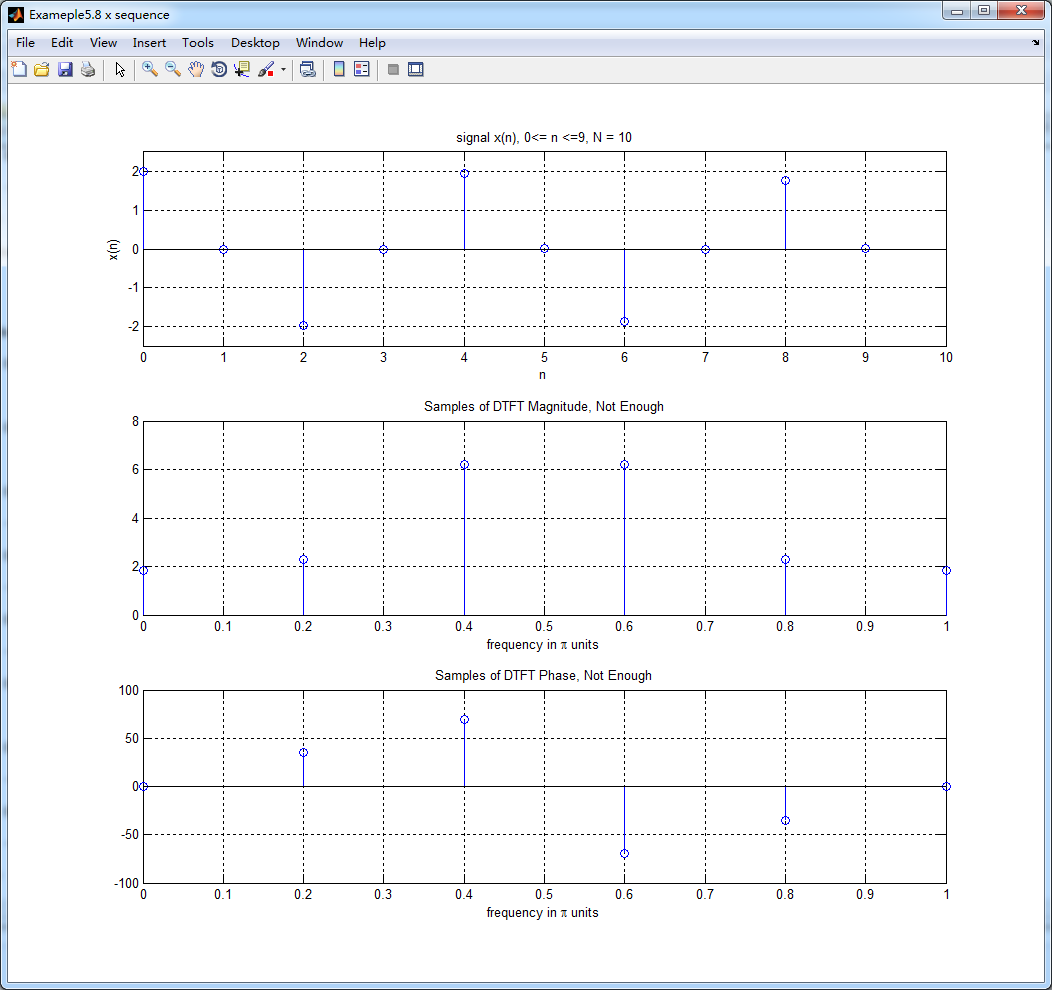
n = [0:1:99]; x = cos(0.48*pi*n) + cos(0.52*pi*n);

n1 = [0:1:9]; y1 = x(1:1:10);                          % N = 10

figure('NumberTitle', 'off', 'Name', 'Exameple5.8 x sequence')

set(gcf,'Color','white');

subplot(3,1,1); stem(n1,y1); title('signal x(n), 0<= n <=9, N = 10'); axis([0,10,-2.5,2.5]);

xlabel('n'); ylabel('x(n)'); grid on;

Y1_DFT = dft(y1,10);                                   % DFT of y1

magY1_DFT = abs(Y1_DFT(1:1:6));

%magY1_DFT = abs(Y1_DFT);

%phaY1_DFT = angle(Y1_DFT)*180/pi                        % degrees

phaY1_DFT = angle(Y1_DFT(1:1:6))*180/pi                  % degrees

%realX_DFT = real(X_DFT); imagX_DFT = imag(X_DFT);

%angX_DFT = angle(X_DFT);                               % radias

k1 = 0:1:5; w1 = 2*pi/10*k1;                            % [0,2pi] axis divided into 501 points.

%k = 0:500; w = (pi/500)*k;                             % [0,pi] axis divided into 501 points.

%X_DTFT = x * (exp(-j*pi/500)) .^ (n'*k);               % DTFT of x(n)

%magX_DTFT = abs(X_DTFT); angX_DTFT = angle(X_DTFT); realX_DTFT = real(X_DTFT); imagX_DTFT = imag(X_DTFT);

subplot(3,1,2); stem(w1/pi,magY1_DFT); title('Samples of DTFT Magnitude, Not Enough'); %axis([0,N,-0.5,1.5]);

xlabel('frequency in \pi units');

%ylabel('x(n)');

grid on;

subplot(3,1,3); stem(w1/pi,phaY1_DFT); title('Samples of DTFT Phase, Not Enough'); %axis([0,N,-0.5,1.5]);

xlabel('frequency in \pi units');

%ylabel('x(n)');

grid on;

%% ------------------------------------------------------

%%         zero-padding coperation,  Append  90 zeros

%%           To obtain a dense spectrum

%% ------------------------------------------------------

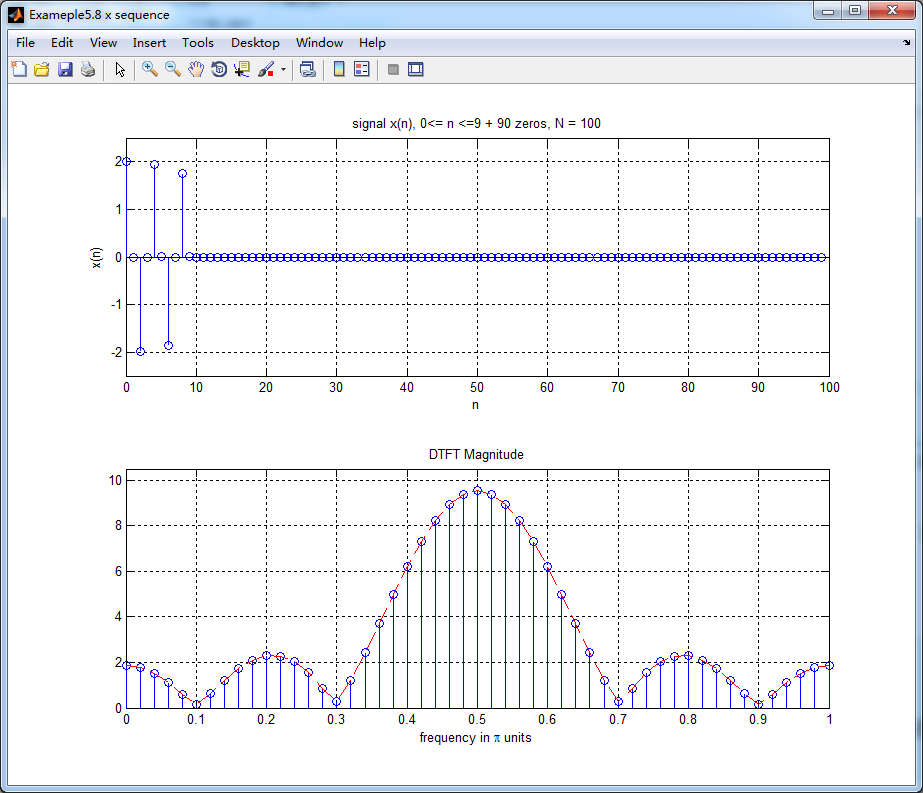
n2 = [0:1:99]; y2 = [x(1:1:10) zeros(1,90)];           % zero-padding, N = 100

figure('NumberTitle', 'off', 'Name', 'Exameple5.8 x sequence')

set(gcf,'Color','white');

subplot(2,1,1); stem(n2,y2); title('signal x(n), 0<= n <=9 + 90 zeros, N = 100'); axis([0,100,-2.5,2.5]);

xlabel('n'); ylabel('x(n)'); grid on;

Y2_DFT = dft(y2,100);                                   % DFT of y2

magY2_DFT = abs(Y2_DFT(1:1:51));

phaY2_DFT = angle(Y2_DFT)*180/pi                        % degrees

k2 = 0:1:50; w2 = (2*pi/100)*k2;                        % [0,2pi] axis divided into 501 points.

subplot(2,1,2); stem(w2/pi,magY2_DFT); hold on; plot(w2/pi,magY2_DFT,'--r');

title('DTFT Magnitude'); axis([0,1,0,10.5]); hold off;

xlabel('frequency in \pi units');

%ylabel('x(n)');

grid on;

%% -----------------------------------------------------------

%%          Exameple5.8b   take first 100 samples of x(n)

%%         determine the DTFT

%% -----------------------------------------------------------

figure('NumberTitle', 'off', 'Name', 'Exameple5.8b ')

set(gcf,'Color','white');

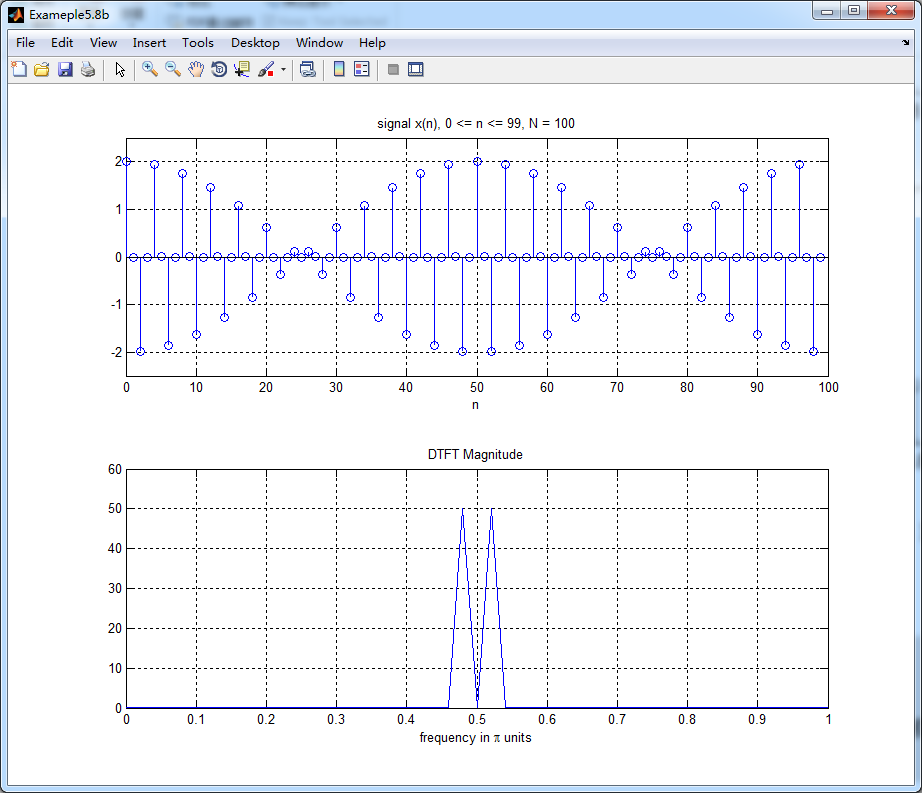
subplot(2,1,1); stem(n,x); axis([0,100,-2.5,2.5]);

title('signal x(n), 0 <= n <= 99, N = 100'); xlabel('n'); grid on;

X = dft(x,100); magX = abs(X(1:1:51));

k = 0:1:50; w = 2*pi/100*k;

subplot(2,1,2); plot(w/pi, magX); title('DTFT Magnitude');

xlabel('frequency in \pi units'); axis([0,1,0,60]); grid on;

%% -----------------------------------------------------------

%%          END  Exameple5.8b

%% -----------------------------------------------------------
结果:
《DSP using MATLAB》示例Example5.8的更多相关文章
- DSP using MATLAB 示例Example3.21
代码: % Discrete-time Signal x1(n) % Ts = 0.0002; n = -25:1:25; nTs = n*Ts; Fs = 1/Ts; x = exp(-1000*a ...
- DSP using MATLAB 示例 Example3.19
代码: % Analog Signal Dt = 0.00005; t = -0.005:Dt:0.005; xa = exp(-1000*abs(t)); % Discrete-time Signa ...
- DSP using MATLAB示例Example3.18
代码: % Analog Signal Dt = 0.00005; t = -0.005:Dt:0.005; xa = exp(-1000*abs(t)); % Continuous-time Fou ...
- DSP using MATLAB 示例Example3.23
代码: % Discrete-time Signal x1(n) : Ts = 0.0002 Ts = 0.0002; n = -25:1:25; nTs = n*Ts; x1 = exp(-1000 ...
- DSP using MATLAB 示例Example3.22
代码: % Discrete-time Signal x2(n) Ts = 0.001; n = -5:1:5; nTs = n*Ts; Fs = 1/Ts; x = exp(-1000*abs(nT ...
- DSP using MATLAB 示例Example3.17
- DSP using MATLAB示例Example3.16
代码: b = [0.0181, 0.0543, 0.0543, 0.0181]; % filter coefficient array b a = [1.0000, -1.7600, 1.1829, ...
- DSP using MATLAB 示例 Example3.15
上代码: subplot(1,1,1); b = 1; a = [1, -0.8]; n = [0:100]; x = cos(0.05*pi*n); y = filter(b,a,x); figur ...
- DSP using MATLAB 示例 Example3.13
上代码: w = [0:1:500]*pi/500; % freqency between 0 and +pi, [0,pi] axis divided into 501 points. H = ex ...
- DSP using MATLAB 示例 Example3.12
用到的性质 代码: n = -5:10; x = sin(pi*n/2); k = -100:100; w = (pi/100)*k; % freqency between -pi and +pi , ...
随机推荐
- ADMM与one-pass multi-view learning
现在终于开始看论文了,机器学习基础部分的更新可能以后会慢一点了,当然还是那句话宁愿慢点,也做自己原创的,自己思考的东西.现在开辟一个新的模块----多视图学习相关论文笔记,就是分享大牛的paper,然 ...
- jQuery插件之Cookie插件使用方法~
一.介绍 1-1.jQuery.Cookie.js插件是一个轻量级的Cookie管理插件.下载地址:jQuery-cookie.js 有需要的朋友,右键另存为即可! 二.使用方法 2-1.引入jQu ...
- Web jquery表格组件 JQGrid 的使用 - 8.Pager、新增数据、查询、刷新、查看数据
系列索引 Web jquery表格组件 JQGrid 的使用 - 从入门到精通 开篇及索引 Web jquery表格组件 JQGrid 的使用 - 4.JQGrid参数.ColModel API.事件 ...
- Class PLBuildVersion is implemented in both /Applications/Xcode.app/Contents/Developer/Platforms/iPhoneSimulator.platform/Developer/SDKs/iPhoneSimulator.sdk/System/Library/PrivateFrameworks/AssetsLibr
网上找了一大堆,没有解决的办法 ,主要是iOS10的适配问题,info.plist里没有加对. 访问相册,我只加了 <!-- 相册 --> <key>NSPhotoLibrar ...
- FindWindowEx用法
函数原型:HWND FindWindowEx(HWND hwndParent,HWND hwndChildAfter,LPCTSTR lpszClass,LPCTSTR lpszWindow): 参数 ...
- jquery numberbox赋值
numberbox不能使用$('#id').val( '');只能使用$('#id').numberbox('setValue','');
- Swift3.0P1 语法指南——控制流
原档:https://developer.apple.com/library/prerelease/ios/documentation/Swift/Conceptual/Swift_Programmi ...
- 第七届山东省ACM省赛
激动人心的省赛终于结束了…平静下来再回头看真的感觉一波三折…先是赛前毫无预兆的查出突发性耳聋…伴随而来的就是左耳听力下降.轻微耳鸣.极个别情况下的头晕…不过这都还好,毕竟药物可以恢复…热身赛只过了一道 ...
- JavaScript 加载动画Canvas 设计
var c = document.getElementById('c'), ctx = c.getContext('2d'), cw = c.width = 400, ch = c.height = ...
- js 获取元素宽高
可以用源生js的.offsetHeight .offsetWidth属性 document.getElementById("temp_form").offsetHeight // ...