
Skywalking-04:扩展Metric监控信息
扩展 Metric 监控信息
官方文档
Source and Scope extension for new metrics
案例:JVM Thread 增加 Metrics
修改 Thread 的定义
在 apm-protocol/apm-network/src/main/proto/language-agent/JVMMetric.proto 协议文件中覆盖 message Thread 的定义
message Thread {

  int64 liveCount = 1;

  int64 daemonCount = 2;

  int64 peakCount = 3;

  int64 deadlocked = 4;

  int64 monitorDeadlocked = 5;

  int64 newThreadCount = 7;

  int64 runnableThreadCount = 8;

  int64 blockedThreadCount = 9;

  int64 waitThreadCount = 10;

  int64 timeWaitThreadCount = 11;

  int64 terminatedThreadCount = 12;

}
重新构建 apm-network 项目
cd apm-protocol/apm-network

mvn clean package -DskipTests=true
PS:可以安装 Protocol Buffer Editor 插件,支持 Protocol Buffer 语法
修改 agent core 中 Thread Metrics 的提供类
直接使用如下代码覆盖 org.apache.skywalking.apm.agent.core.jvm.thread.ThreadProvider 类
/*

 * Licensed to the Apache Software Foundation (ASF) under one or more

 * contributor license agreements.  See the NOTICE file distributed with

 * this work for additional information regarding copyright ownership.

 * The ASF licenses this file to You under the Apache License, Version 2.0

 * (the "License"); you may not use this file except in compliance with

 * the License.  You may obtain a copy of the License at

 *

 *     http://www.apache.org/licenses/LICENSE-2.0

 *

 * Unless required by applicable law or agreed to in writing, software

 * distributed under the License is distributed on an "AS IS" BASIS,

 * WITHOUT WARRANTIES OR CONDITIONS OF ANY KIND, either express or implied.

 * See the License for the specific language governing permissions and

 * limitations under the License.

 *

 */

package org.apache.skywalking.apm.agent.core.jvm.thread;

import java.lang.management.ManagementFactory;

import java.lang.management.ThreadInfo;

import java.lang.management.ThreadMXBean;

import java.util.Optional;

import org.apache.skywalking.apm.network.language.agent.v3.Thread;

public enum ThreadProvider {

    INSTANCE;

    private final ThreadMXBean threadMXBean;

    private static final long [] EMPTY_DEADLOCKED_THREADS = new long[0];

    ThreadProvider() {

        this.threadMXBean = ManagementFactory.getThreadMXBean();

    }

    public Thread getThreadMetrics() {

        int newThreadCount = 0;

        int runnableThreadCount = 0;

        int blockedThreadCount = 0;

        int waitThreadCount = 0;

        int timeWaitThreadCount = 0;

        int terminatedThreadCount = 0;

        // 基于线程状态信息增加对应状态的线程数

        ThreadInfo[] threadInfos = threadMXBean.getThreadInfo(threadMXBean.getAllThreadIds());

        if (threadInfos != null) {

            for (ThreadInfo threadInfo : threadInfos) {

                if (threadInfo != null) {

                    switch (threadInfo.getThreadState()) {

                        case NEW:

                            newThreadCount++;

                            break;

                        case RUNNABLE:

                            runnableThreadCount++;

                            break;

                        case BLOCKED:

                            blockedThreadCount++;

                            break;

                        case WAITING:

                            waitThreadCount++;

                            break;

                        case TIMED_WAITING:

                            timeWaitThreadCount++;

                            break;

                        case TERMINATED:

                            terminatedThreadCount++;

                            break;

                        default:

                            break;

                    }

                } else {

                    /*

                     * If a thread of a given ID is not alive or does not exist,

                     * the corresponding element in the returned array will,

                     * contain null,because is mut exist ,so the thread is terminated

                     */

                    terminatedThreadCount++;

                }

            }

        }

        // 当前存活线程数

        int threadCount = threadMXBean.getThreadCount();

        // deamon线程数

        int daemonThreadCount = threadMXBean.getDaemonThreadCount();

        // 峰值线程数

        int peakThreadCount = threadMXBean.getPeakThreadCount();

        int deadlocked = Optional.ofNullable(threadMXBean.findDeadlockedThreads())

                .orElse(EMPTY_DEADLOCKED_THREADS).length;

        int monitorDeadlocked = Optional.ofNullable(threadMXBean.findMonitorDeadlockedThreads())

                .orElse(EMPTY_DEADLOCKED_THREADS).length;

        // 构建一个Thread对象,用于发送Thread Metric信息至OAP

        return Thread.newBuilder().setLiveCount(threadCount)

                .setDaemonCount(daemonThreadCount)

                .setPeakCount(peakThreadCount)

                .setDeadlocked(deadlocked)

                .setMonitorDeadlocked(monitorDeadlocked)

                .setNewThreadCount(newThreadCount)

                .setRunnableThreadCount(runnableThreadCount)

                .setBlockedThreadCount(blockedThreadCount)

                .setWaitThreadCount(waitThreadCount)

                .setTimeWaitThreadCount(timeWaitThreadCount)

                .setTerminatedThreadCount(terminatedThreadCount)

                .build();

    }

}
修改 ServiceInstanceJVMThread
直接使用如下代码覆盖 org.apache.skywalking.oap.server.core.source.ServiceInstanceJVMThread 类,
ServiceInstanceJVMThread继承了 Source 抽象类, Source 类是 Skywalking 中 oal 体系,资源及范围的定义。
/*

 * Licensed to the Apache Software Foundation (ASF) under one or more

 * contributor license agreements.  See the NOTICE file distributed with

 * this work for additional information regarding copyright ownership.

 * The ASF licenses this file to You under the Apache License, Version 2.0

 * (the "License"); you may not use this file except in compliance with

 * the License.  You may obtain a copy of the License at

 *

 *     http://www.apache.org/licenses/LICENSE-2.0

 *

 * Unless required by applicable law or agreed to in writing, software

 * distributed under the License is distributed on an "AS IS" BASIS,

 * WITHOUT WARRANTIES OR CONDITIONS OF ANY KIND, either express or implied.

 * See the License for the specific language governing permissions and

 * limitations under the License.

 *

 */

package org.apache.skywalking.oap.server.core.source;

import lombok.Getter;

import lombok.Setter;

import static org.apache.skywalking.oap.server.core.source.DefaultScopeDefine.SERVICE_INSTANCE_CATALOG_NAME;

import static org.apache.skywalking.oap.server.core.source.DefaultScopeDefine.SERVICE_INSTANCE_JVM_THREAD;

@ScopeDeclaration(id = SERVICE_INSTANCE_JVM_THREAD, name = "ServiceInstanceJVMThread", catalog = SERVICE_INSTANCE_CATALOG_NAME)

@ScopeDefaultColumn.VirtualColumnDefinition(fieldName = "entityId", columnName = "entity_id", isID = true, type = String.class)

public class ServiceInstanceJVMThread extends Source {

    @Override

    public int scope() {

        return SERVICE_INSTANCE_JVM_THREAD;

    }

    @Override

    public String getEntityId() {

        return String.valueOf(id);

    }

    @Getter

    @Setter

    private String id;

    @Getter

    @Setter

    @ScopeDefaultColumn.DefinedByField(columnName = "name", requireDynamicActive = true)

    private String name;

    @Getter

    @Setter

    @ScopeDefaultColumn.DefinedByField(columnName = "service_name", requireDynamicActive = true)

    private String serviceName;

    @Getter

    @Setter

    @ScopeDefaultColumn.DefinedByField(columnName = "service_id")

    private String serviceId;

    @Getter

    @Setter

    private long liveCount;

    @Getter

    @Setter

    private long daemonCount;

    @Getter

    @Setter

    private long peakCount;

    @Getter

    @Setter

    private long deadlocked;

    @Getter

    @Setter

    private long monitorDeadlocked;

    @Getter

    @Setter

    private long newThreadCount;

    @Getter

    @Setter

    private long runnableThreadCount;

    @Getter

    @Setter

    private long blockedThreadCount;

    @Getter

    @Setter

    private long waitThreadCount;

    @Getter

    @Setter

    private long timeWaitThreadCount;

    @Getter

    @Setter

    private long terminatedThreadCount;

}
修改 JVMSourceDispatcher
org.apache.skywalking.oap.server.analyzer.provider.jvm.JVMSourceDispatcher 是一个 Source 分发类,将从 agent 接收到的 JVM 相关 Metrics 拆分成对应的 Source 。例如: ServiceInstanceJVMMemory 、 ServiceInstanceJVMThread 。
修改方法org.apache.skywalking.oap.server.analyzer.provider.jvm.JVMSourceDispatcher#sendToThreadMetricProcess 为如下代码:
    private void sendToThreadMetricProcess(String service,

            String serviceId,

            String serviceInstance,

            String serviceInstanceId,

            long timeBucket,

            Thread thread) {

        ServiceInstanceJVMThread serviceInstanceJVMThread = new ServiceInstanceJVMThread();

        serviceInstanceJVMThread.setId(serviceInstanceId);

        serviceInstanceJVMThread.setName(serviceInstance);

        serviceInstanceJVMThread.setServiceId(serviceId);

        serviceInstanceJVMThread.setServiceName(service);

        serviceInstanceJVMThread.setLiveCount(thread.getLiveCount());

        serviceInstanceJVMThread.setDaemonCount(thread.getDaemonCount());

        serviceInstanceJVMThread.setPeakCount(thread.getPeakCount());

        serviceInstanceJVMThread.setTimeBucket(timeBucket);

        serviceInstanceJVMThread.setDeadlocked(thread.getDeadlocked());

        serviceInstanceJVMThread.setMonitorDeadlocked(thread.getMonitorDeadlocked());

        serviceInstanceJVMThread.setNewThreadCount(thread.getNewThreadCount());

        serviceInstanceJVMThread.setRunnableThreadCount(thread.getRunnableThreadCount());

        serviceInstanceJVMThread.setBlockedThreadCount(thread.getBlockedThreadCount());

        serviceInstanceJVMThread.setWaitThreadCount(thread.getWaitThreadCount());

        serviceInstanceJVMThread.setTimeWaitThreadCount(thread.getTimeWaitThreadCount());

        serviceInstanceJVMThread.setTerminatedThreadCount(thread.getTerminatedThreadCount());

        sourceReceiver.receive(serviceInstanceJVMThread);

    }
在 java-agent.oal 增加相关指标
在oap-server/server-bootstrap/src/main/resources/oal/java-agent.oal 添加如下语句
// 参考oal语法

instance_jvm_thread_deadlocked = from(ServiceInstanceJVMThread.deadlocked).longAvg();

instance_jvm_thread_monitor_deadlocked = from(ServiceInstanceJVMThread.monitorDeadlocked).longAvg();

instance_jvm_thread_new_thread_count = from(ServiceInstanceJVMThread.newThreadCount).longAvg();

instance_jvm_thread_runnable_thread_count = from(ServiceInstanceJVMThread.runnableThreadCount).longAvg();

instance_jvm_thread_blocked_thread_count = from(ServiceInstanceJVMThread.blockedThreadCount).longAvg();

instance_jvm_thread_wait_thread_count = from(ServiceInstanceJVMThread.waitThreadCount).longAvg();

instance_jvm_thread_time_wait_thread_count = from(ServiceInstanceJVMThread.timeWaitThreadCount).longAvg();

instance_jvm_thread_terminated_thread_count = from(ServiceInstanceJVMThread.terminatedThreadCount).longAvg();
修改 apm.yml
在 oap-server/server-bootstrap/src/main/resources/ui-initialized-templates/apm.yml 文件的 APM 面板下的 Instance 项增加如下配置
{

  "width": 3,

  "title": "JVM Thread Count (Java Service)",

  "height": "250",

  "entityType": "ServiceInstance",

  "independentSelector": false,

  "metricType": "REGULAR_VALUE",

  "queryMetricType": "readMetricsValues",

  "chartType": "ChartLine",

  "metricName": "instance_jvm_thread_live_count, instance_jvm_thread_daemon_count, instance_jvm_thread_peak_count,instance_jvm_thread_deadlocked,instance_jvm_thread_monitor_deadlocked"

},

{

  "width": 3,

  "title": "JVM Thread State Count (Java Service)",

  "height": "250",

  "entityType": "ServiceInstance",

  "independentSelector": false,

  "metricType": "REGULAR_VALUE",

  "metricName": "instance_jvm_thread_new_thread_count,instance_jvm_thread_runnable_thread_count,instance_jvm_thread_blocked_thread_count,instance_jvm_thread_wait_thread_count,instance_jvm_thread_time_wait_thread_count,instance_jvm_thread_terminated_thread_count",

  "queryMetricType": "readMetricsValues",

  "chartType": "ChartBar"

}
如果不清楚添加位置,可以直接使用如下配置,覆盖 oap-server/server-bootstrap/src/main/resources/ui-initialized-templates/apm.yml
# Licensed to the Apache Software Foundation (ASF) under one or more
# contributor license agreements. See the NOTICE file distributed with
# this work for additional information regarding copyright ownership.
# The ASF licenses this file to You under the Apache License, Version 2.0
# (the "License"); you may not use this file except in compliance with
# the License. You may obtain a copy of the License at
#
# http://www.apache.org/licenses/LICENSE-2.0
#
# Unless required by applicable law or agreed to in writing, software
# distributed under the License is distributed on an "AS IS" BASIS,
# WITHOUT WARRANTIES OR CONDITIONS OF ANY KIND, either express or implied.
# See the License for the specific language governing permissions and
# limitations under the License.
# UI templates initialized file includes the default template when the SkyWalking OAP starts up at the first time.
#
# Also, SkyWalking would detect the existing templates in the database, once they are missing, all templates in this file
# could be added automatically.
templates:
- name: "APM"
# The type includes DASHBOARD, TOPOLOGY_INSTANCE, TOPOLOGY_ENDPOINT.
# DASHBOARD type templates could have multiple definitions, by using different names.
# TOPOLOGY_INSTANCE, TOPOLOGY_ENDPOINT type templates should be defined once, as they are used in the topology page only.
type: "DASHBOARD"
# Configuration could be defined through UI, and use `export` to format in the standard JSON.
configuration: |-
[
{
"name": "APM",
"type": "service",
"children": [
{
"name": "Global",
"children": [
{
"width": 3,
"title": "Services Load",
"height": "300",
"entityType": "Service",
"independentSelector": false,
"metricType": "REGULAR_VALUE",
"metricName": "service_cpm",
"queryMetricType": "sortMetrics",
"chartType": "ChartSlow",
"parentService": false,
"unit": "CPM - calls per minute"
},
{
"width": 3,
"title": "Slow Services",
"height": "300",
"entityType": "Service",
"independentSelector": false,
"metricType": "REGULAR_VALUE",
"metricName": "service_resp_time",
"queryMetricType": "sortMetrics",
"chartType": "ChartSlow",
"parentService": false,
"unit": "ms"
},
{
"width": 3,
"title": "Un-Health Services (Apdex)",
"height": "300",
"entityType": "Service",
"independentSelector": false,
"metricType": "REGULAR_VALUE",
"metricName": "service_apdex",
"queryMetricType": "sortMetrics",
"chartType": "ChartSlow",
"parentService": false,
"aggregation": "/",
"aggregationNum": "10000",
"sortOrder": "ASC"
},
{
"width": 3,
"title": "Slow Endpoints",
"height": "300",
"entityType": "Endpoint",
"independentSelector": false,
"metricType": "REGULAR_VALUE",
"metricName": "endpoint_avg",
"queryMetricType": "sortMetrics",
"chartType": "ChartSlow",
"parentService": false,
"unit": "ms"
},
{
"width": "6",
"title": "Global Response Latency",
"height": "280",
"entityType": "All",
"independentSelector": false,
"metricType": "LABELED_VALUE",
"metricName": "all_percentile",
"queryMetricType": "readLabeledMetricsValues",
"chartType": "ChartLine",
"metricLabels": "P50, P75, P90, P95, P99",
"labelsIndex": "0, 1, 2, 3, 4",
"unit": "percentile in ms"
},
{
"width": "6",
"title": "Global Heatmap",
"height": "280",
"entityType": "All",
"independentSelector": false,
"metricType": "HEATMAP",
"unit": "ms",
"queryMetricType": "readHeatMap",
"chartType": "ChartHeatmap",
"metricName": "all_heatmap"
}
]
},
{
"name": "Service",
"children": [
{
"width": 3,
"title": "Service Apdex",
"height": "200",
"entityType": "Service",
"independentSelector": false,
"metricType": "REGULAR_VALUE",
"metricName": "service_apdex",
"queryMetricType": "readMetricsValue",
"chartType": "ChartNum",
"aggregation": "/",
"aggregationNum": "10000"
},
{
"width": 3,
"title": "Service Avg Response Time",
"height": "200",
"entityType": "Service",
"independentSelector": false,
"metricType": "REGULAR_VALUE",
"metricName": "service_resp_time",
"queryMetricType": "readMetricsValues",
"chartType": "ChartLine",
"unit": "ms"
},
{
"width": 3,
"title": "Successful Rate",
"height": "200",
"entityType": "Service",
"independentSelector": false,
"metricType": "REGULAR_VALUE",
"metricName": "service_sla",
"queryMetricType": "readMetricsValue",
"chartType": "ChartNum",
"unit": "%",
"aggregation": "/",
"aggregationNum": "100"
},
{
"width": 3,
"title": "Service Load",
"height": "200",
"entityType": "Service",
"independentSelector": false,
"metricType": "REGULAR_VALUE",
"metricName": "service_cpm",
"queryMetricType": "readMetricsValue",
"chartType": "ChartNum",
"unit": "CPM - calls per minute"
},
{
"width": 3,
"title": "Service Apdex",
"height": "200",
"entityType": "Service",
"independentSelector": false,
"metricType": "REGULAR_VALUE",
"metricName": "service_apdex",
"queryMetricType": "readMetricsValues",
"chartType": "ChartLine",
"aggregation": "/",
"aggregationNum": "10000"
},
{
"width": 3,
"title": "Service Response Time Percentile",
"height": "200",
"entityType": "Service",
"independentSelector": false,
"metricType": "LABELED_VALUE",
"metricName": "service_percentile",
"queryMetricType": "readLabeledMetricsValues",
"chartType": "ChartLine",
"unit": "ms",
"metricLabels": "P50, P75, P90, P95, P99",
"labelsIndex": "0, 1, 2, 3, 4"
},
{
"width": 3,
"title": "Successful Rate",
"height": "200",
"entityType": "Service",
"independentSelector": false,
"metricType": "REGULAR_VALUE",
"metricName": "service_sla",
"queryMetricType": "readMetricsValues",
"chartType": "ChartLine",
"unit": "%",
"aggregation": "/",
"aggregationNum": "100"
},
{
"width": 3,
"title": "Service Load",
"height": "200",
"entityType": "Service",
"independentSelector": false,
"metricType": "REGULAR_VALUE",
"metricName": "service_cpm",
"queryMetricType": "readMetricsValues",
"chartType": "ChartLine",
"unit": "CPM - calls per minute"
},
{
"width": "4",
"title": "Service Instances Load",
"height": "280",
"entityType": "ServiceInstance",
"independentSelector": false,
"metricType": "REGULAR_VALUE",
"metricName": "service_instance_cpm",
"queryMetricType": "sortMetrics",
"chartType": "ChartSlow",
"parentService": true,
"unit": "CPM - calls per minute"
},
{
"width": "4",
"title": "Slow Service Instance",
"height": "280",
"entityType": "ServiceInstance",
"independentSelector": false,
"metricType": "REGULAR_VALUE",
"metricName": "service_instance_resp_time",
"queryMetricType": "sortMetrics",
"chartType": "ChartSlow",
"parentService": true,
"unit": "ms"
},
{
"width": "4",
"title": "Service Instance Successful Rate",
"height": "280",
"entityType": "ServiceInstance",
"independentSelector": false,
"metricType": "REGULAR_VALUE",
"metricName": "service_instance_sla",
"queryMetricType": "sortMetrics",
"chartType": "ChartSlow",
"parentService": true,
"unit": "%",
"aggregation": "/",
"aggregationNum": "100",
"sortOrder": "ASC"
}
]
},
{
"name": "Instance",
"children": [
{
"width": "3",
"title": "Service Instance Load",
"height": "250",
"entityType": "ServiceInstance",
"independentSelector": false,
"metricType": "REGULAR_VALUE",
"metricName": "service_instance_cpm",
"queryMetricType": "readMetricsValues",
"chartType": "ChartLine",
"unit": "CPM - calls per minute"
},
{
"width": 3,
"title": "Service Instance Throughput",
"height": "250",
"entityType": "ServiceInstance",
"independentSelector": false,
"metricType": "REGULAR_VALUE",
"metricName": "service_instance_throughput_received,service_instance_throughput_sent",
"queryMetricType": "readMetricsValues",
"chartType": "ChartLine",
"unit": "Bytes"
},
{
"width": "3",
"title": "Service Instance Successful Rate",
"height": "250",
"entityType": "ServiceInstance",
"independentSelector": false,
"metricType": "REGULAR_VALUE",
"metricName": "service_instance_sla",
"queryMetricType": "readMetricsValues",
"chartType": "ChartLine",
"unit": "%",
"aggregation": "/",
"aggregationNum": "100"
},
{
"width": "3",
"title": "Service Instance Latency",
"height": "250",
"entityType": "ServiceInstance",
"independentSelector": false,
"metricType": "REGULAR_VALUE",
"metricName": "service_instance_resp_time",
"queryMetricType": "readMetricsValues",
"chartType": "ChartLine",
"unit": "ms"
},
{
"width": 3,
"title": "JVM CPU (Java Service)",
"height": "250",
"entityType": "ServiceInstance",
"independentSelector": false,
"metricType": "REGULAR_VALUE",
"metricName": "instance_jvm_cpu",
"queryMetricType": "readMetricsValues",
"chartType": "ChartLine",
"unit": "%",
"aggregation": "+",
"aggregationNum": ""
},
{
"width": 3,
"title": "JVM Memory (Java Service)",
"height": "250",
"entityType": "ServiceInstance",
"independentSelector": false,
"metricType": "REGULAR_VALUE",
"metricName": "instance_jvm_memory_heap, instance_jvm_memory_heap_max,instance_jvm_memory_noheap, instance_jvm_memory_noheap_max",
"queryMetricType": "readMetricsValues",
"chartType": "ChartLine",
"unit": "MB",
"aggregation": "/",
"aggregationNum": "1048576"
},
{
"width": 3,
"title": "JVM GC Time",
"height": "250",
"entityType": "ServiceInstance",
"independentSelector": false,
"metricType": "REGULAR_VALUE",
"metricName": "instance_jvm_young_gc_time, instance_jvm_old_gc_time",
"queryMetricType": "readMetricsValues",
"chartType": "ChartLine",
"unit": "ms"
},
{
"width": 3,
"title": "JVM GC Count",
"height": "250",
"entityType": "ServiceInstance",
"independentSelector": false,
"metricType": "REGULAR_VALUE",
"queryMetricType": "readMetricsValues",
"chartType": "ChartBar",
"metricName": "instance_jvm_young_gc_count, instance_jvm_old_gc_count"
},
{
"width": 3,
"title": "JVM Thread Count (Java Service)",
"height": "250",
"entityType": "ServiceInstance",
"independentSelector": false,
"metricType": "REGULAR_VALUE",
"queryMetricType": "readMetricsValues",
"chartType": "ChartLine",
"metricName": "instance_jvm_thread_live_count, instance_jvm_thread_daemon_count, instance_jvm_thread_peak_count,instance_jvm_thread_deadlocked,instance_jvm_thread_monitor_deadlocked"
},
{
"width": 3,
"title": "JVM Thread State Count (Java Service)",
"height": "250",
"entityType": "ServiceInstance",
"independentSelector": false,
"metricType": "REGULAR_VALUE",
"metricName": "instance_jvm_thread_new_thread_count,instance_jvm_thread_runnable_thread_count,instance_jvm_thread_blocked_thread_count,instance_jvm_thread_wait_thread_count,instance_jvm_thread_time_wait_thread_count,instance_jvm_thread_terminated_thread_count",
"queryMetricType": "readMetricsValues",
"chartType": "ChartBar"
},
{
"width": 3,
"title": "CLR CPU (.NET Service)",
"height": "250",
"entityType": "ServiceInstance",
"independentSelector": false,
"metricType": "REGULAR_VALUE",
"metricName": "instance_clr_cpu",
"queryMetricType": "readMetricsValues",
"chartType": "ChartLine",
"unit": "%"
},
{
"width": 3,
"title": "CLR GC (.NET Service)",
"height": "250",
"entityType": "ServiceInstance",
"independentSelector": false,
"metricType": "REGULAR_VALUE",
"metricName": "instance_clr_gen0_collect_count, instance_clr_gen1_collect_count, instance_clr_gen2_collect_count",
"queryMetricType": "readMetricsValues",
"chartType": "ChartBar"
},
{
"width": 3,
"title": "CLR Heap Memory (.NET Service)",
"height": "250",
"entityType": "ServiceInstance",
"independentSelector": false,
"metricType": "REGULAR_VALUE",
"metricName": "instance_clr_heap_memory",
"queryMetricType": "readMetricsValues",
"chartType": "ChartLine",
"unit": "MB",
"aggregation": "/",
"aggregationNum": "1048576"
},
{
"width": 3,
"title": "CLR Thread (.NET Service)",
"height": "250",
"entityType": "ServiceInstance",
"independentSelector": false,
"metricType": "REGULAR_VALUE",
"queryMetricType": "readMetricsValues",
"chartType": "ChartLine",
"metricName": "instance_clr_available_completion_port_threads,instance_clr_available_worker_threads,instance_clr_max_completion_port_threads,instance_clr_max_worker_threads"
}
]
},
{
"name": "Endpoint",
"children": [
{
"width": "4",
"title": "Endpoint Load in Current Service",
"height": "280",
"entityType": "Endpoint",
"independentSelector": false,
"metricType": "REGULAR_VALUE",
"metricName": "endpoint_cpm",
"queryMetricType": "sortMetrics",
"chartType": "ChartSlow",
"parentService": true,
"unit": "CPM - calls per minute"
},
{
"width": "4",
"title": "Slow Endpoints in Current Service",
"height": "280",
"entityType": "Endpoint",
"independentSelector": false,
"metricType": "REGULAR_VALUE",
"queryMetricType": "sortMetrics",
"chartType": "ChartSlow",
"metricName": "endpoint_avg",
"unit": "ms",
"parentService": true
},
{
"width": "4",
"title": "Successful Rate in Current Service",
"height": "280",
"entityType": "Endpoint",
"independentSelector": false,
"metricType": "REGULAR_VALUE",
"metricName": "endpoint_sla",
"queryMetricType": "sortMetrics",
"chartType": "ChartSlow",
"aggregation": "/",
"aggregationNum": "100",
"parentService": true,
"unit": "%",
"sortOrder": "ASC"
},
{
"width": 3,
"title": "Endpoint Load",
"height": 350,
"entityType": "Endpoint",
"independentSelector": false,
"metricType": "REGULAR_VALUE",
"metricName": "endpoint_cpm",
"queryMetricType": "readMetricsValues",
"chartType": "ChartLine"
},
{
"width": 3,
"title": "Endpoint Avg Response Time",
"height": 350,
"entityType": "Endpoint",
"independentSelector": false,
"metricType": "REGULAR_VALUE",
"metricName": "endpoint_avg",
"queryMetricType": "readMetricsValues",
"chartType": "ChartLine",
"unit": "ms"
},
{
"width": 3,
"title": "Endpoint Response Time Percentile",
"height": 350,
"entityType": "Endpoint",
"independentSelector": false,
"metricType": "LABELED_VALUE",
"metricName": "endpoint_percentile",
"queryMetricType": "readLabeledMetricsValues",
"chartType": "ChartLine",
"metricLabels": "P50, P75, P90, P95, P99",
"labelsIndex": "0, 1, 2, 3, 4",
"unit": "ms"
},
{
"width": 3,
"title": "Endpoint Successful Rate",
"height": 350,
"entityType": "Endpoint",
"independentSelector": false,
"metricType": "REGULAR_VALUE",
"metricName": "endpoint_sla",
"queryMetricType": "readMetricsValues",
"chartType": "ChartLine",
"unit": "%",
"aggregation": "/",
"aggregationNum": "100"
}
]
}
]
}
]
# Activated as the DASHBOARD type, makes this templates added into the UI page automatically.
# False means providing a basic template, user needs to add it manually.
activated: true
# True means wouldn't show up on the dashboard. Only keeps the definition in the storage.
disabled: false
效果展示
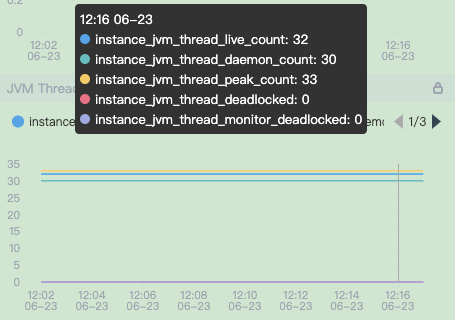
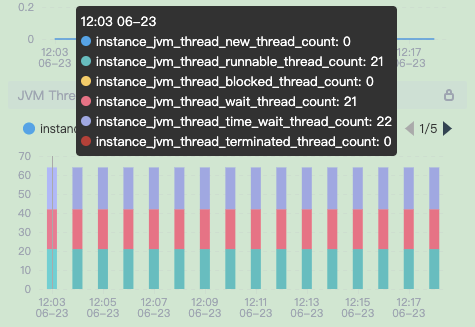
代码贡献
- Add some new thread metric and class metric to JVMMetric #7230
- add some new thread metric and class metric to JVMMetric #52
- Remove Terminated State and New State in JVMMetric (#7230) #53
- Add some new thread metric and class metric to JVMMetric (#7230) #7243
总结
Metric 如何扩展,网上基本上没案例,都是看官方文档和源码了解。对应这种非常热门的开源项目,还是看官方文档和源码更稳。
参考文档
- Java ManagementFactory解析
- 编程中使用ThreadMXBean类来检测死锁
- Source and Scope extension for new metrics
- Observability Analysis Language
分享并记录所学所见
Skywalking-04:扩展Metric监控信息的更多相关文章
- 04:获取zabbix监控信息
目录:Django其他篇 01: 安装zabbix server 02:zabbix-agent安装配置 及 web界面管理 03: zabbix API接口 对 主机.主机组.模板.应用集.监控项. ...
- Yii创建前台和后台登录表单和通过扩展 CWebUser 增加信息到 Yii::app()->user
我参考了这篇文章来构建项目的前台和后台的目录结构.感谢Andy的这篇文章.按照所有的步骤,您将有单独的前台和后台面板,如: http://localhost/index.php // 前台 http: ...
- Skywalking-05:在Skywalking RocketBot上添加监控图表
在 Skywalking RocketBot 上添加监控图表 效果图 该图的一些配置信息如下: 标题为: JVM Thread State Count (Java Service) 指标为: read ...
- Oracle扩展的统计信息
我们在收集列的统计信息与直方图时,往往都是对某一列的收集.当谓词使用多个相关列时,会导致约束条件的冗余.这几个相关的列也被称作关联列.出现这种情况时,查询优化器也会做出不准确的判断.所以我们必须对这些 ...
- 为Druid监控配置访问权限(配置访问监控信息的用户与密码)
转: l 为Druid监控配置访问权限(配置访问监控信息的用户与密码) 2014-09-26 09:21:48 来源:renfufei的专栏 收藏 我要投稿 Druid是一 ...
- java spring boot 开启监控信息
效果: 配置 // pom <dependency> <groupId>org.springframework.boot</groupId> <artifac ...
- .Net Core 商城微服务项目系列(十):使用SkyWalking构建调用链监控(2019-02-13 13:25)
SkyWalking的安装和简单使用已经在前面一篇介绍过了,本篇我们将在商城中添加SkyWalking构建调用链监控. 顺带一下怎么把ES设置为Windows服务,cd到ES的bin文件夹,运行ela ...
- Zabbix4.0如何添加监控信息
二.添加监控信息 监控Windows主机: 首先需要在Windows主机上安装好Zabbix agent,安装方法,见另一篇博客,https://www.cnblogs.com/opsprobe/p/ ...
- Python3对接华三CAS平台Api获取虚拟机监控信息-渐入佳境
--时间:2021年2月3日 --作者:飞翔的小胖猪 说明 使用python对接华三CAS虚拟化平台,通过厂商提供的api接口获取每个集群下所有虚拟机的监控信息,并保存数据在本地的mariadb数据库 ...
随机推荐
- 基于TensorFlow的服装分类
1.导包 #导入TensorFlow和tf.keras import tensorflow as tf from tensorflow import keras # Helper libraries ...
- xshell连接时报错:Could not connect to '192.168.2.125' (port 22): Connection failed.
解决思路: 1.首先用主机ping下虚拟机IP,看是否能ping通 2.如果ping不通就看虚拟机防火墙是否开启,service iptables status [root@mysql ~]# ser ...
- Linux命令(磁盘的卸载与挂载)
一.光盘挂载与卸载: 1.将光盘CD-ROM(hdc)安装到文件系统的/mnt/cdrom目录下的命令是 C . A mount /mnt/cdrom B mount /mnt/cdrom /dev ...
- spring中BeanPostProcessor之四:AutowiredAnnotationBeanPostProcessor(01)
在<spring中BeanPostProcessor之二:CommonAnnotationBeanPostProcessor(01)>中分析了CommonAnnotationBeanPos ...
- 徒手从零实现 uTools 系列(三)- 屏幕取色和截屏
前言 为了进一步提高开发工作效率,最近我们基于 electron 开发了一款媲美 uTools 的开源工具箱 rubick.该工具箱不仅仅开源,最重要的是可以使用 uTools 生态内所有开源插件!这 ...
- external-attacher源码分析(2)-核心处理逻辑分析
kubernetes ceph-csi分析目录导航 基于tag v2.1.1 https://github.com/kubernetes-csi/external-attacher/releases/ ...
- acwing 4 多重背包问题 I
多重背包 有 n种物品 一共有 m大小的背包,每种物品的价值 大小 个数 为 s[i],v[i],num[i]; #include<bits/stdc++.h>//cmhao #defin ...
- Nginx:Nginx的安装
Nginx安装 首先安装依赖 #安装Nginx需要gcc openssl-devel pcre-devel zlib-devel依赖 yum -y install gcc openssl-devel ...
- Linux环境Nginx安装、调试以及PHP安装(转)
linux版本:64位CentOS 6.4 Nginx版本:nginx1.8.0 php版本:php5.5 1.编译安装Nginx 官网:http://wiki.nginx.org/Install ...
- XCTF re-100
一.无壳并拉入ida64静态调试(注释说的很明白了) 二.confuseKey是个关键函数,进入看看 发现就是将我们所输入的字符串分割,并把顺序调换了,调回来就是我们的flag. 三.flag: 提交 ...