python--Matplotlib(一)
基础知识薄弱的同学可以看看一下博客
https://www.cnblogs.com/dev-liu/p/pandas_plt_basic.html

https://blog.csdn.net/Notzuonotdied/article/details/77876080
我做了一些笔记,比较实用
scatter(x, y, s=None, c=None, marker=None, cmap=None, norm=None, vmin=None, vmax=None, alpha=None, linewidths=None, verts=None, edgecolors=None, hold=None, data=None, **kwargs)

x,y:array_like,shape(n,)

输入数据

s:标量或array_like,shape(n,),可选

    大小以点数^ 2。默认是`rcParams ['lines.markersize'] ** 2`。

c:颜色,顺序或颜色顺序,可选,默认:'b'

    `c`可以是单个颜色格式的字符串,也可以是一系列颜色

    规范的长度为`N`,或一系列`N`数字

    使用通过kwargs指定的`cmap`和`norm`映射到颜色

    (见下文)。请注意,`c`不应该是单个数字RGB或

    RGBA序列,因为这与数组无法区分

    值将被彩色映射。 `c`可以是一个二维数组,其中的

    行是RGB或RGBA,但是,包括单个的情况

    行为所有点指定相同的颜色。

marker:`〜matplotlib.markers.MarkerStyle`,可选,默认值:'o'

    请参阅`〜matplotlib.markers`以获取有关不同的更多信息

    标记分散支持的样式。 `marker`可以是

    该类的实例或特定文本的简写

    标记。

cmap:`〜matplotlib.colors.Colormap`,可选,默认:无

    一个`〜matplotlib.colors.Colormap`实例或注册名称。

    `cmap`仅在`c`是浮点数组时使用。如果没有,

    默认为rc`image.cmap`。

norm:`〜matplotlib.colors.Normalize`,可选,默认:无

    `〜matplotlib.colors.Normalize`实例用于缩放

    亮度数据为0,1。`norm`只有在`c`是一个数组时才被使用

    彩车。如果`None',则使用默认值:func:`normalize`。

vmin,vmax:标量,可选,默认值:无

    `vmin`和`vmax`与`norm`结合使用来标准化

    亮度数据。如果其中任何一个都是`无',那么最小和最大的

    使用颜色数组。请注意,如果你通过一个“规范”实例,你的

    `vmin`和`vmax`的设置将被忽略。

alpha:标量,可选,默认值:无

    alpha混合值,介于0(透明)和1(不透明)之间,

linewidths:标量或array_like,可选,默认值:无

    如果无,则默认为(lines.linewidth,)。

verts:(x,y)的序列,可选

    如果`marker`为None,这些顶点将用于

    构建标记。标记的中心位于

    在(0,0)为标准化单位。整体标记重新调整

    由``s``完成。

 edgecolors :颜色或颜色顺序,可选,默认值:无

    如果无,则默认为'face'

    如果'face',边缘颜色将永远是相同的

    脸色。

    如果它是'none',补丁边界不会

    被画下来。

    对于未填充的标记,“edgecolors”kwarg

    被忽视并被迫在内部“面对”
matplotlib.pyplot.bar(left, height, alpha=1, width=0.8, color=, edgecolor=, label=, lw=3,align='center', data=None,bottom=None)

left:x轴的位置序列,一般采用arange函数产生一个序列;

height:y轴的数值序列,也就是柱形图的高度,一般就是我们需要展示的数据;

alpha:透明度

width:为柱形图的宽度,一般这是为0.8即可;

color或facecolor:柱形图填充的颜色;

edgecolor:图形边缘颜色

label:解释每个图像代表的含义

linewidth or linewidths or lw:边缘or线的宽度

align

    'center': Center the base on the x positions.

    'edge': Align the left edges of the bars with the x positions.

bottom :  The y coordinate(s) of the bars bases (default: 0).

matplotlib.pyplot.x(y)ticks(ticks=None, labels=None, **kwargs)、

    locs, labels = xticks()           # Get locations and labels

    xticks(ticks, [labels], **kwargs)  # Set locations and labels

    rotation='vertical'

savefig(fname, dpi=None, facecolor='w', edgecolor='w',

        orientation='portrait', papertype=None, format=None,

        transparent=False, bbox_inches=None, pad_inches=0.1,

        frameon=None, metadata=None)

    dpi参数指定图像的分辨率
matplotlib实例
#-*- coding:utf-8 -*-
import numpy as np
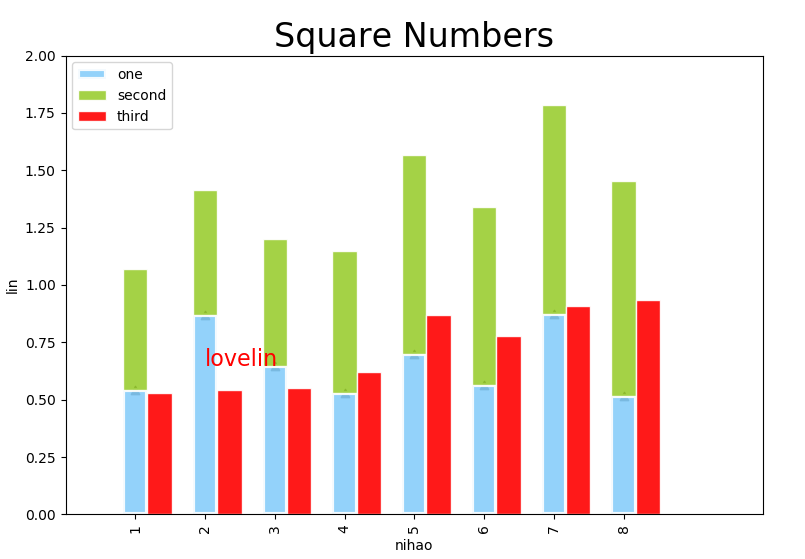
from matplotlib import pyplot as plt plt.figure(figsize=(9,6)) plt.title("Square Numbers", fontsize=24)
#fig,plt = plt.subplots(figsize=(9,6))
n = 8
X = np.arange(n)+1 #X是1,2,3,4,5,6,7,8,柱的个数 #uniform均匀分布的随机数,normal是正态分布的随机数,0.5-1均匀分布的数,一共有n个
Y1 = np.random.uniform(0.5,1.0,n)
Y2 = np.random.uniform(0.5,1.0,n)
#scatter 散点图
plt.scatter(X,Y1,marker='^',c='black')
#添加注释
plt.text(X[1],Y1[2],r'lovelin',fontdict={'size':16,'color':'r'})
#bar 柱状图
plt.bar(X, Y1, alpha=0.9, width = 0.35, facecolor = 'lightskyblue', edgecolor = 'white', label='one', lw=3)
#x轴添加注释
plt.xticks(X,X,rotation='vertical') #x,y添加标签
plt.xlabel('nihao')
plt.ylabel('lin') plt.bar(X, Y2, alpha=0.9, width = 0.35, bottom=Y1,facecolor = 'yellowgreen', edgecolor = 'white', label='second', lw=1)
plt.bar(X+0.35, Y2, alpha=0.9, width = 0.35,facecolor = 'red', edgecolor = 'white', label='third', lw=1)
#显示标签
plt.legend(loc="upper left") # label的位置在左上,没有这句会找不到label去哪了 #plt.tick_params(axis='both', which='major', labelsize=14)
#x,y轴数据的范围
plt.axis([0, 10, 0, 2])
#保存图片
plt.savefig("fig1.png", bbox_inches="tight",dpi=200)
#显示画布
plt.show()
pandas+matplotlib
#-*- coding:utf-8 -*-
import numpy as np
import pandas as pd
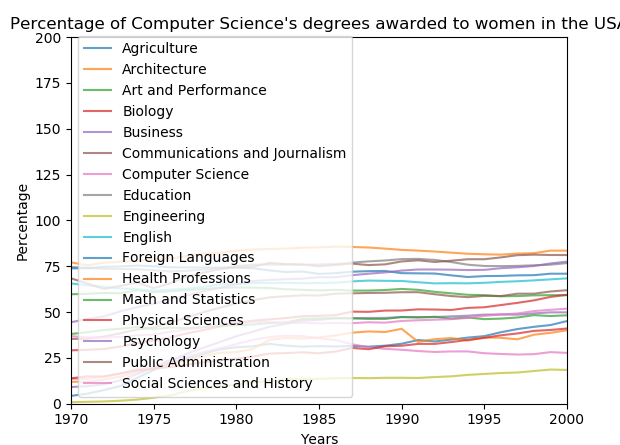
import matplotlib.pyplot as plt df = pd.read_csv('data2.csv',index_col='Year') df_cs = df['Computer Science']
df_ms = df['Math and Statistics']
#plt.plot(df_cs)
df.plot(alpha=0.7) plt.title("Percentage of Computer Science's degrees awarded to women in the USA")
# 为X轴添加标签
plt.xlabel("Years")
# 为Y轴添加标签
plt.ylabel("Percentage") #df_cs.plot(color='b', style='.-', legend=True)
#df_ms.plot(color='r', style='-', legend=True) plt.axis([1970, 2000, 0, 200]) plt.show()
python--Matplotlib(一)的更多相关文章
- python matplotlib 中文显示参数设置
python matplotlib 中文显示参数设置 方法一:每次编写代码时进行参数设置 #coding:utf-8import matplotlib.pyplot as pltplt.rcParam ...
- python matplotlib plot 数据中的中文无法正常显示的解决办法
转发自:http://blog.csdn.net/laoyaotask/article/details/22117745?utm_source=tuicool python matplotlib pl ...
- python matplotlib画图产生的Type 3 fonts字体没有嵌入问题
ScholarOne's 对python matplotlib画图产生的Type 3 fonts字体不兼容,更改措施: 在程序中添加如下语句 import matplotlib matplotlib. ...
- 使用Python matplotlib做动态曲线
今天看到“Python实时监控CPU使用率”的教程: https://www.w3cschool.cn/python3/python3-ja3d2z2g.html 自己也学习如何使用Python ma ...
- python matplotlib 中文显示乱码设置
python matplotlib 中文显示乱码设置 原因:是matplotlib库中没有中文字体.1 解决方案:1.进入C:\Anaconda64\Lib\site-packages\matplot ...
- Python - matplotlib 数据可视化
在许多实际问题中,经常要对给出的数据进行可视化,便于观察. 今天专门针对Python中的数据可视化模块--matplotlib这块内容系统的整理,方便查找使用. 本文来自于对<利用python进 ...
- 转:使用 python Matplotlib 库 绘图 及 相关问题
使用 python Matplotlib 库绘图 转:http://blog.csdn.net/daniel_ustc/article/details/9714163 Matplotlib ...
- python+matplotlib 绘制等高线
python+matplotlib 绘制等高线 步骤有七: 有一个m*n维的矩阵(data),其元素的值代表高度 构造两个向量:x(1*n)和y(1*m).这两个向量用来构造网格坐标矩阵(网格坐标矩阵 ...
- 安装python Matplotlib 库
转:使用 python Matplotlib 库 绘图 及 相关问题 使用 python Matplotlib 库绘图 转:http://blog.csdn.net/daniel_ustc ...
- python matplotlib.pyplot 散点图详解(1)
python matplotlib.pyplot散点图详解(1) 一.创建散点图 可以用scatter函数创建散点图 并使用show函数显示散点图 代码如下: import matplotlib.py ...
随机推荐
- IIS下发布关于Excel导入导出时遇到的问题集锦(转)
问题描述 1.Excel每个工作薄(sheet)生成记录行数 2.asp.net关于导出Excel的一些问题的集锦 3.下载失败,临时文件或其所在磁盘不可写 4.未能加载文件或程序集“Microsof ...
- Visual Studio 2017 安装失败,你们有这样的问题吗?怎么解决
由于发生一个或多个包故障,产品未能安装列出的工作负荷和组件. 工作负荷不完整 使用 JavaScript 的移动开发 (Microsoft.VisualStudio.Workload.WebCross ...
- Chrome谷歌浏览器中js代码Array.sort排序的bug乱序解决办法
[现象] 代码如下: var list = [{ n: "a", v: 1 }, { n: "b", v: 1 }, { n: "c", v ...
- MySQL锁行锁表
select..for update; 给数据库表手动上锁 --锁行Begin; for update; --给 id=1 的行加上排它锁且 id 有索引 ; Commit; -- 锁表 BEGIN; ...
- Oracle 数据库 导入导出空表解决办法!
expdp导出:(打开CMD) 先创建(任意盘符):\oracle_data 文件夹 1.sqlplus / as sysdba;2.create or replace directory d_nam ...
- Spring-cloud学习线路
学习本学习路线学习完,大家将会对微服务.Spring Cloud.Docker.Kubernetes有一个系统.全面的认识.通过学习,将能掌握相关的知识体系,并能够投入到项目实战中去. 本学习路线采用 ...
- kafka brokers配置参数详解
基本配置如下: -broker.id-log.dirs-zookeeper.connect Topic-level配置以及其默认值将在下面讨论. Property Default Descriptio ...
- agc001E - BBQ Hard(dp 组合数)
题意 题目链接 Sol 非常妙的一道题目. 首先,我们可以把\(C_{a_i + b_i + a_j + b_j}^{a_i + a_j}\)看做从\((-a_i, -b_i)\)走到\((a_j, ...
- HDU 3639 Hawk-and-Chicken(强连通分量+缩点)
版权声明:本文为博主原创文章.未经博主同意不得转载. https://blog.csdn.net/u013480600/article/details/32140501 HDU 3639 Hawk-a ...
- 使用Sort方法对数组进行快速排序
实现效果: 知识运用: Array类的Sort方法 public static void Sort(Array array) // array:要排序的一维Array数组 实现代码: static ...