20145208 GDB调试汇编堆栈过程分析
20145208 GDB调试汇编堆栈过程分析
测试代码
#include<stdio.h>

short addend1 = 1;

static int addend2 = 2;

const static long addend3 = 3;

static int g(int x)

{

	return x + addend1;

}

static const int f(int x)

{

	return g(x + addend2);

}

int main(void)

{

	return f(8) + addend3;

}
分析过程
使用
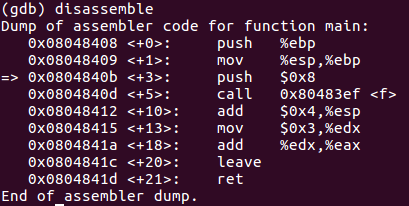
gcc -g example.c -o example -m32指令在64位的机器上产生32位汇编,然后使用gdb example指令进入gdb调试器进入之后先在main函数处设置一个断点,再run一下,使用
disassemble指令获取汇编代码,用i(info) r(registers)指令查看各寄存器的值:


- 可见此时主函数的栈基址为 0xffffcf98,用
x(examine)指令查看内存地址中的值,但目前%esp所指堆栈内容为0,%ebp所指内容也为0

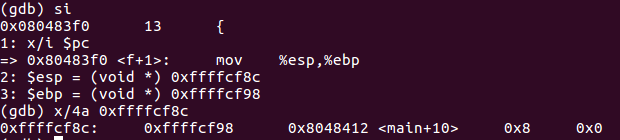
- 首先,结合display命令和寄存器或pc内部变量,做如下设置:display /i $pc,这样在每次执行下一条汇编语句时,都会显示出当前执行的语句。下面展示每一步时
%esp、%ebp和堆栈内容的变化:

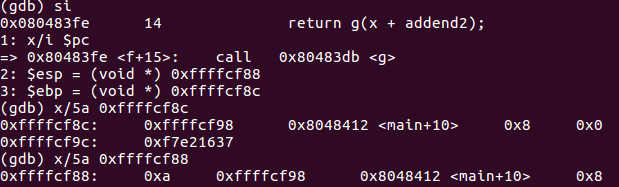
- call指令将下一条指令的地址入栈,此时
%esp,%ebp和堆栈的值为:

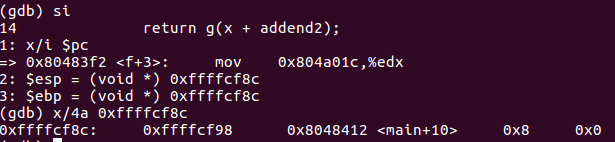
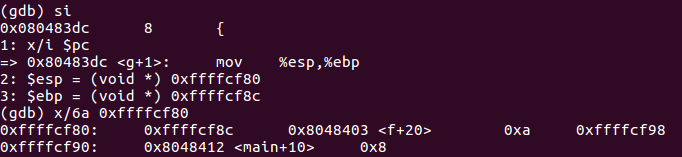
- 将上一个函数的基址入栈,从当前
%esp开始作为新基址:
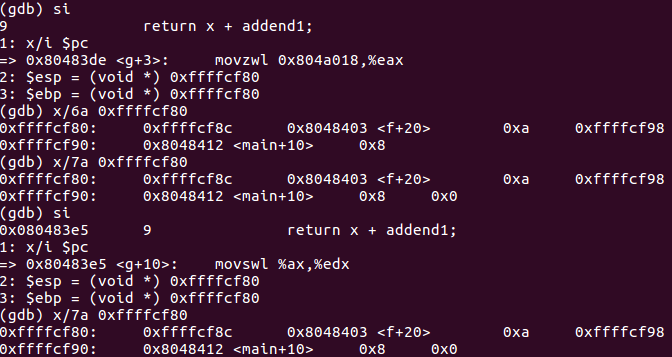
- 先为传参做准备:
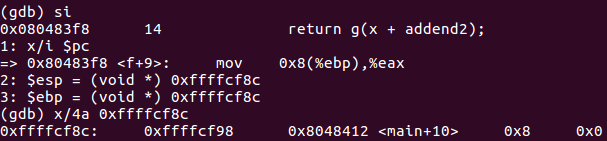
- 实参的计算在
%eax中进行:
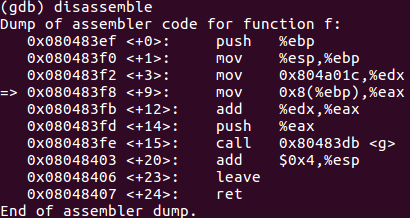
- f函数的汇编代码:
- 实参入栈:
- call指令将下一条指令的地址入栈:


- 计算short+int:
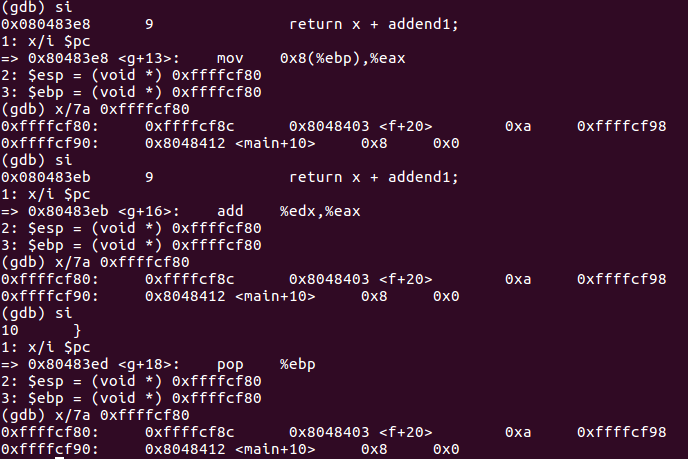
pop %ebp指令将栈顶弹到%ebp中,同时%esp增加4字节:

- ret指令将栈顶弹给
%eip:
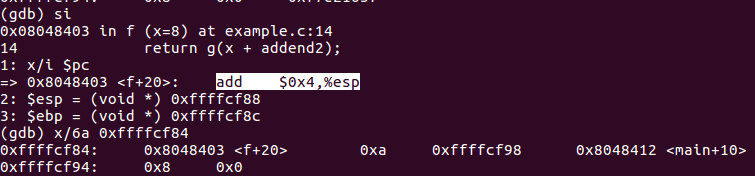
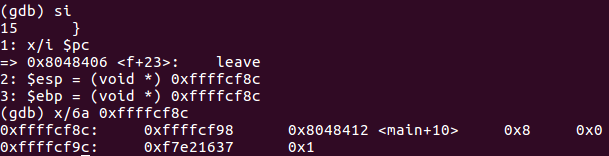
- 因为函数f修改了
%esp,所以用leave指令恢复。leave指令先将%esp对其到%ebp,然后把栈顶弹给%ebp:


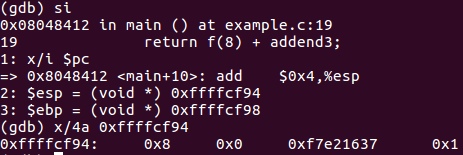
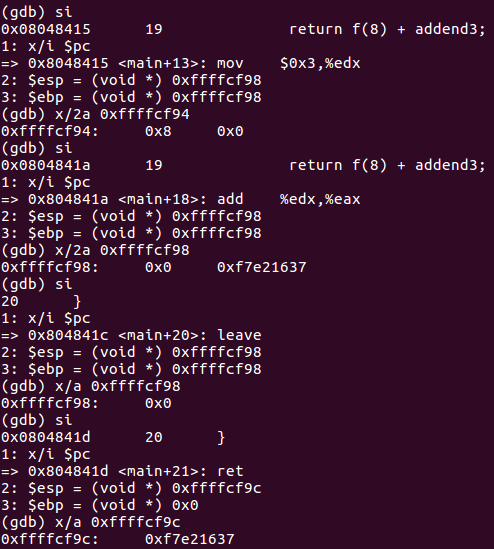
- 主函数汇编代码:
| 指令 | %esp | %ebp | %eip | %eax | 堆栈 |
|---|---|---|---|---|---|
| push $0x8 | 0xffffcf98 | 0xffffcf98 | 0x804840b | -134500932 | 0x0 |
| call 0x80483ef | 0xffffcf94 | 0xffffcf98 | 0x804840b | -134500932 | 0x8 0x0 |
| push %ebp | 0xffffcf90 | 0xffffcf98 | 0x80483ef | -134500932 | 0x8048412 0x8 0x0 |
| mov %esp,%ebp | 0xffffcf8c | 0xffffcf98 | 0x80483f0 | -134500932 | 0xffffcf98 0x8048412 0x8 0x0 |
| mov 0x804a01c,%edx | 0xffffcf8c | 0xffffcf8c | 0x80483f2 | -134500932 | 0xffffcf98 0x8048412 0x8 0x0 |
| mov 0x8(%ebp),%eax | 0xffffcf8c | 0xffffcf8c | 0x80483f8 | -134500932 | 0xffffcf98 0x8048412 0x8 0x0 |
| add %edx,%eax | 0xffffcf8c | 0xffffcf8c | 0x80483fb | 8 | 0xffffcf98 0x8048412 0x8 0x0 |
| push %eax | 0xffffcf8c | 0xffffcf8c | 0x80483fd | 10 | 0xffffcf98 0x8048412 0x8 0x0 |
| call 0x80483db | 0xffffcf88 | 0xffffcf8c | 0x80483fe | 10 | 0xa 0xffffcf98 0x8048412 0x8 0x0 |
| push %ebp | 0xffffcf84 | 0xffffcf8c | 0x80483db | 10 | 0x8048403 0xa 0xffffcf98 0x8048412 0x8 0x0 |
| mov %esp,%ebp | 0xffffcf80 | 0xffffcf8c | 0x80483dc | 10 | 0xffffcf8c 0x8048403 0xa 0xffffcf98 0x8048412 0x8 0x0 |
| movzwl 0x804a018,%eax | 0xffffcf80 | 0xffffcf80 | 0x80483de | 10 | 0xffffcf8c 0x8048403 0xa 0xffffcf98 0x8048412 0x8 0x0 |
| movswl %ax,%edx | 0xffffcf80 | 0xffffcf80 | 0x80483e5 | 1 | 0xffffcf8c 0x8048403 0xa 0xffffcf98 0x8048412 0x8 0x0 |
| mov 0x8(%ebp),%eax | 0xffffcf80 | 0xffffcf80 | 0x80483e8 | 1 | 0xffffcf8c 0x8048403 0xa 0xffffcf98 0x8048412 0x8 0x0 |
| add %edx,%eax | 0xffffcf80 | 0xffffcf80 | 0x80483eb | 10 | 0xffffcf8c 0x8048403 0xa 0xffffcf98 0x8048412 0x8 0x0 |
| pop %ebp | 0xffffcf80 | 0xffffcf80 | 0x80483ed | 11 | 0xffffcf8c 0x8048403 0xa 0xffffcf98 0x8048412 0x8 0x0 |
| ret | 0xffffcf84 | 0xffffcf8c | 0x80483ee | 11 | 0x8048403 0xa 0xffffcf98 0x8048412 0x8 0x0 |
| add $0x4,%esp | 0xffffcf88 | 0xffffcf8c | 0x8048403 | 11 | 0x8048403 0xa 0xffffcf98 0x8048412 0x8 0x0 |
| leave | 0xffffcf8c | 0xffffcf8c | 0x8048406 | 11 | 0xffffcf98 0x8048412 0x8 0x0 |
| ret | 0xffffcf90 | 0xffffcf98 | 0x8048407 | 11 | 0x8048412 0x8 0x0 |
| add $0x4,%esp | 0xffffcf94 | 0xffffcf98 | 0x8048412 | 11 | 0x8 0x0 |
| mov $0x3,%edx | 0xffffcf98 | 0xffffcf98 | 0x8048415 | 11 | 0x0 |
| add %edx,%eax | 0xffffcf98 | 0xffffcf98 | 0x804841a | 11 | 0x0 |
| leave | 0xffffcf98 | 0xffffcf98 | 0x804841c | 14 | 0x0 |
| ret | 0xffffcf9c | 0x0 | 0x804841d | 14 |
20145208 GDB调试汇编堆栈过程分析的更多相关文章
- GDB调试汇编堆栈过程分析
GDB调试汇编堆栈过程分析 分析过程 这是我的C源文件:click here 使用gcc - g example.c -o example -m32指令在64位的机器上产生32位汇编,然后使用gdb ...
- 20145212——GDB调试汇编堆栈过程分析
GDB调试汇编堆栈过程分析 测试代码 #include <stdio.h> short val = 1; int vv = 2; int g(int xxx) { return xxx + ...
- 20145223《信息安全系统设计基础》 GDB调试汇编堆栈过程分析
20145223<信息安全系统设计基础> GDB调试汇编堆栈过程分析 分析的c语言源码 生成汇编代码--命令:gcc -g example.c -o example -m32 进入gdb调 ...
- 赵文豪 GDB调试汇编堆栈过程分析
GDB调试汇编堆栈过程分析 使用gcc - g example.c -o example -m32指令在64位的机器上产生32位汇编,然后使用gdb example指令进入gdb调试器: 使用gdb调 ...
- 20145337 GDB调试汇编堆栈过程分析
20145337 GDB调试汇编堆栈过程分析 测试代码 #include<stdio.h> short addend1 = 1; static int addend2 = 2; const ...
- 20145218 GDB调试汇编堆栈过程分析
GDB调试汇编堆栈过程分析 虚拟机中分析过程 输入gcc - g example.c -o example -m32指令在64位机器上产生32位汇编,但出现以下错误: 这时需要使用sudo apt-g ...
- 20145236 GDB调试汇编堆栈过程分析
GDB调试汇编堆栈过程分析 首先需要输入sudo apt-get install libc6-dev-i386安装一个库才能产生汇编代码,然后输入gcc - g example.c -o exampl ...
- 20145312 GDB调试汇编堆栈过程分析
20145312 GDB调试汇编堆栈过程分析 参考资料 卢肖明同学的博客:<GDB调试汇编堆栈过程分析>: http://www.cnblogs.com/lxm20145215----/p ...
- 20145240 GDB调试汇编堆栈过程分析
20145240 GDB调试汇编堆栈过程分析 测试代码 #include<stdio.h> short addend1 = 1; static int addend2 = 2; const ...
随机推荐
- Cropper – 简单的 jQuery 图片裁剪插件
Cropper 是一个简单的 jQuery 图像裁剪插件.它支持选项,方法,事件,触摸(移动),缩放,旋转.输出的裁剪数据基于原始图像大小,这样你就可以用它们来直接裁剪图像. 如果你尝试裁剪跨域图像, ...
- H5与CS3权威上.5 绘制图形(1)
1.canvas元素基础知识 (1)在页面上放置canvas元素,相当于在页面上放置一块"画布",可以用Javascript编写在其中进行绘画的脚本. (2)在页面中放置canva ...
- require 那点事
require 提供了一个 模块管理的方案 不太熟悉的话挺多暗坑 团队引入 需谨慎 彻底熟悉后 再引入项目 ADM规范 Asynchronous Module Definition - 异步加载模块规 ...
- 获取WIFI密码
在十年前,我还在上初中,班上只有极少数的富二代用得起手机:几年后诺基亚.摩托罗拉.三星手机开始盛行:近些年,安卓.苹果系统手机占据了基本整个市场,WIFI出变得越来越重要. Wifi万能钥匙数据库存储 ...
- Objective-C Runtime 运行时之一:类与对象
Objective-C语言是一门动态语言,它将很多静态语言在编译和链接时期做的事放到了运行时来处理.这种动态语言的优势在于:我们写代码时更具灵活性,如我们可以把消息转发给我们想要的对象,或者随意交换一 ...
- 解析Javascript事件冒泡机制
本资源引自: 解析Javascript事件冒泡机制 - 我的程序人生 - 博客频道 - CSDN.NET http://blog.csdn.net/luanlouis/article/details/ ...
- Git 简易手册
前言 这里就不介绍 git 了,表一看到命令行就怕怕,常用的命令也就这些,基本满足 99% 以上的项目需求,非常实用. 声明 欢迎转载,但请保留文章原始出处:) 博客园:http://www.cnbl ...
- Mac安装mysql遇到的坑
使用XMPP前安装了mysql,小白遇到好多坑,不要见怪 mysql官网下载,选择Community中扩展名为dmg的文件 安装完成后要记住密码,重要的事情只说一遍,对了,安装时也没有偏好设置和自启动 ...
- iOS --NSAttributedString
字符属性可以应用于 attributed string 的文本中. 文/iOS_成才录(简书作者) 原文链接:http://www.jianshu.com/p/03a741246737 著作权归作者所 ...
- TableViewCell重影问题
UITableView继承自UIScrollview,是苹果为我们封装好的一个基于scroll的控件.上面主要是一个个的UITableViewCell,可以让UITableViewCell响应一些点击 ...